


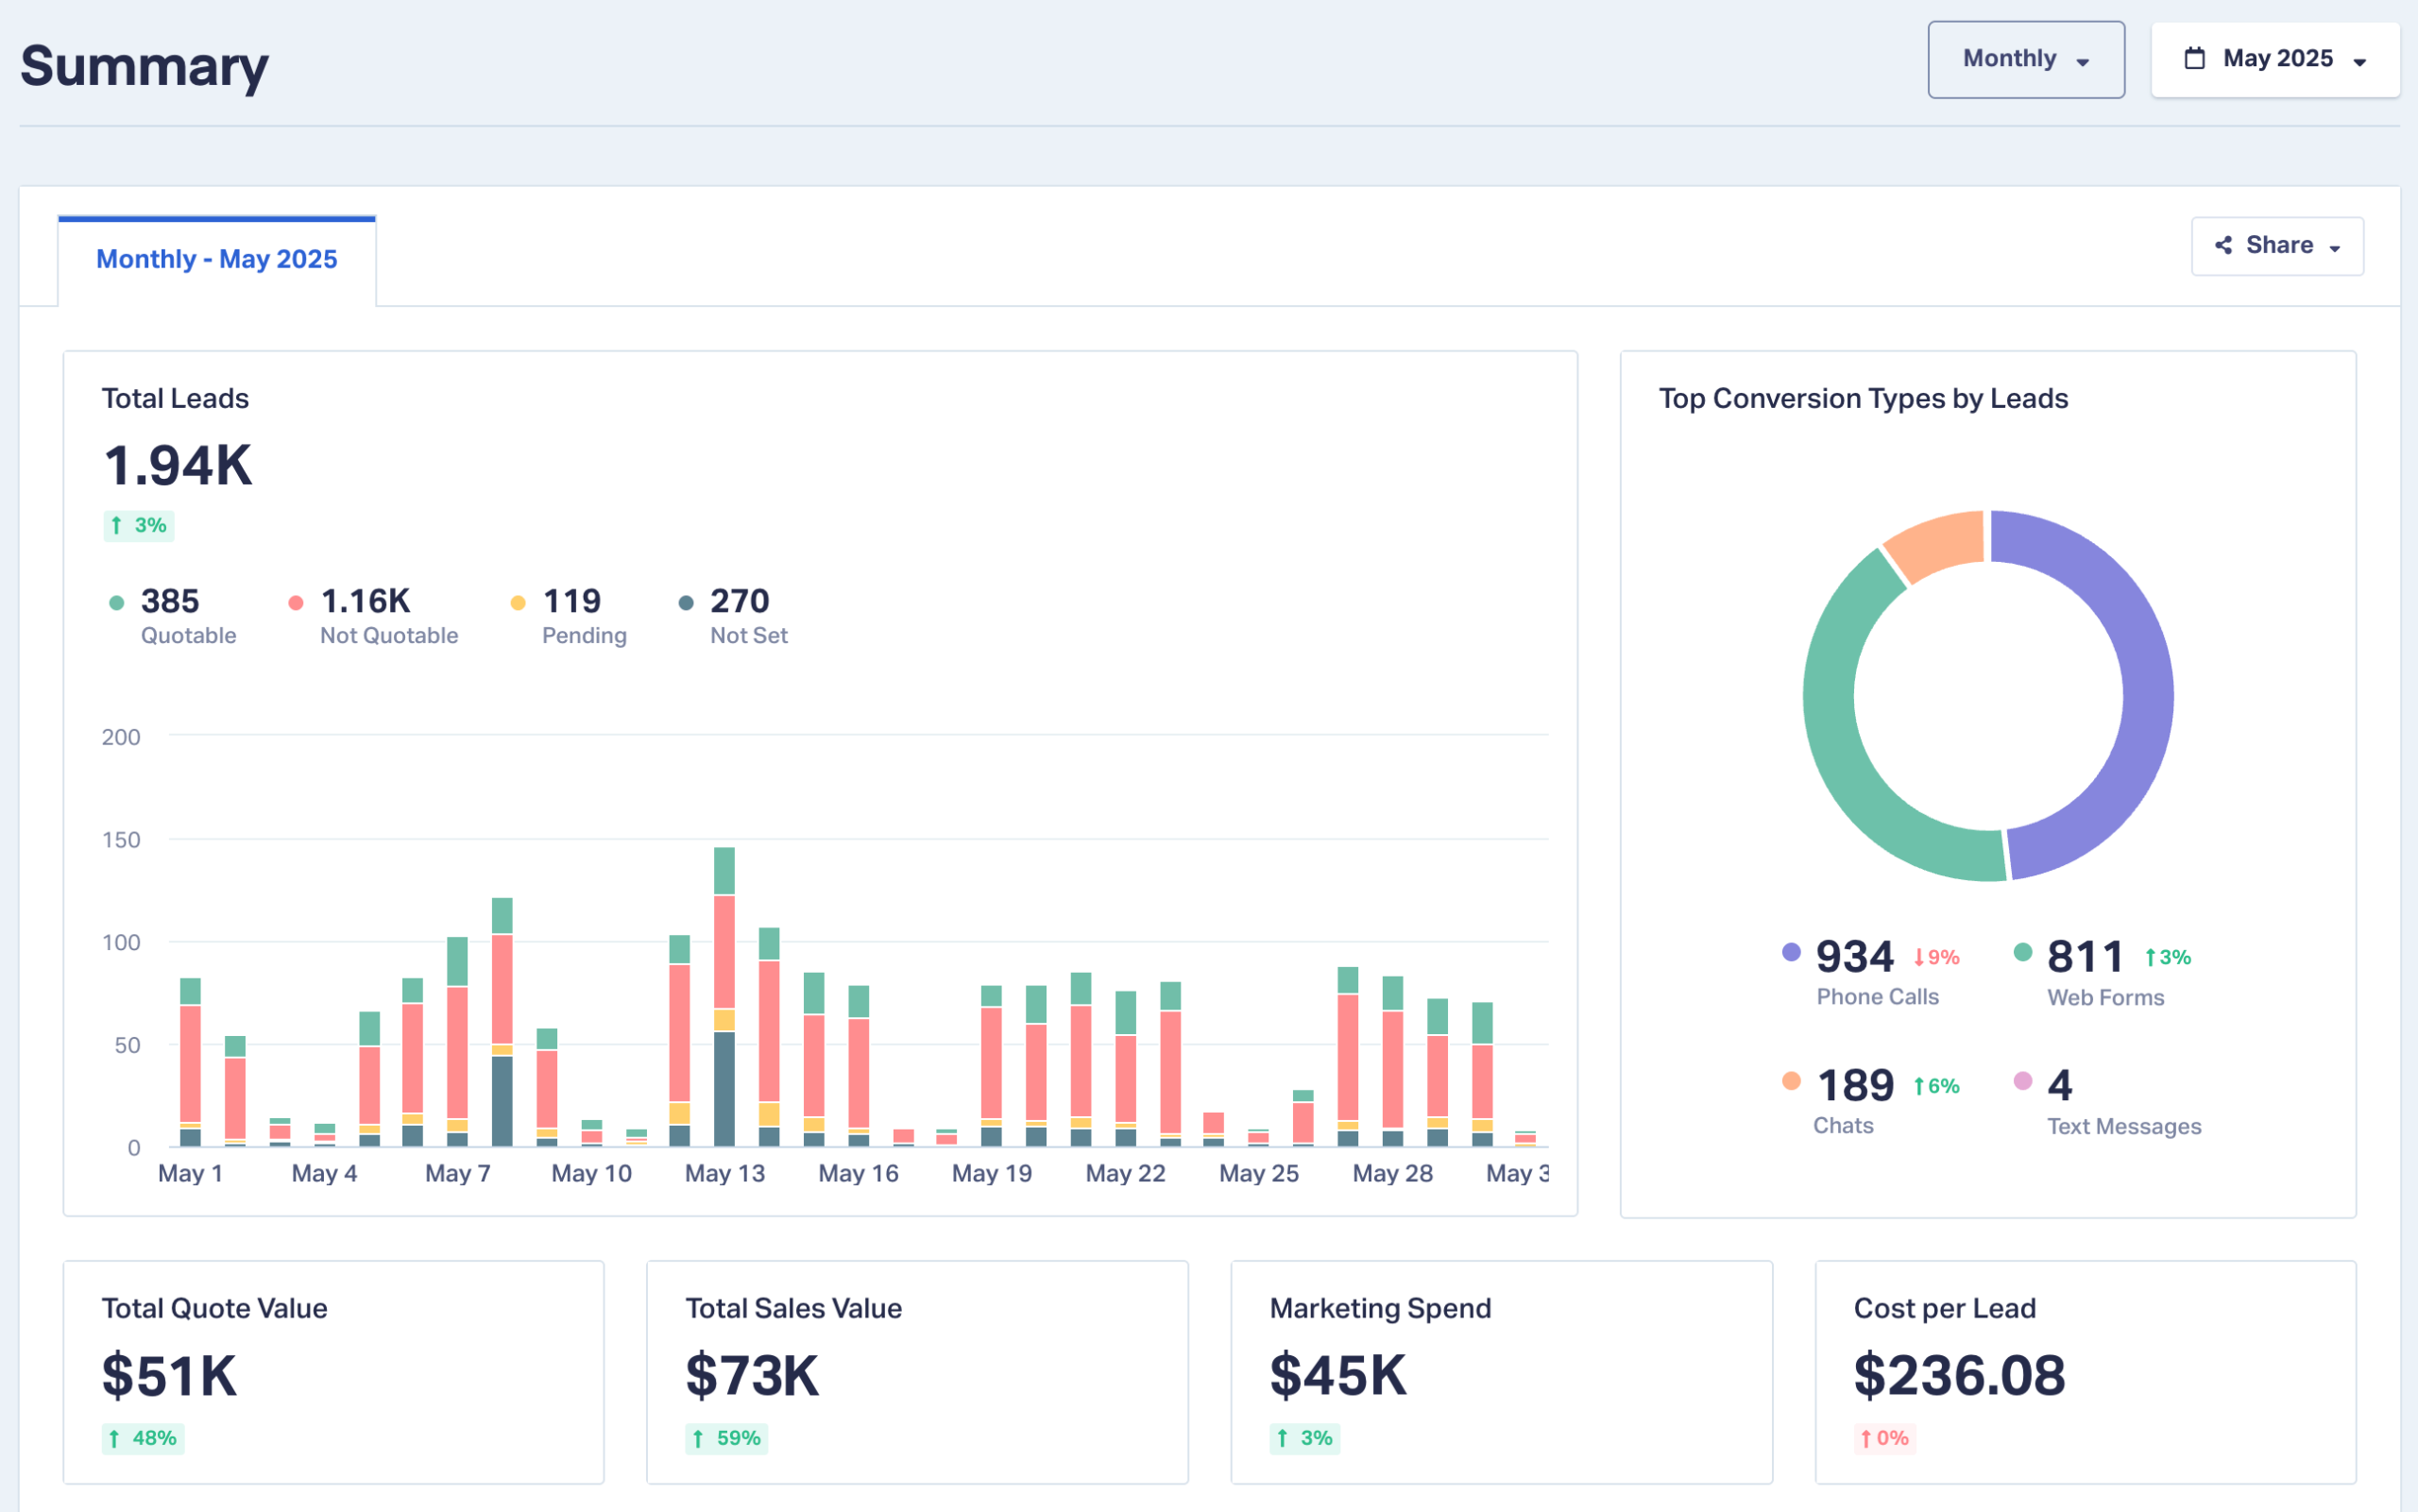
Marketers shouldn’t have to stare at a spinning loader while their data crunches—or guess which channel actually drives revenue. That’s why we’ve overhauled the Summary Report to deliver the answers you need in a flash:
- Near-instant load times for every account, no matter how much data you collect
- New metrics front-and-center: Marketing Spend and Cost per Lead
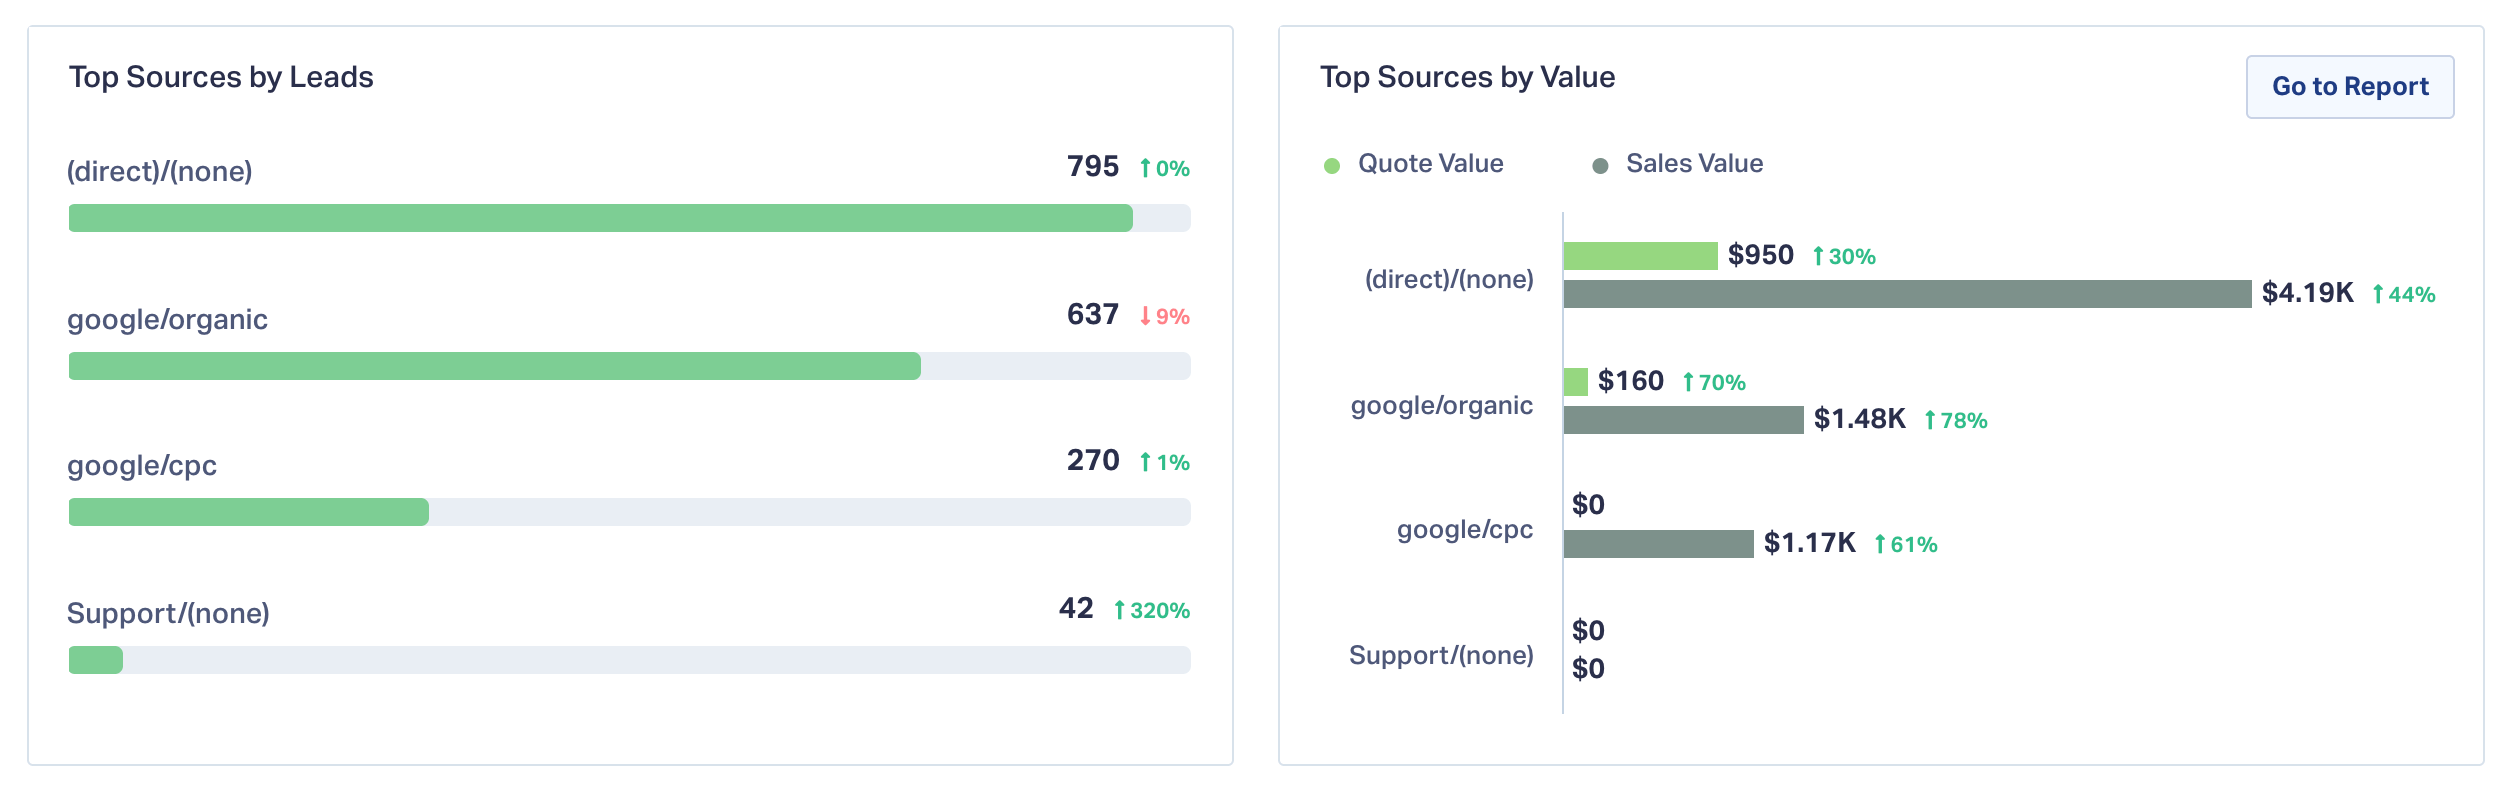
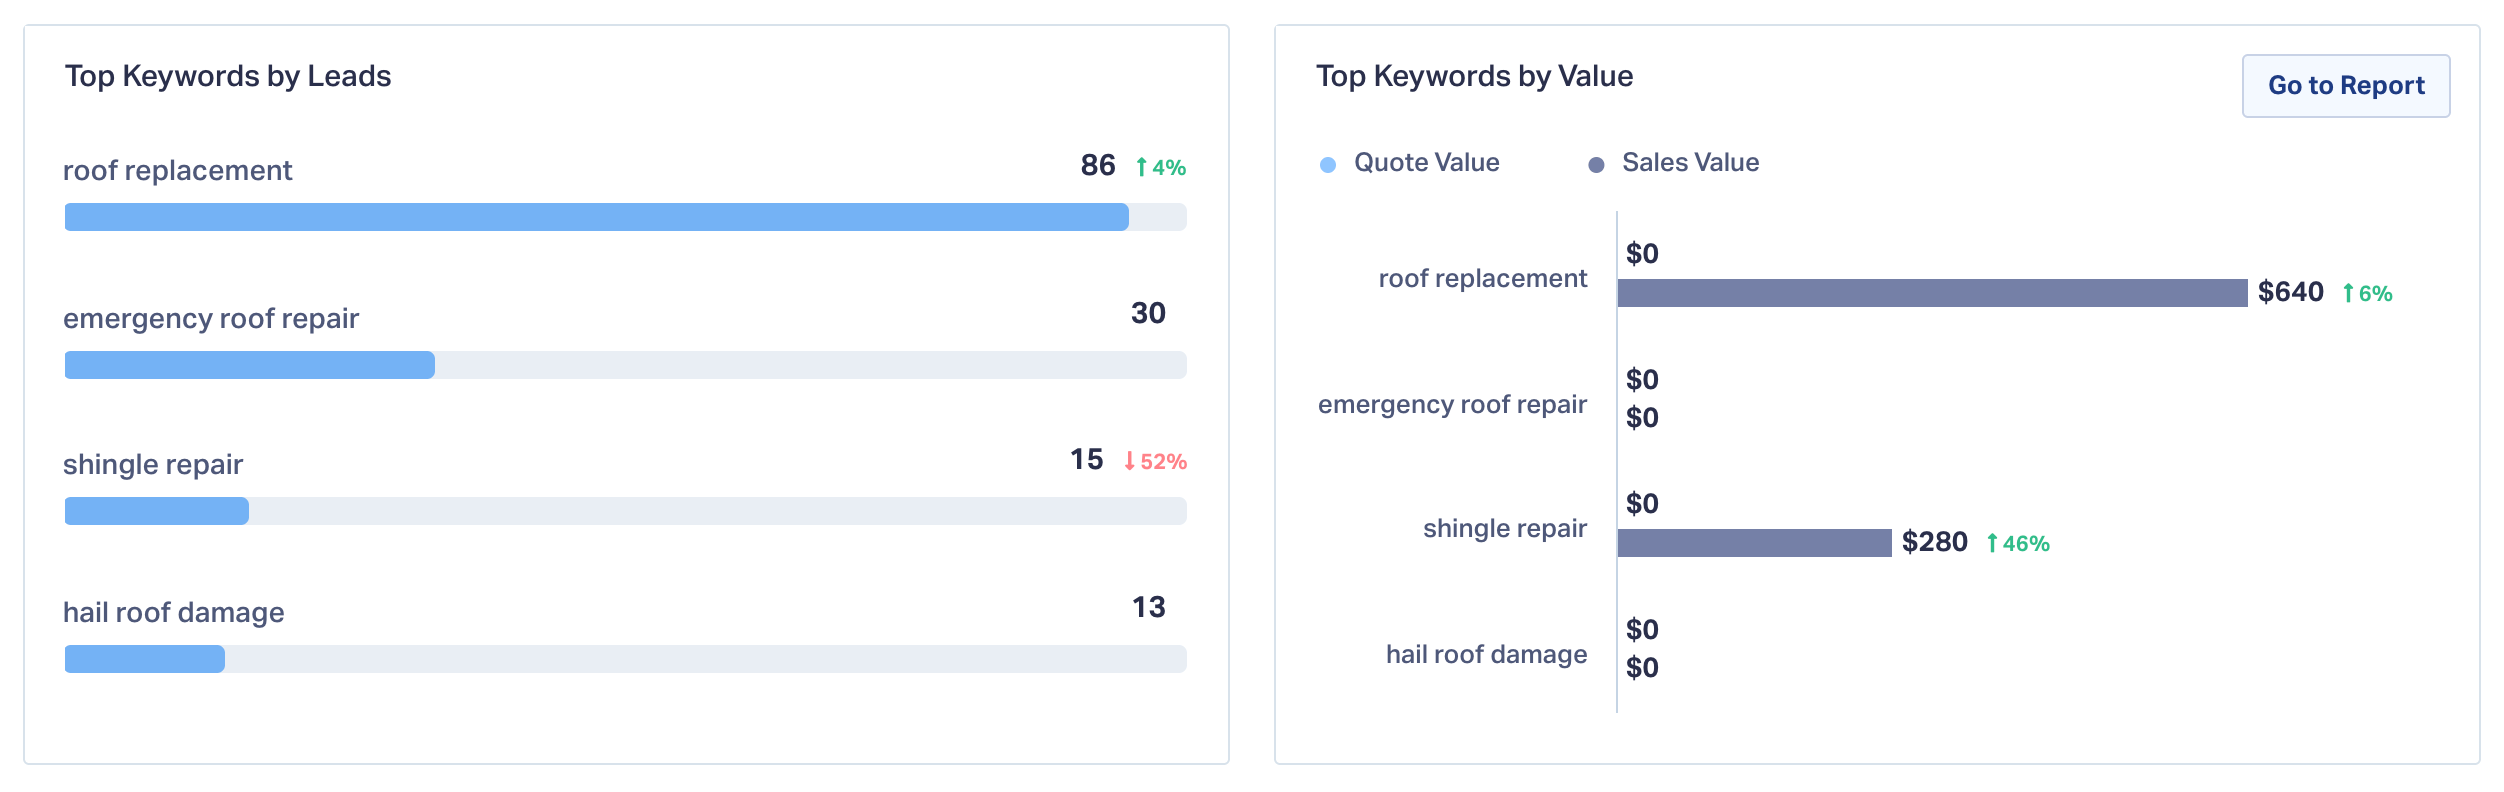
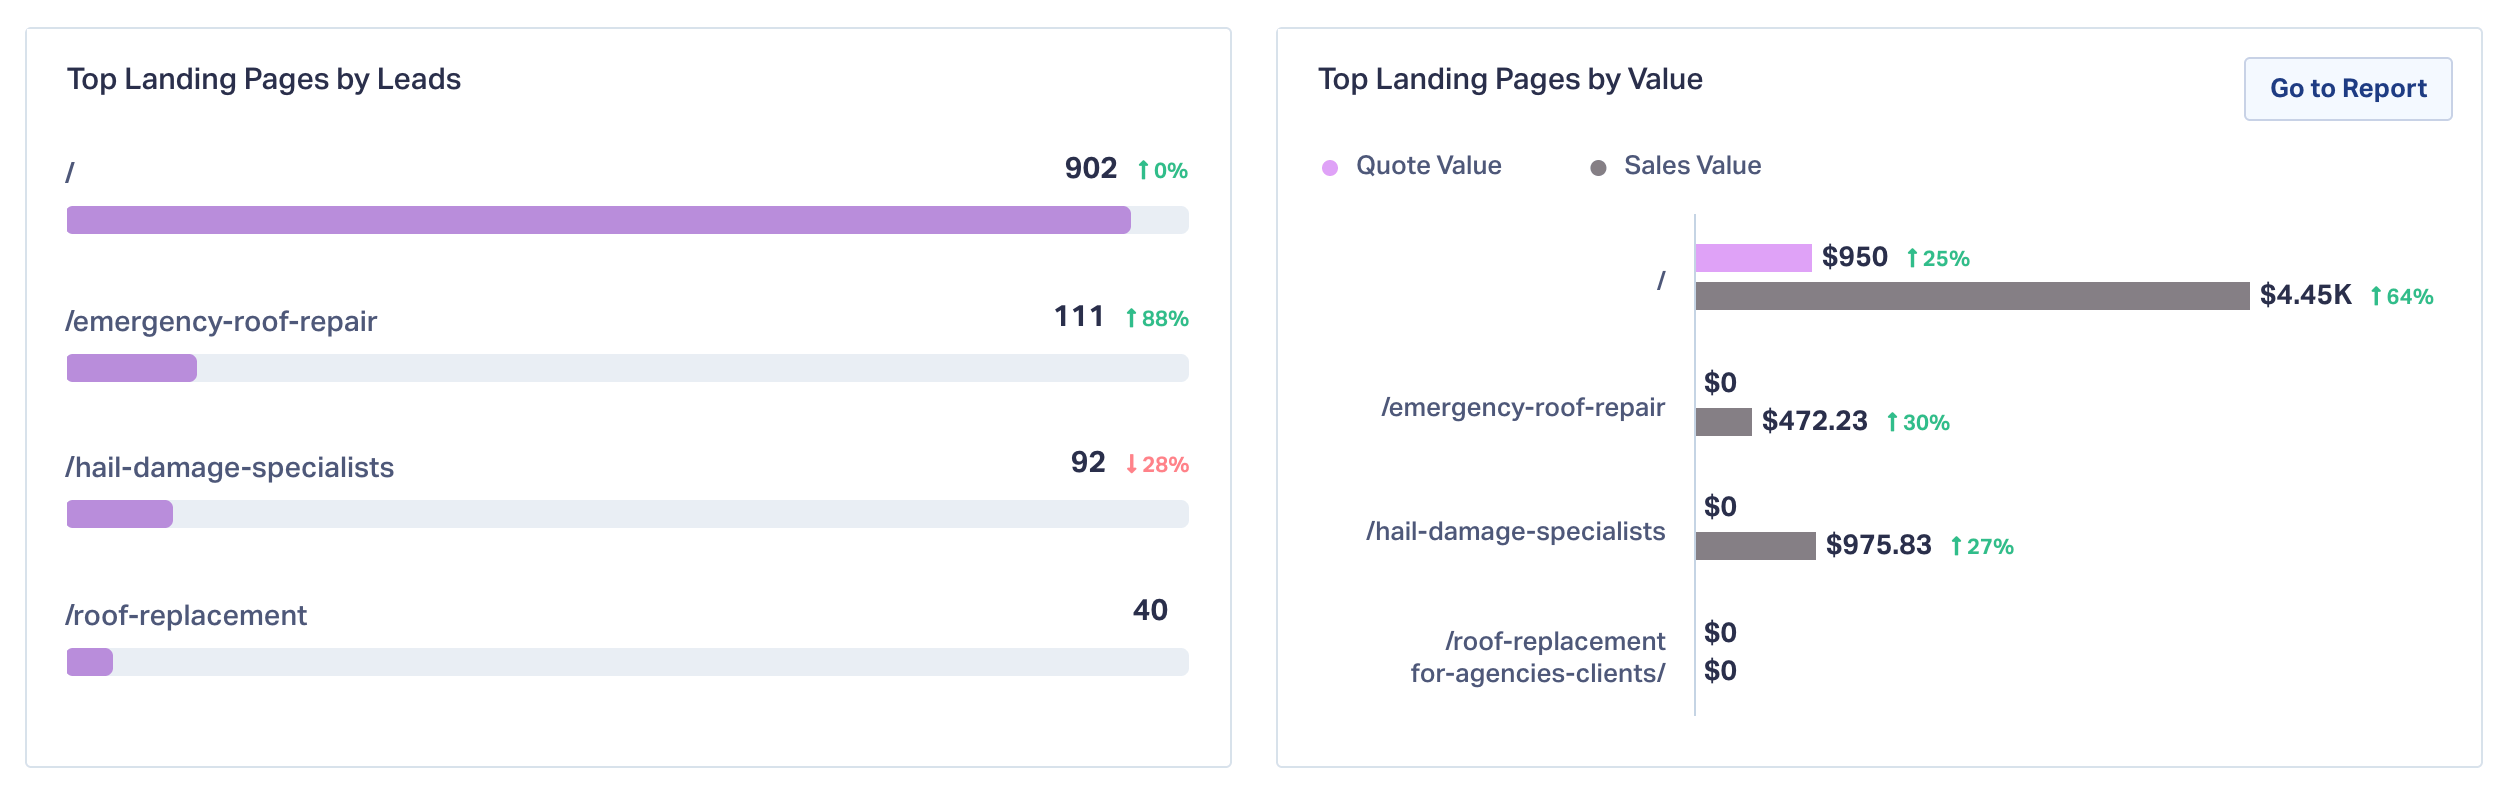
- Value-based views of your top Sources, Keywords, and Landing Pages
- Seamlessly updated Daily/Weekly/Monthly Email Reports that mirror the new on-screen layout
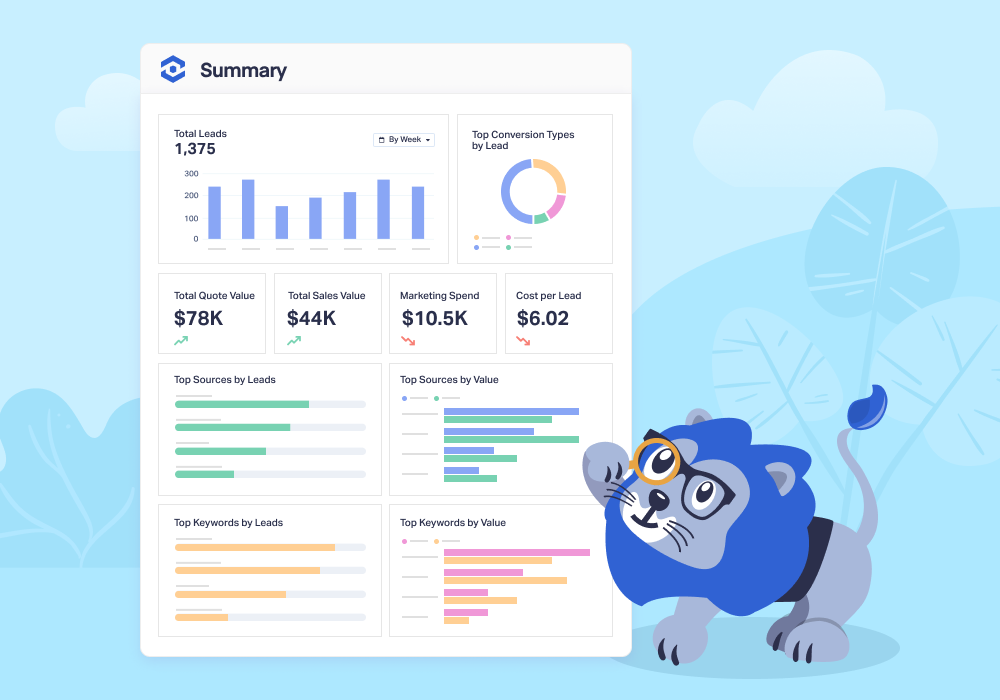
Available today in every WhatConverts account (free), the revamped Summary Report turns “what happened?” into “where should we invest next?” all on one page.
What’s New in the Summary Report?
| Old Report | New Report |
| Could take some time to load (or time-out on large datasets) | Loads in seconds thanks to a new processing engine |
| Top Sources / Keywords / Landing Pages by lead count only | Keep the originals plus brand-new Value reports (Quote and Sales) |
| No spend data on the page | Marketing Spend and Cost per Lead modules when you connect Google Ads, Bing Ads, or Facebook Ads (Elite Plan) |
| Static totals | Interactive unlock prompts that guide you to add Quote/Sales Values or Marketing Spend for deeper insight |
Tip: Haven’t added Quote/Sales Value or Marketing Spend yet? Look for the gray “Unlock” buttons. One click takes you to Lead Manager to start populating numbers or shows you how to set up your Marketing Spend.
Why Value > Volume
Lead quantity is better than just clicks and impressions. But it’s still a blunt tool; value tells the real story. We highly recommend adding Quote and Sales Value to your leads on a regular basis.
With Quote and Sales Value visible alongside Marketing Spend (Elite Plan), you can:
- Spot high-ROI channels fast – See that Google Organic drove $28k in quotes last month, up 1,000%.
- Justify budget shifts – Reallocate dollars from campaigns that create more leads to ones that create more revenue.
- Calculate real ROI on the fly – Spend $10k, earn $44k in sales. It’s right there in the report.
- Track Cost per Lead trends – Rising CPL? Time to tweak bids, ads, or audiences before costs snowball.
Real-World Walk-Through: From Spend → Leads → Sales
Imagine an agency managing PPC for a home-services client:
- Marketing Spend this month: $12,000
- Cost per Lead: $60
- Top Source by Value: Google Ads (Roof Replacement) – $75,000 in Quote Value
- Top Keyword by Value: “roof replacement estimate” – $32,000 in Sales Value
- Top Landing Page by Value: /roofing-estimates – $41,500 in Sales Value
With these numbers on one screen, the strategist instantly knows where to double down and has a dollar-backed story for the client.
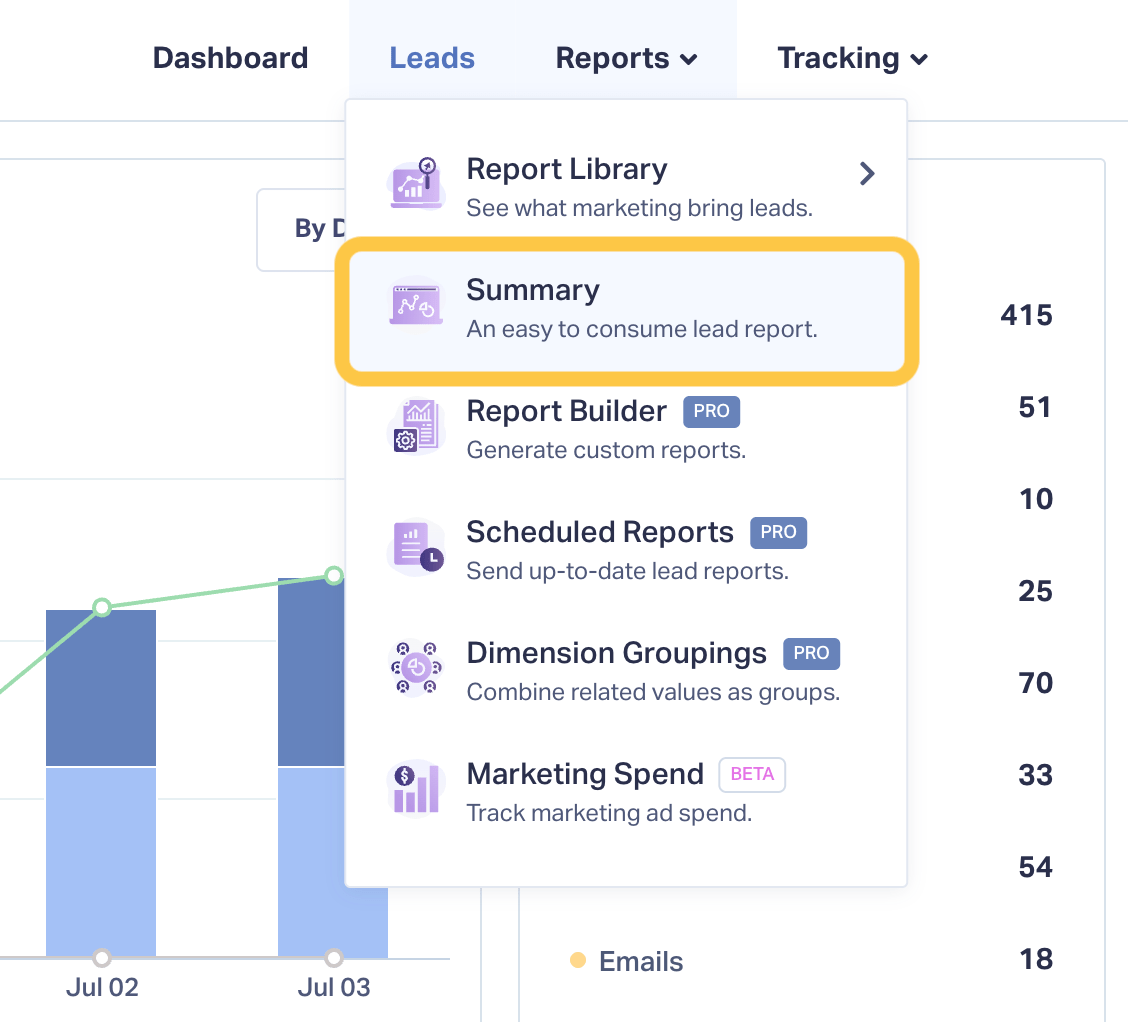
How to Open (or Schedule) Your New Report
- Log in to your WhatConverts account.
- Navigate to Reports → Summary—boom, data in seconds.

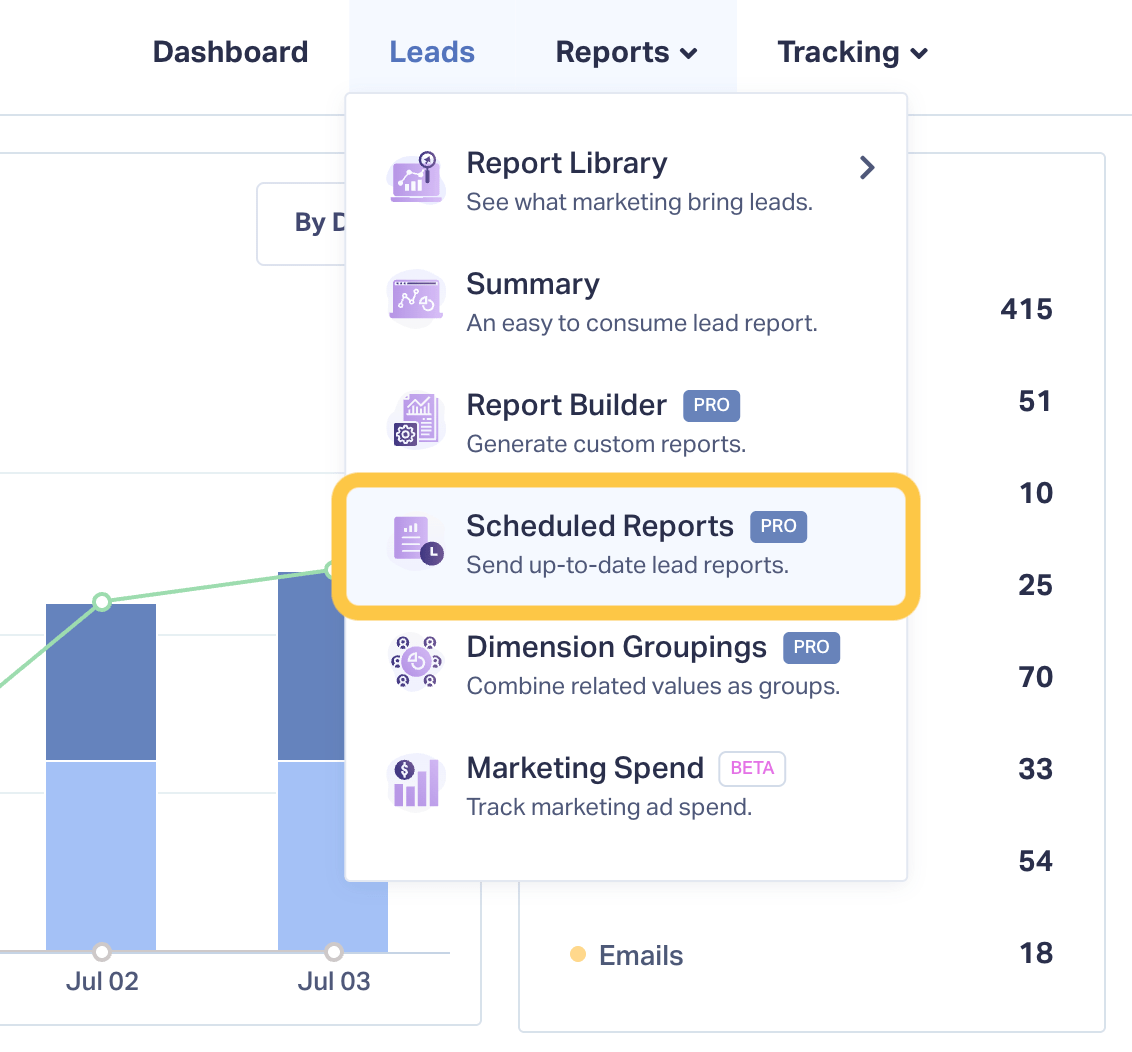
- Want it in your inbox? Click Schedule Report and enable the Daily, Weekly, or Monthly Summary report; the new layout comes with it.

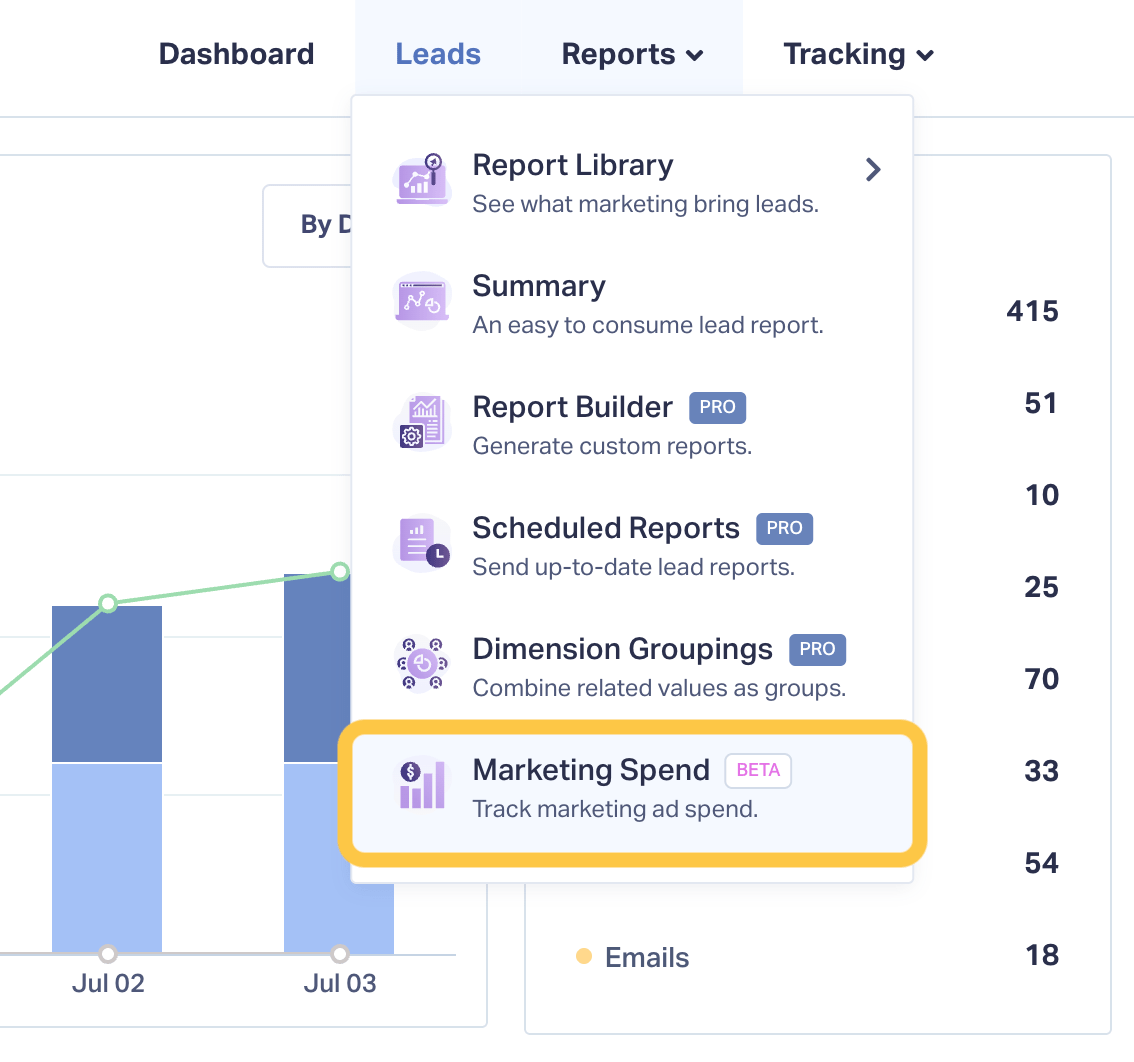
- Connect Google, Bing, or Facebook Ads spend under Tracking → Marketing Spend to light up Spend and CPL automatically (no spreadsheets required).

Wrapping Up
The updated Summary Report gives you speed, spend, and value in a glance, so you can move budget, impress stakeholders, and grow ROI without digging through multiple tabs.
Ready to see it live? Log in to your account and open Reports → Summary now.
Need a hand unlocking Quote, Sales, or Marketing Spend data? Contact Support, we’re here to help.
Get a FREE presentation of WhatConverts
One of our marketing experts will give you a full presentation of how WhatConverts can help you grow your business.
Schedule a Demo
Grow your business with WhatConverts


