

A falling CPL feels like a win. But it can just as easily signal a problem—and without the right data, the two look identical.
When low-value leads flood a channel, they drag the average CPL down. Volume goes up. Cost goes down. The dashboard looks healthy. But if those leads aren't quoting or closing, you're not getting more efficient—you're getting more waste.
The insight you need isn't just what CPL is doing. It's why.
Here's how WhatConverts's Marketing Channels Report gives you that answer before a budget call turns into an uncomfortable conversation.
Note: Not a WhatConverts user yet? Start your free 14-day trial of WhatConverts today or book a demo with a product expert to see how we help prove and grow your ROI.
The Problem: CPL Is a Single Number Hiding Two Realities
Cost per lead measures one thing: how much you spent divided by how many leads came in.
That's it. It says nothing about what those leads were worth.
So when CPL drops, there are two very different explanations:
- Your campaign got more efficient, attracting the same quality leads at lower cost.
- Your campaign attracted more low-intent, low-value leads—which diluted the average.
The first is a green light to scale. The second is a red flag you don't want to discover after you've doubled the budget.
The only way to tell the difference is to consistently track what your leads are actually worth.
The Shift: Pair CPL with What Leads Are Actually Worth
Spend data alone can't validate a CPL drop. You need to see what the leads that drove that drop are actually generating—in quoted pipeline and closed revenue.
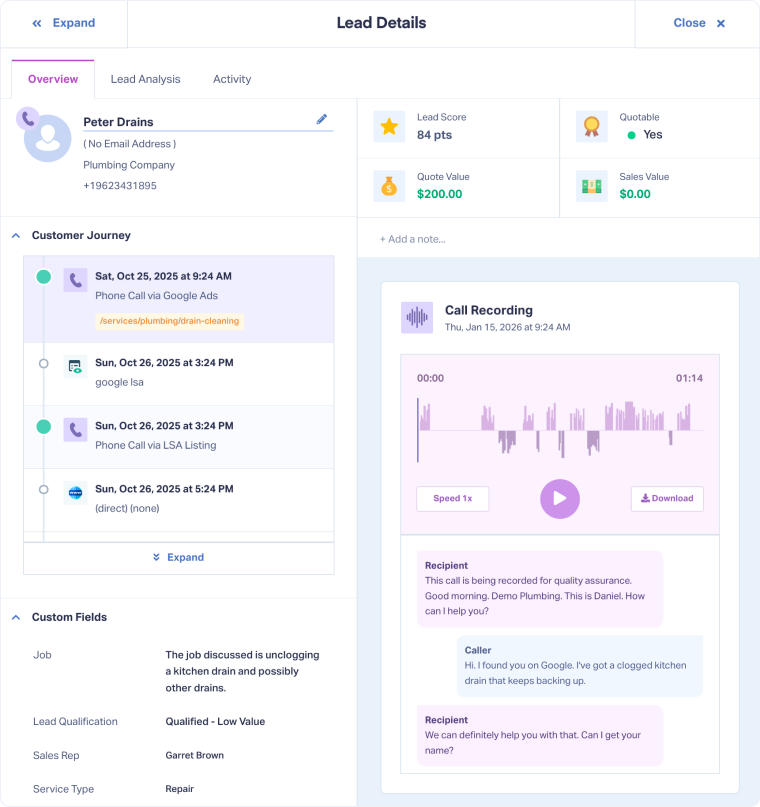
WhatConverts tracks this at the individual lead level. Every lead carries its marketing source, its quote value (the projected value of what the prospect was interested in), and its sales value (what actually closed).
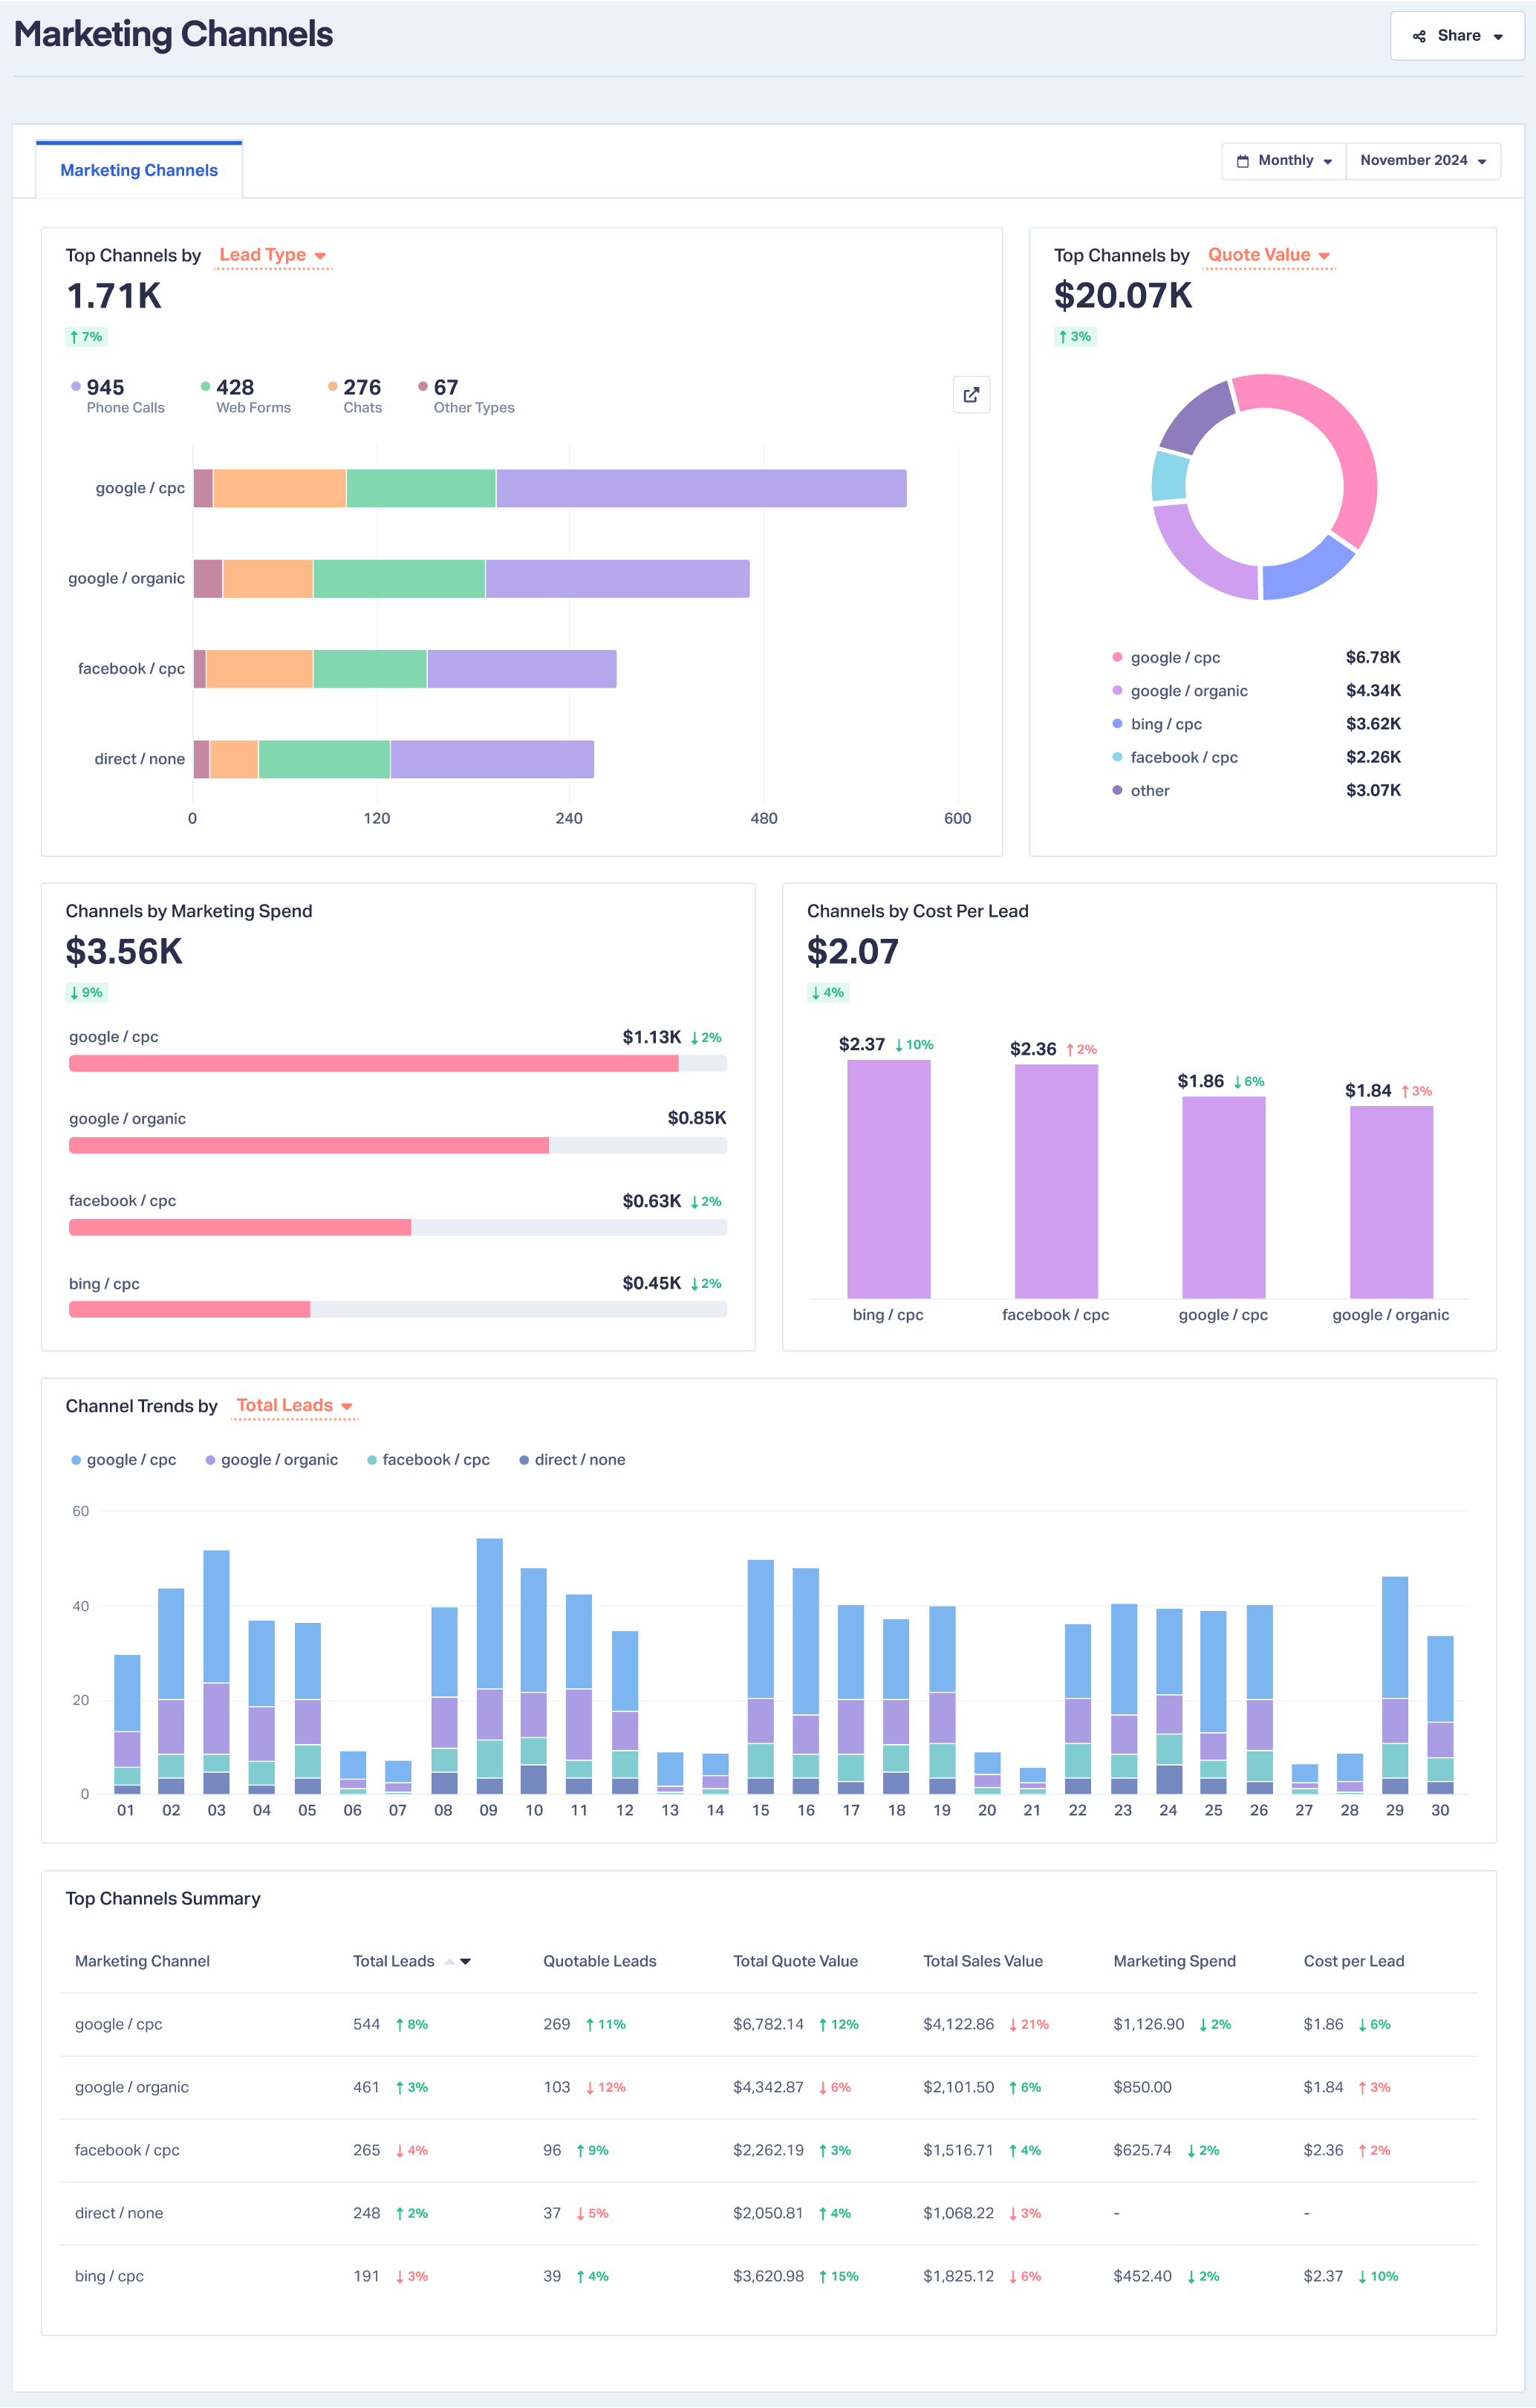
That data rolls up automatically into the Marketing Channels Report, where you can see CPL, quote value, and sales value side by side across every channel.
When all three metrics move together—CPL down, quote value steady or rising, sales value holding—the drop is real. When CPL drops while quote value and sales value decline proportionally, you're not looking at efficiency. You're looking at a quality problem.
Read More: See Which Channels Truly Drive Revenue with the Marketing Channels Report
What This Looks Like in Practice
Consider two channels running in the same month with the same ad spend:
| Channel | Spend | Leads | CPL | Avg. Quote Value | Sales Value |
| Paid Search | $5,000 | 50 | $100 | $3,200 | $28,000 |
| Display | $5,000 | 100 | $50 | $400 | $1,200 |
Display's CPL is half of Paid Search's. But Display generated a fraction of the quote value and a fraction of the closed revenue.
If you only looked at CPL, Display would look like the winner. The Marketing Channels Report shows the opposite—and it does so without any manual calculation or export.
That's what a false flag CPL drop looks like, and it's exactly what gets missed when CPL is your only signal.
Where This Shows Up in WhatConverts
Inside the Marketing Channels Report, every channel row shows:
- Spend—what you put in
- Leads—how many came out
- CPL—the cost per lead (automatically calculated)
- Quote Value—the total estimated value of leads generated
- Sales Value—the total confirmed revenue tied to those leads
The columns are designed to be read together, not in isolation. A CPL drop that isn't accompanied by stable or growing quote and sales value is a signal worth investigating—not celebrating.
You can filter by date range to track changes period over period, or segment by source, medium, campaign, or keyword to pinpoint exactly where a quality shift is happening.
No exports. No formulas. No spreadsheet detective work.
What This Unlocks
Once CPL is cross-referenced with downstream value, a few things become much clearer:
- Smarter scaling decisions. You're not scaling on cost alone—you're scaling on channels that demonstrate revenue potential. CPL tells you what you paid; quote and sales value tell you whether it was worth it.
- Earlier quality problem detection. A dip in average quote value from a channel is an early signal that lead quality is shifting—often before it shows up in your sales pipeline or your client's revenue report.
- Conversations backed by context. When a client asks why you're recommending a budget increase on a higher-CPL channel, you can show them exactly why: the leads it generates quote at 8x the value of the lower-CPL alternative.
The Bottom Line
CPL is a useful metric. But it's an incomplete one—and acting on it without downstream revenue data is how misallocated budgets happen.
A falling CPL is only good news if the leads behind it are worth pursuing. WhatConverts's Marketing Channels Report makes that check automatic, pairing cost data with quote value and sales value so you can spot the difference between efficiency and noise the moment it appears.
Don't just celebrate a CPL drop. Validate it first.
Start your free 14-day trial of WhatConverts today or book a demo with a product expert to see how we help prove and grow your ROI.
Get a FREE presentation of WhatConverts
One of our marketing experts will give you a full presentation of how WhatConverts can help you grow your business.
Schedule a Demo
Grow your business with WhatConverts


