


You know what you spent on Google Ads last month. You probably even know your cost per conversion.
But here’s the harder question: is your cost per qualified lead actually improving? Or has it been silently getting worse, without anyone noticing?
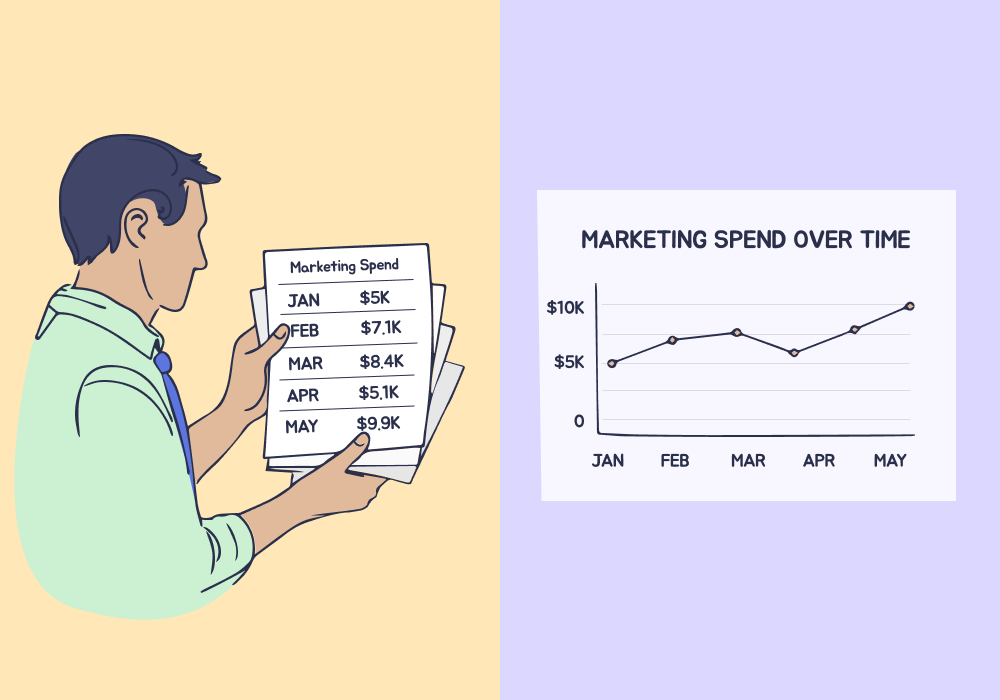
Most agencies aren’t sure. They optimize on a month-to-month basis and react to whatever numbers are in the most recent reports. Broader trend lines go unnoticed until thousands of dollars have already been wasted.
That’s the hidden risk of short-term reporting: you don’t feel decline when it’s gradual, unless you’re keeping an eye on the broader patterns.
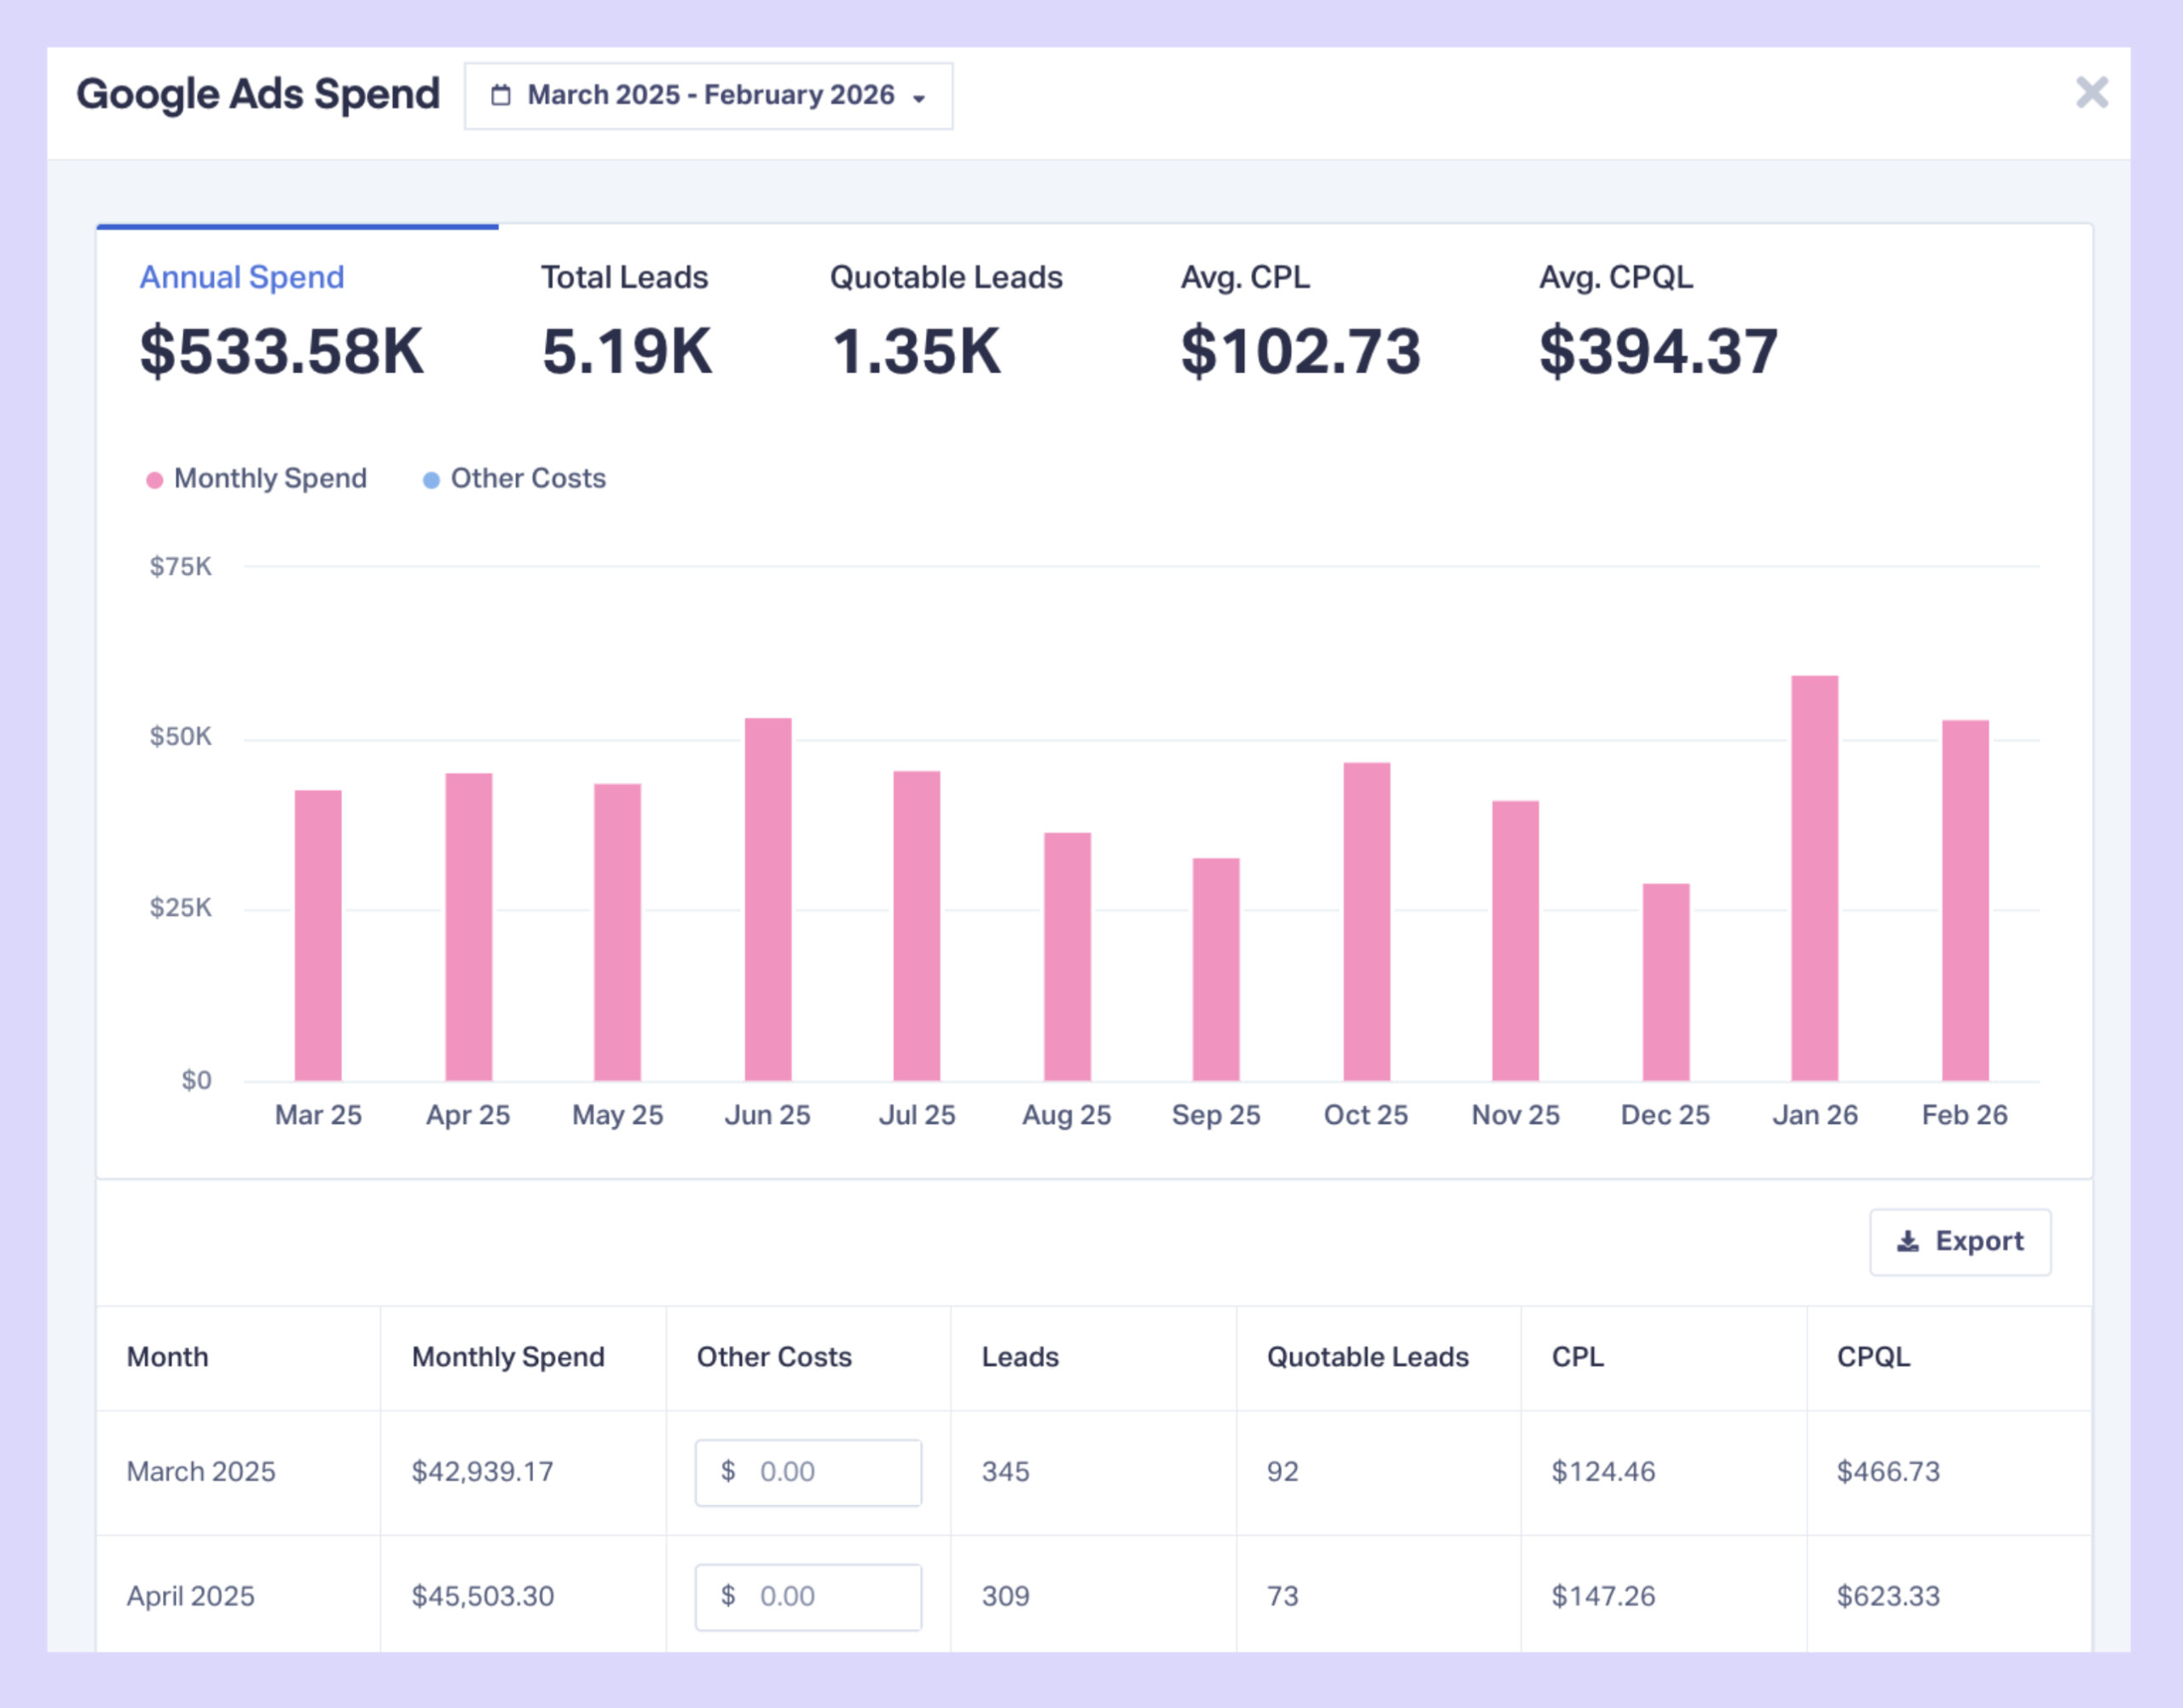
WhatConverts's updated Marketing Spend features eliminate the export-analyze-report cycle. The new 12-month Marketing Spend Report shows spend performance trends automatically—with cost per qualified lead calculated based on real leads, not platform conversions.
Note: Not a WhatConverts user yet? Start your free 14-day trial today or book a demo with a product expert to see how we help prove and grow your ROI.
The Problem: Platforms Show Conversions, Not Qualified Leads
Ad platforms report cost per conversion. But conversions and qualified leads aren't the same thing.
A conversion is any tracked event:
- A form submission (even if it's blank)
- A phone call (even if it lasts 5 seconds)
- A chat message (even if it's spam)
A qualified lead is an actual prospect worth pursuing.
When you optimize based on cost per conversion, you're making decisions on noisy data. And when you try to calculate cost per qualified lead manually, you run into a second problem: trend visibility.
You can calculate CPQL for one month, but can you see how it’s moved across the last twelve?
Without a reliable trend view of cost per qualified lead, this is what usually happens:
- You export spend from ad platforms
- You pull lead data from your tracking system
- You filter qualified leads
- You calculate CPQL
- You build charts
- You repeat the process next month
If something slips in Month 3, you might not notice it until Month 6. And by then, you’ve already funded the mistake.
Why Trend Visibility Changes Decisionmaking
Month-to-month reporting feels responsible, but it isn’t. Optimization decisions should be based on direction, not snapshots.
If CPQL moves from $82, to $87, to $64, to $98, to $104—nothing looks alarming in isolation, but the trend is clear.
Without a 12-month view, slow deterioration hides inside “normal fluctuations.” And agencies keep reallocating budget based on incomplete info.
Trend visibility changes the speed of the response. The faster you see a shift, the faster you investigate:
- Did competition increase?
- Did targeting drift?
- Did lead quality change?
- Did landing page performance drop?
Optimization isn’t about reacting to last month; it’s about spotting trend movement early on.
The Shift: Less Calculation, Clearer Vision
Instead of rebuilding CPQL in a spreadsheet every month, performance analysis should already be done for you. A proper 12-month marketing spend view should show:
- Total spend (including agency fees and other costs)
- Total leads generated
- Average cost per lead
- Average cost per qualified lead
- Month-by-month performance trends
Not as static numbers, but as a broader trend. Because each number alone doesn’t tell you much, but the direction tells you everything.
If CPQL jumps from $85 to $140 between April and July, you shouldn’t discover that in a quarterly review. You should see it immediately—and have a solution ready to go by the next time your client picks up the phone.
What This Looks Like in Practice
Let’s say you’re running Google Ads for a local HVAC company.
| Total Monthly Spend | Number of Qualified Calls | Cost per Qualified Lead | |
| January | $12,000 | 110 | $109 |
| June | $15,000 | 115 | $130 |
It happened gradually, but over the course of six months CPQL has increased by 19%. If you’re only reviewing month-to-month snapshots, that increase hides inside normal fluctuation.
Without a clear 12-month trend view, you might not catch the pattern until a quarterly or seasonal review. But with that view, you spot the drift and investigate:
- Did competitors increase bids before summer?
- Did search terms expand into lower-intent queries?
- Did landing pages get slower after site updates?
- Did qualification standards change?
You adjust targeting, tighten match types, refresh ad copy, improve page speed. By August, CPQL drops back to $112.
That’s the difference between reacting to rising costs and preventing them.
Read More: Marketing Spend Just Got More Actionable [WhatConverts Product Update]
Smarter Optimization Starts with Qualified Trends
Once you can see CPQL movement over time, decision-making changes.
You stop asking, “Which channel generated more leads?” and instead ask, “Which channel is becoming more efficient—and which one is slipping?”
Qualified lead trends eliminate guesswork, remove the illusion of performance created by raw conversion volume, and turn optimization into pattern recognition instead of monthly reaction.
The Bottom Line
Marketing spend is only useful when you can analyze it over time and connect it to qualified leads.
The updated Marketing Spend features in WhatConverts eliminate the manual work of tracking performance trends. You get automatic 12-month views of cost per qualified lead—the metric that actually matters for optimization—without exports, spreadsheets, or formulas.
When you can see performance trends instantly, you catch efficiency declines faster, validate optimization efforts with real data, and make budget decisions based on qualified lead costs instead of platform-reported conversions.
Ready to track cost per qualified lead performance over time without building spreadsheets?
Start your free 14-day trial of WhatConverts today or book a demo with a product expert to see how we help prove and grow your ROI.
Get a FREE presentation of WhatConverts
One of our marketing experts will give you a full presentation of how WhatConverts can help you grow your business.
Schedule a Demo
Grow your business with WhatConverts


