Marketers know the frustration: clicks and impressions don’t prove ROI, and reporting rarely tells you which channels actually drive revenue. Data is scattered, attribution is unclear, and lead quality often gets lost in the noise.
The new Marketing Channels Report from WhatConverts solves this by pulling every lead source into one view, connecting it to the metrics that matter — lead quality, quote value, sales value, and cost per lead. Instead of guessing which channel performs best, you’ll see exactly where revenue comes from and where spend is wasted.
In this article, we’ll walk through the Marketing Channels Report and show how it transforms messy channel data into clear, actionable insights for smarter marketing decisions.
Ready to clarify your reporting to show your most valuable channels? Book a time with a product expert to find out how WhatConverts can help.
Why This Matters for Agencies
For agencies, the challenge isn’t generating leads from their marketing channels. It’s proving they have value. Clients care about opportunities that turn into revenue, not clicks and impressions.
The Marketing Channels Report makes that conversation simple. In one dashboard, you can:
- Prove ROI by showing which channels deliver qualified, high-value leads.
- Protect budgets with hard data on which campaigns deserve investment and which should be cut.
- Guide strategy by uncovering hidden opportunities and wasted spend.
- Build trust with clients through transparent reporting they can actually understand.
For industries like HVAC, dentistry, and law, where a single lead can mean thousands in revenue, it’s the evidence agencies need to win renewals and grow accounts.
Inside the Marketing Channels Report
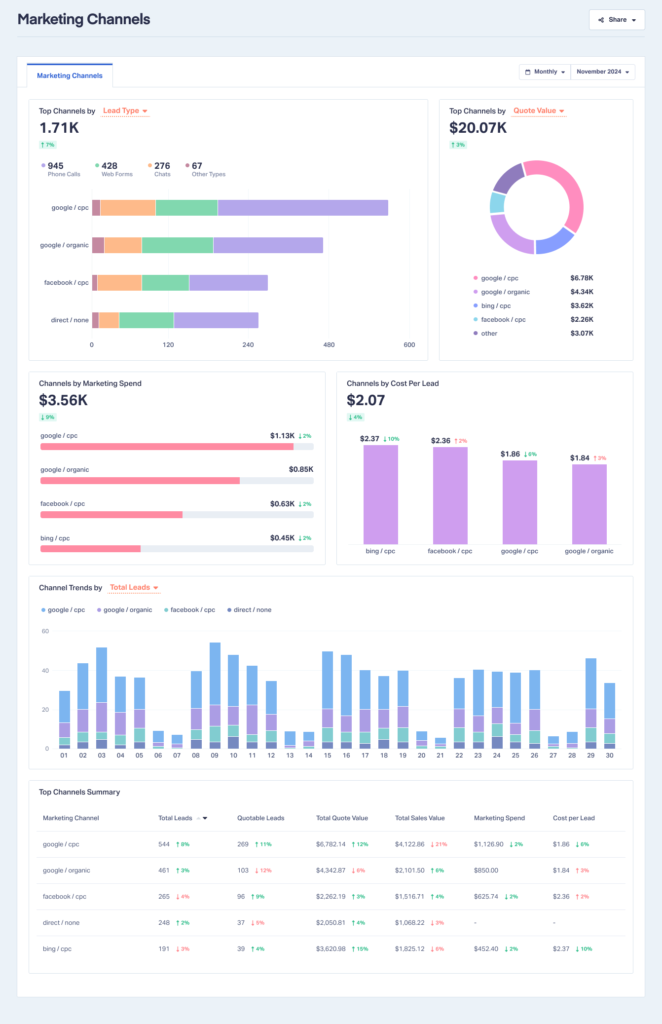
- Top Channels by Lead Type or Lead Status
- Top Channels by Quote Value or Sales Value
- Channels by Marketing Spend
- Channels by Cost per Lead
- Channel Trends
- Top Channels Summary
Together, they give agencies and clients a complete picture of which channels work and which waste money.
Let’s take a look at each section.
Note: Some sections may be greyed out if you aren’t tracking the necessary data. Just click the “Unlock” button when you hover over the section and follow the instructions to get started.
Top Channels by Lead Type or Lead Status
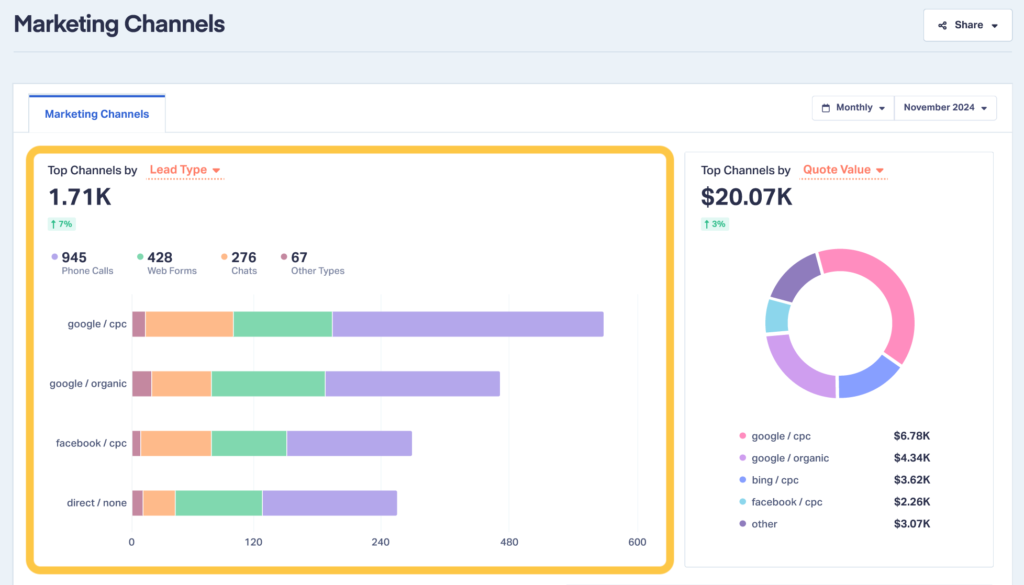
- Lead Type: See whether leads are coming in as calls, forms, or chats.
- Lead Status: Compare unique vs. repeat leads to understand whether channels are producing new opportunities or the same contacts multiple times.
Insight Example:
Using the Lead Type ↔ Lead Status toggle, an HVAC company switched to Lead Type and saw Google Ads driving most phone calls (urgent service requests), while Facebook generated more chat leads. Flipping to Lead Status revealed that 80% of Google Ads calls were unique leads, while many Facebook chats came from repeat inquiries.
Action Step:
The HVAC company increased spend on Google Ads campaigns focused on emergency service calls and scaled back social ads, ensuring budget went toward unique, high-intent leads rather than repeat low-intent chats.
Customer Story: The Quantity → Quality Shift - Agency Boosts Quality Calls by 30%
Top Channels by Quote Value or Sales Value
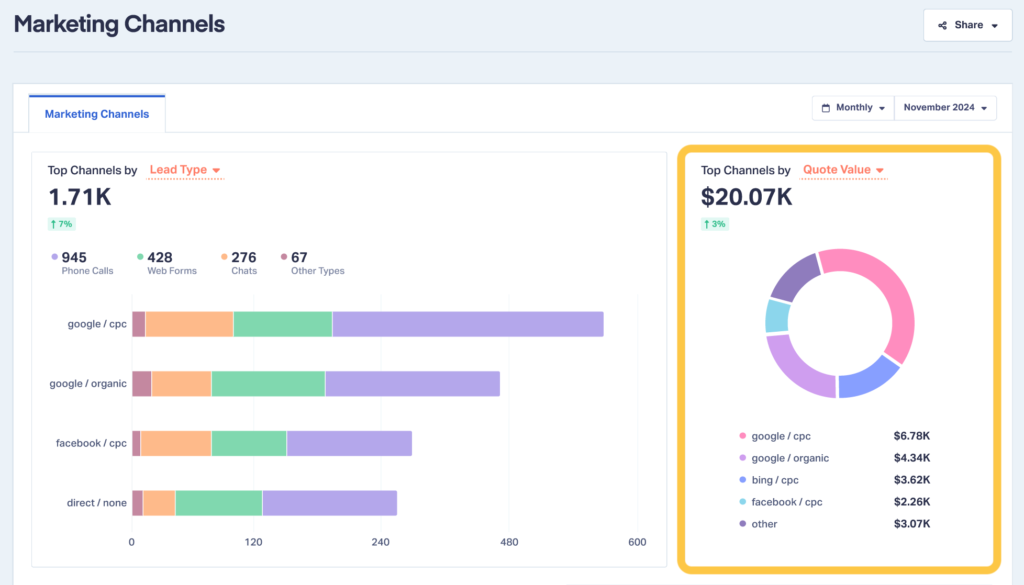
- Quote Value: The total revenue potential represented in submitted quotes.
- Sales Value: Actual closed revenue, showing which channels produce paying customers.
Insight Example:
Clicking the Quote Value ↔ Sales Value switch, a roofing company discovered Bing Ads generated fewer leads than Google, but switching to Quote Value showed those leads averaged $12,000 per quote. Switching to Sales Value confirmed many of those large jobs actually closed.
Action Step:
The roofing company shifted more budget into Bing Ads, prioritizing fewer but higher-value leads over larger volumes of lower-value Google leads.
Channels by Marketing Spend
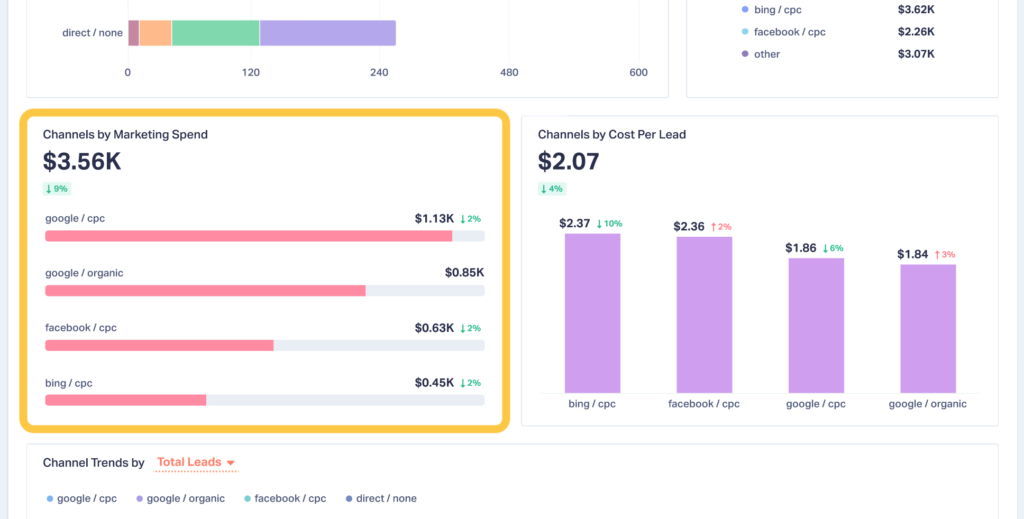
Insight Example:
Looking at spend trends, a plumbing company noticed that social ads jumped from 25% to 40% of their total budget this month. But when comparing against Quote Value, those same ads contributed less than 10% of revenue.
Action Step:
The plumbing company reduced spend on social campaigns and redirected budget into paid search, which consistently delivered higher-value service requests.
Channels by Cost per Lead
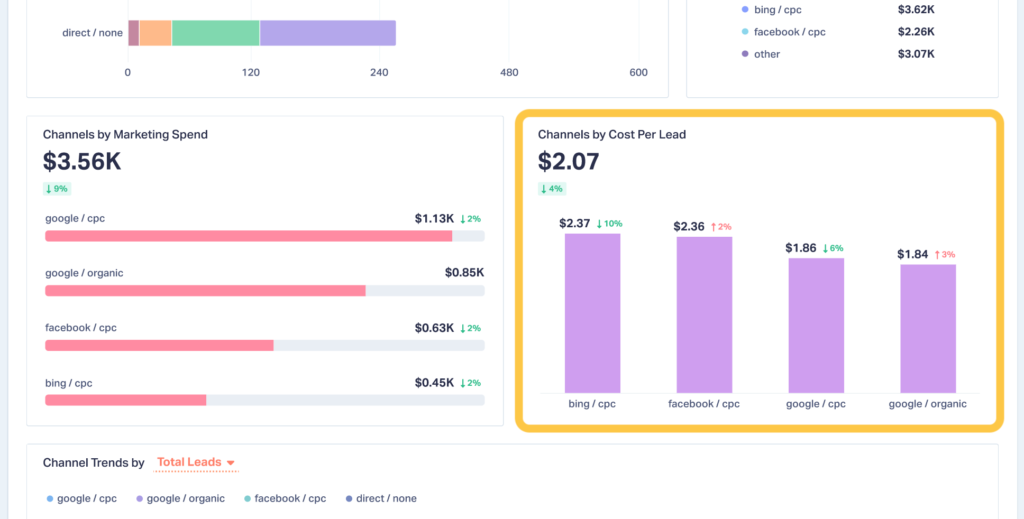
Insight Example:
In this chart, a law firm saw Google Ads CPL rise from $160 to $180 month over month, while Facebook CPL dropped from $100 to $90. Filtering for qualified leads only showed that most Google Ads leads were strong cases, while Facebook’s cheaper leads rarely converted.
Action Step:
The law firm kept budget steady on Google Ads despite the higher CPL, ensuring they continued getting qualified cases, and trimmed spend on Facebook to cut out low-value inquiries.
Channel Trends
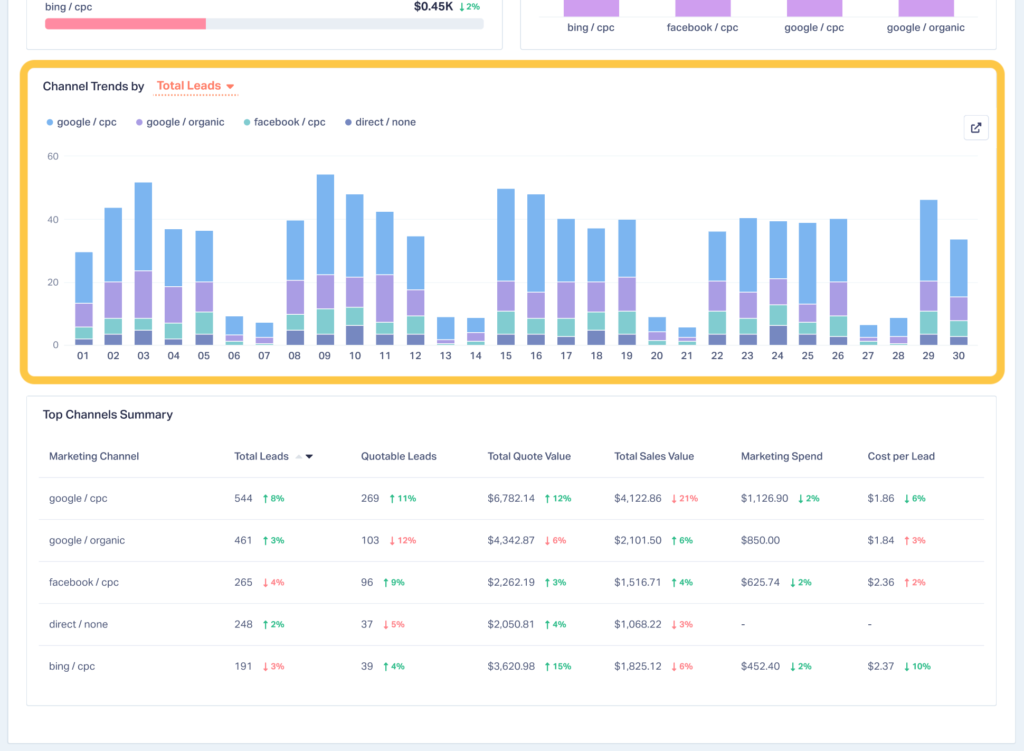
- Total Leads
- Quotable Leads
- Quote Value
- Sales Value
- Marketing Spend
- Cost per Lead (CPL)
Insight Example:
Using the Channel Trends dropdown, a dental practice selected CPL and tracked performance over the last three months. The trend showed CPL steadily decreasing after ad optimizations, proving their changes were working.
Action Step:
The dental practice increased budget on the optimized campaigns, scaling success while maintaining efficiency.
Top Channels Summary
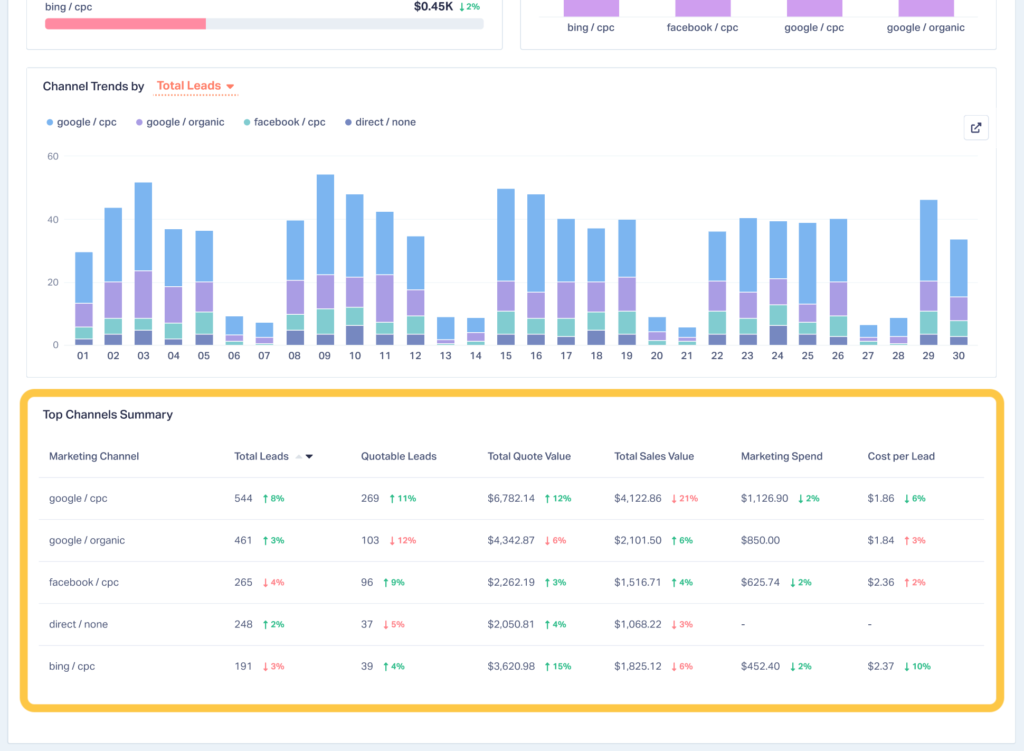
Insight Example:
In the Top Channels Summary table, a plumbing company compared Quote Value month over month. Google Ads leads held steady in volume but rose from $20k in quotes last month to $30k this month. Meanwhile, Facebook stayed flat in both leads and value.
Action Step:
The plumbing company used the summary in client reporting to justify growing the Google Ads budget and cutting underperforming Facebook spend.
Turn Channel Data Into Growth
Note: For more on the report, please see the Help Center documentation.
Managing multiple marketing channels is messy — and without clear attribution, it’s nearly impossible to know which ones actually drive revenue. The Marketing Channels Report changes that by connecting every lead source to the metrics that matter most: lead quality, quote value, sales value, spend, and cost per lead.
For agencies and in-house teams alike, this means no more guesswork, no more inflated lead counts, and no more struggling to prove ROI. Instead, you’ll have the clarity to cut wasted spend, double down on high-value channels, and confidently show clients or stakeholders the real impact of your work.
Want to see which channels turn leads into revenue for your business? Book a demo with one of our product experts today!
Get a FREE presentation of WhatConverts
One of our marketing experts will give you a full presentation of how WhatConverts can help you grow your business.
Schedule a Demo
Grow your business with WhatConverts


