


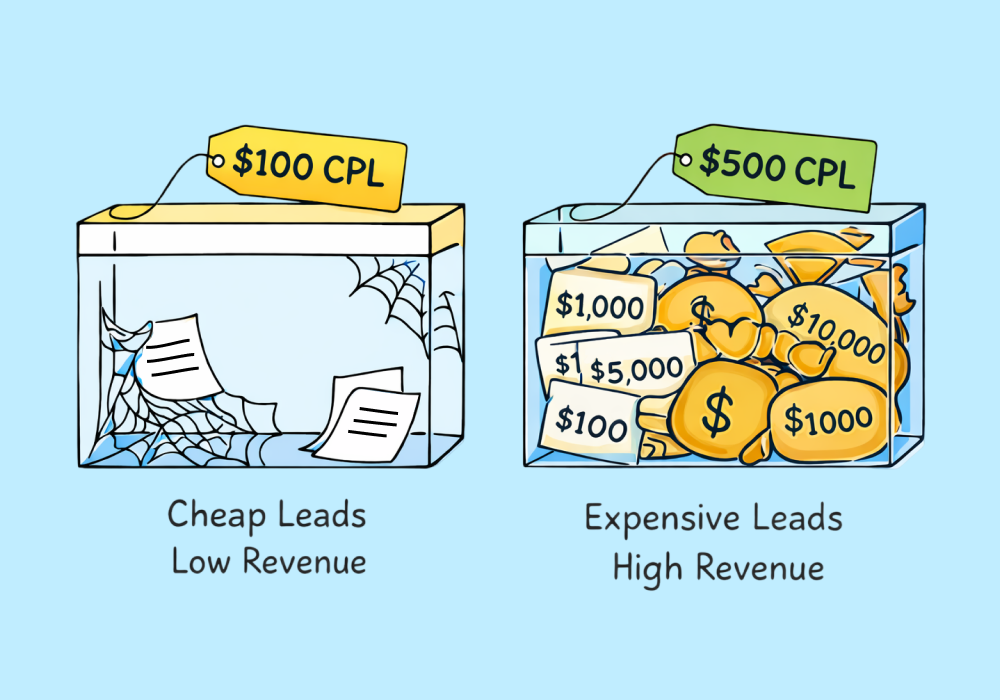
Kitchen remodelers often pay $500 or more per lead in Google Ads. Plumbers often pay $75 or less.
At first glance, the plumber seems to be winning. Lower CPL, more leads, better efficiency.
But that comparison hides a problem that many agencies quietly run into when managing campaigns across different home service industries: the cheaper lead is often the less profitable one.
Because cost per lead only tells you part of the story. Without understanding the value of the jobs those leads turn into, CPL can easily push optimization in the wrong direction.
Judging campaigns by CPL alone—without anchoring it to job value—means optimizing for the wrong number. This article breaks down why the math works against you, and how to build the comparison that actually reflects what your marketing is worth.
Note: Not a WhatConverts user yet? Start your free 14-day trial today or book a demo with a product expert to see how we help prove and grow your ROI.
CPL Without Job Value Is Just a Number
Imagine two campaigns:
| CPL | Leads | |
| Campaign A | $500 | 10 |
| Campaign B | $75 | 40 |
Campaign B looks amazing—if you only look at CPL. If you track all the way through to see the lead outcomes, you get a drastically different picture:
| CPL | Leads | Total Ad Spend | Jobs Booked | Average Job Value | Total Revenue | ROI | |
| Campaign A | $500 | 10 | $5,000 | 5 | $5,000 | $25,000 | 5x |
| Campaign B | $75 | 40 | $3,000 | 6 | $500 | $3,000 | 1x |
Campaign A’s CPL is nearly seven times more expensive than Campaign B, making it look inefficient and costly. But when you track the revenue brought in by each campaign, you learn that Campaign A also made over 8x more money.
In fact, Campaign B didn’t make any money at all—it just broke even.
This is the paradox many agencies run into when they start comparing lead costs across different service types. High-value services almost always have higher CPLs. But those leads can be dramatically more profitable.
The Real Problem: Most Agencies Don’t See Job Value
The math behind CPL and revenue is simple. The hard part is that most marketing reports don’t include job value at all.
Platforms like Google Ads can tell you:
- How many leads came in
- What they cost
- Which campaign generated them
But they can’t tell you what those leads were actually worth.
Once a lead turns into a phone call or a form submission, the trail typically ends inside the ad platform. What happens next—quotes, booked jobs, and revenue—usually lives somewhere else.
That gap makes it difficult for agencies to answer the most important optimization question: Which campaigns generate the most valuable customers?
Without that information, campaigns often get optimized toward cheaper leads instead of more profitable ones.
What Revenue-Based Lead Tracking Looks Like
To evaluate CPL properly, agencies need to connect three pieces of information:
- Where the lead came from (campaign, keyword, ad, landing page)
- What happened after the lead arrived (qualified, quoted, booked)
- The value of the job or sale
When those pieces are connected, CPL stops being the primary metric.
Instead, agencies can see things like:
- Revenue per lead
- Revenue per campaign
- Return on ad spend
- Which keywords generate the highest-value customers
This changes optimization decisions completely.
A campaign producing fewer leads but larger jobs suddenly becomes far more valuable than a campaign producing lots of small ones.
Get more home services insights: Home Services' Invisible Crisis: GBP Holds 60% of Leads Hostage
How WhatConverts Closes the Loop
This is exactly the visibility WhatConverts is designed to provide.
Instead of stopping at lead volume, WhatConverts captures and organizes every lead—calls, forms, and chats—along with the marketing attribution that generated them.
From there, agencies can:
- Review call recordings and transcripts
- Qualify leads
- Assign job or sale value
- Sync updates from CRM systems
Once that information is captured, the platform can report not just how many leads a campaign generated, but how much revenue those leads produced.
That makes it possible to see which campaigns are driving the most valuable customers, not just the cheapest leads.
When that value data is sent back to advertising platforms like Google Ads, campaigns can start optimizing around actual revenue outcomes instead of simple lead volume. And when it comes time to write your performance report, you can shift from basic CPL to metrics like revenue per lead, revenue per campaign, and true return on ad spend.
Benchmarks Are Context, Not Targets
Industry CPL benchmarks can be helpful; they give marketers a sense of what competitive markets look like. But they shouldn’t be the primary target you optimize toward.
The real goal isn’t to generate the cheapest leads. It’s to generate the most valuable customers.
And once agencies can see which campaigns produce real revenue, the paradox becomes clear: Sometimes the most expensive leads are actually the cheapest ones you can buy.
Ready to connect your lead costs to actual job value?
Start your free 14-day trial of WhatConverts today or book a demo with a product expert to see how we help prove and grow your ROI.
Get a FREE presentation of WhatConverts
One of our marketing experts will give you a full presentation of how WhatConverts can help you grow your business.
Schedule a Demo
Grow your business with WhatConverts


