


Campaign performance metrics tell you which ads are working. Landing page analytics tell you which pages convert.
What they don't tell you is when those two realities are completely misaligned.
The campaign generating 50 leads looks like a winner compared to the one generating 25. Budget flows accordingly. But that 50-lead campaign might only perform well because most of its ads route to a high-converting landing page, while the 25-lead campaign sends traffic to a page that barely converts.
Filter by Landing Page breaks that abstraction. When lead volume, qualification rate, and quote value are segmented by landing page, it becomes clear which pages are actually doing the work—and which ones are just along for the ride.
Note: Not a WhatConverts user yet? Start your free 14-day trial today or book a demo with a product expert to see how we help prove and grow your ROI.
The Problem: Campaign Performance Hides Page Performance
Budget decisions happen at the campaign level. But conversions happen at the landing page level.
Those two realities don't always align.
Here's what that disconnect looks like in practice.
| Total Leads | Total Spend | Cost per Lead | |
| Campaign A | 50 | $2000 | $40 |
| Campaign B | 25 | $1250 | $50 |
| Campaign C | 40 | $4000 | $100 |
Campaign A delivers the most leads at the lowest cost. Looks like a clear winner.
Based on this table alone, most marketers would confidently approve a budget increase for Campaign A, hold steady on B, and consider cutting C entirely.
What you don’t see is that the landing pages these campaigns point to have much more influence over outcomes than you realize.
When you’re able to use WhatConverts to filter your campaign data by landing page, here’s what you see:
| Total Leads | |
| Landing Page 1 (Homepage) | 15 |
| Landing Page 2 (Services Page) | 100 |
Nearly 90% of all of your leads across campaigns converted via your services page. In other words, your campaigns weren’t the conversion lever at all. The page was.
When you dig into your campaign data, you see that most of the ads in Campaign B and Campaign C direct to your homepage.
You were prepared to cut budget to Campaign B and Campaign C, assuming the lower performance had to do with keyword or audience targeting and ad quality. In reality, these campaigns are just stuck with a low-performing landing page.
If you redirect their ads to your services page, you remove the dead weight—and the campaign results change immediately. You may find that Campaigns B and C blow Campaign A out of the water entirely.
Why This Stays Hidden Without Page-Level Filtering
Most marketers can't see this problem because their data lives in separate systems.
Google Ads shows campaign performance. Your website analytics shows landing page traffic. Your call tracking tool shows phone leads. Your CRM shows which ones closed.
None of them show you where budget decisions are being distorted by page performance.
You might notice that the Services Page converts well in your analytics. But you can't easily see which campaigns are sending traffic there, how much budget each page is actually receiving, or whether your top-performing campaigns are systematically avoiding your best landing pages.
That's the visibility that WhatConverts provides.
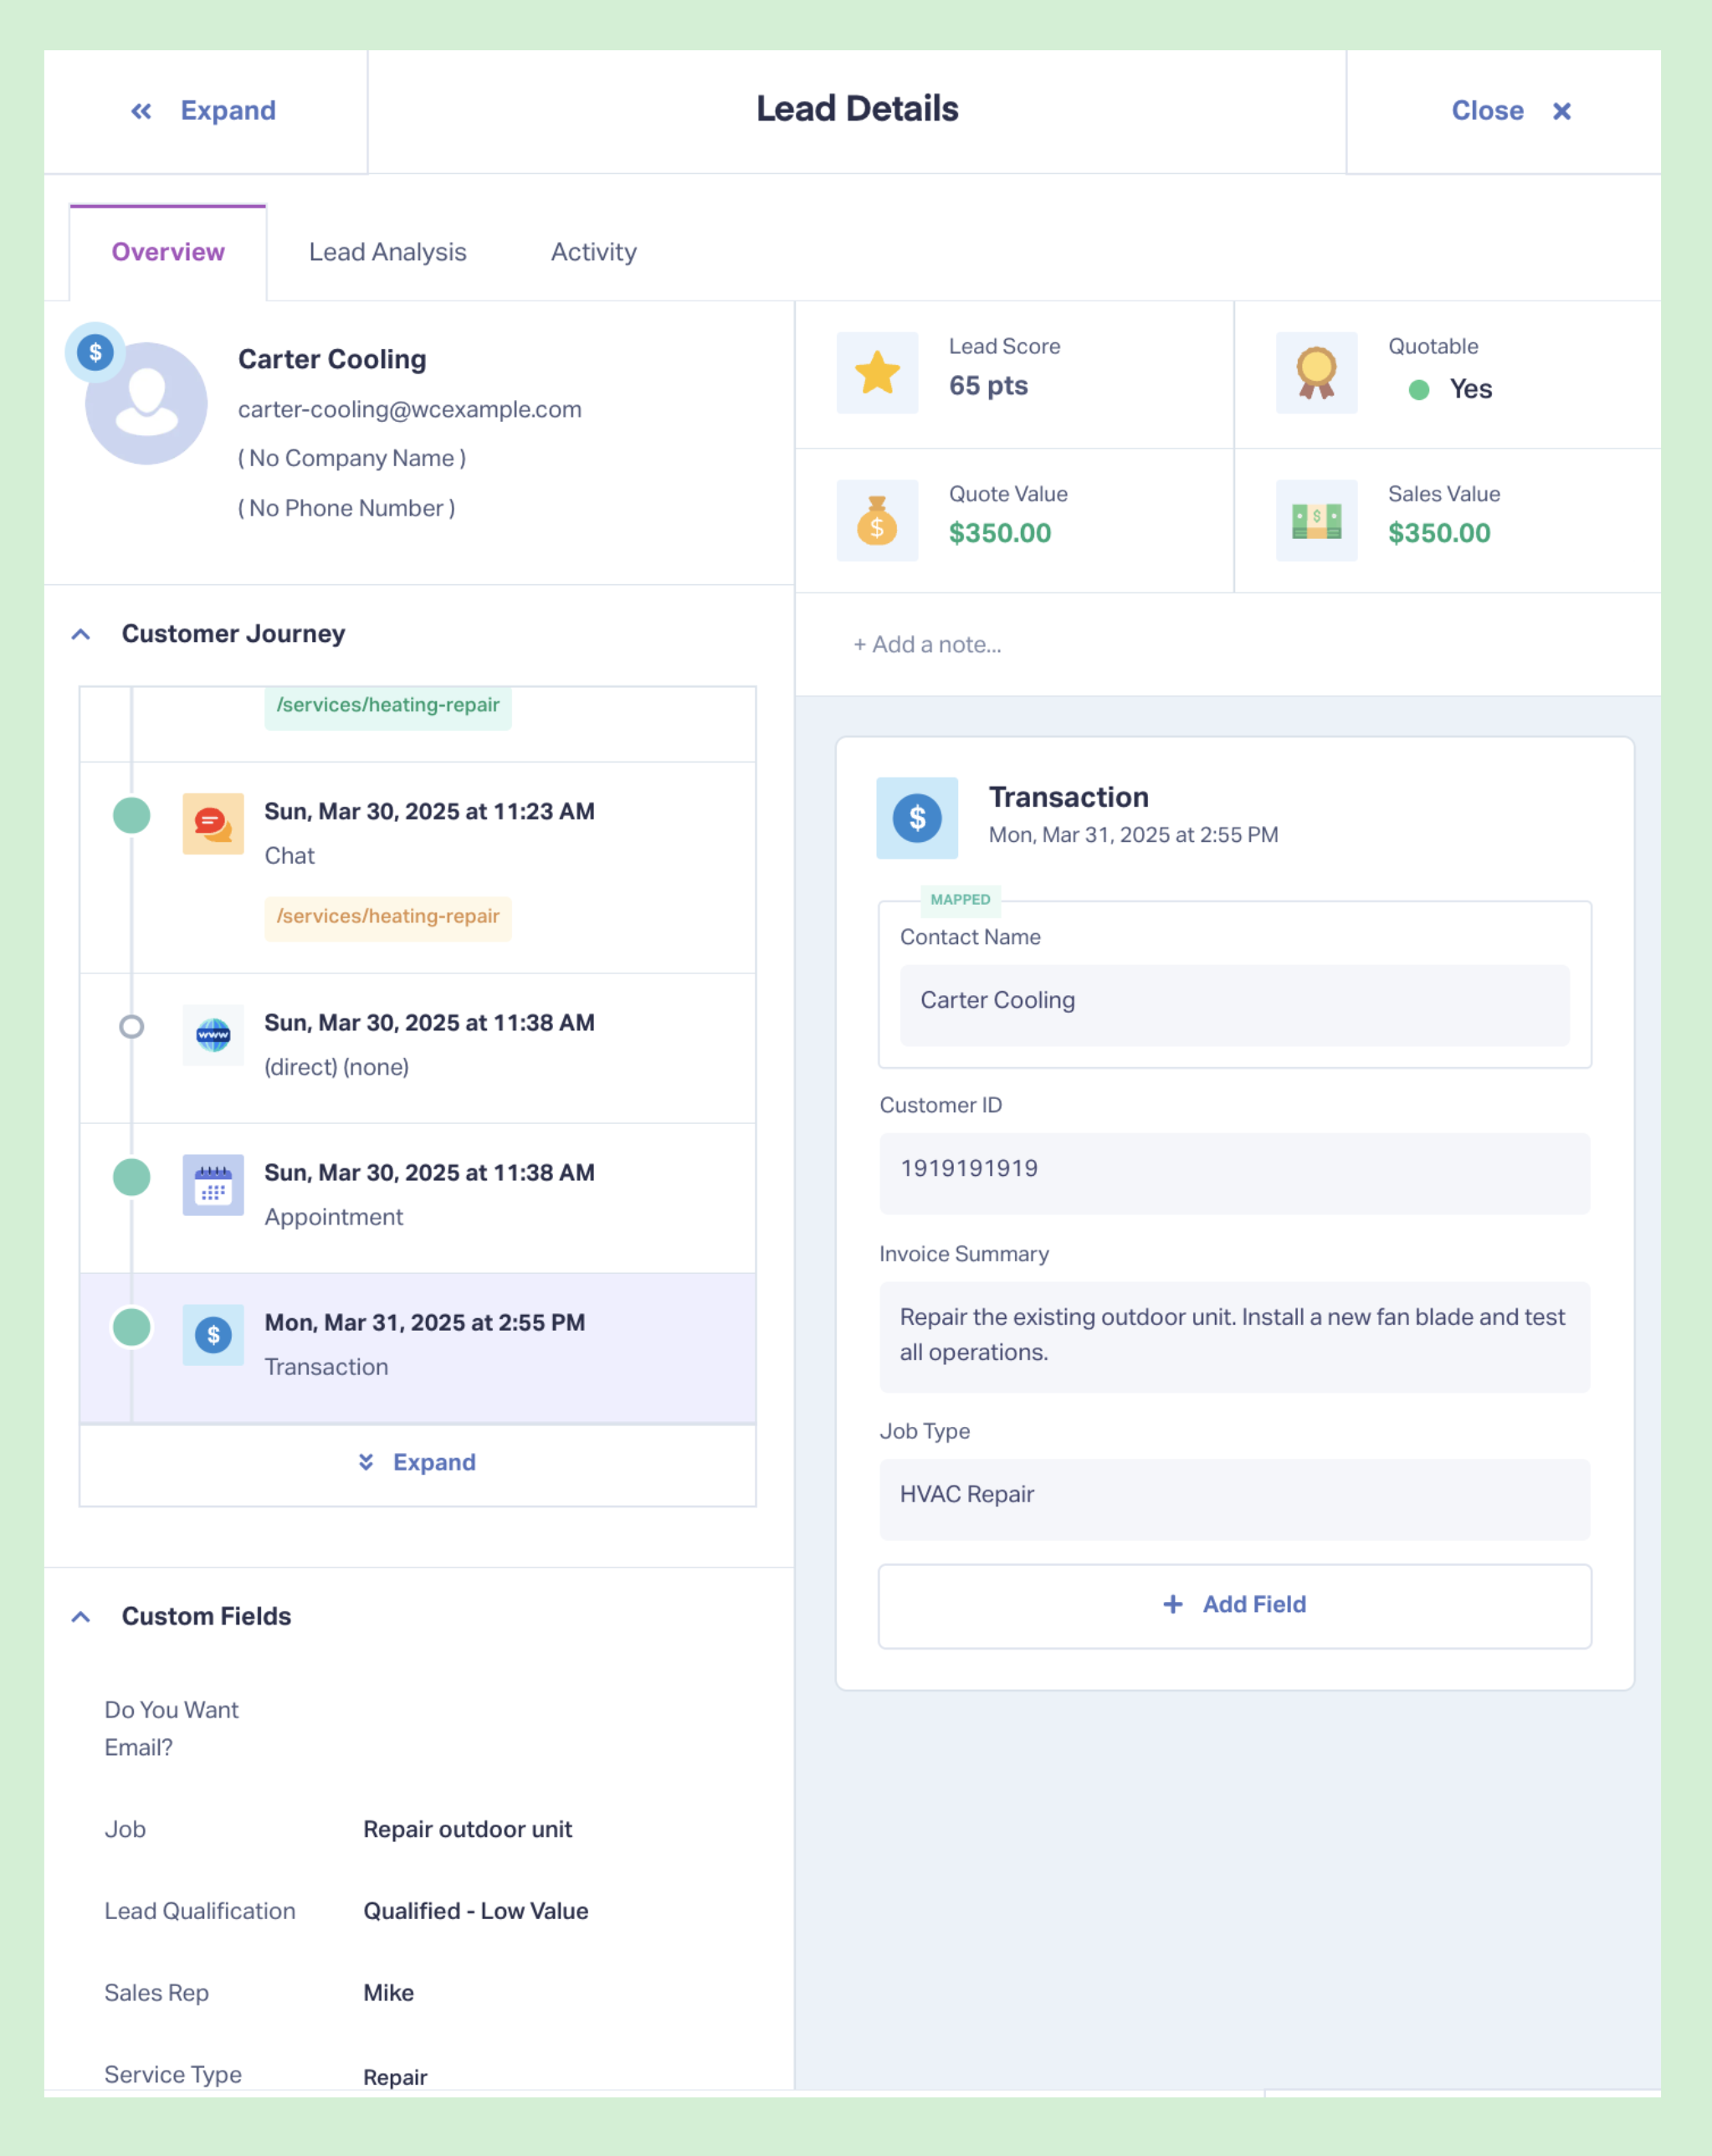
Going Deeper: Revenue Per Landing Page
With WhatConverts, you also have the ability to add quote values to each of your leads in the same database where your campaign, landing page, and qualification data lives. This lets you parse your data to optimize your landing pages for even more powerful impact.
Let’s say an HVAC company has two service landing pages—one for ventilation and one for air conditioning. They want to make sure their ad budget is pointed toward the better, higher-performing page.
When they filter leads by landing page, here’s what they see:
| Total Leads | |
| Landing Page 1 (A/C) | 80 |
| Landing Page 2 (Ventilation) | 45 |
Based on volume alone, the A/C page looks like the winner. More traffic goes there, more budget gets allocated.
Then they run a Quote Value by Landing Page report in WhatConverts.
The A/C page generates 80 leads, but most are service calls for refrigerant leaks and minor repairs. Average quote value is $350.
The ventilation page generates 45 leads, but they're system replacements and major repairs. Average quote value: $6,500.
This changes the picture completely:
| Total Leads | Total Revenue | |
| Landing Page 1 (A/C) | 80 | $28,000 |
| Landing Page 2 (Ventilation) | 45 | $292,500 |
The page with fewer leads is generating 10x more revenue. But when they look at their campaigns, they see they’re driving traffic to both pages equally.
If they prioritize routing traffic to that ventilation page, they’ll likely see revenue skyrocket.
From Campaign-Centric to Page-Centric Optimization
Campaigns deliver traffic. Landing pages convert it into revenue. Once you see performance at the page level, “campaign optimization” becomes secondary to routing demand toward the pages that actually produce revenue.
When you can filter lead data by landing page, budget decisions become clear:
- See which pages convert across all campaigns—volume, qualification rate, and revenue potential by destination URL
- Identify campaigns routing traffic to underperforming pages—the mismatch between campaign performance and page performance
- Assign quote or sales value to leads—understand which pages drive revenue, not just lead count
- Redirect ad spend toward high-value destinations—route more traffic to pages that generate qualified, high-revenue leads
- Stop rewarding campaigns for accidents—a campaign isn't "good" because it happens to send traffic to the right page
This is how you stop funding campaigns and start funding the marketing efforts that actually make you money.
Start your free 14-day trial of WhatConverts today or book a demo with a product expert to see how we help prove and grow your ROI.
Get a FREE presentation of WhatConverts
One of our marketing experts will give you a full presentation of how WhatConverts can help you grow your business.
Schedule a Demo
Grow your business with WhatConverts


