


Most campaigns are built to optimize around performance. The problem is: they optimize for averages.
Average CPL. Average conversion rate. Average lead volume. But averages flatten everything—including the seasonal patterns that could tell you exactly when to push harder and when a campaign is silently underperforming its own potential.
The real issue isn't that your campaigns have bad months. It's that you can't see which months are yours to win—and which ones you're leaving on the table.
This article shows how to use date-range reporting tied to lead quality (not just conversion count) to surface the seasonal patterns hiding in your data—and what to do once you find them.
Note: Not a WhatConverts user yet? Start your free 14-day trial today or book a demo with a product expert to see how we help prove and grow your ROI.
The Seasonality Problem Nobody Talks About
Everyone knows the obvious stuff. HVAC gets busy in June. Retail spikes in November. Tax services light up in January.
But those are industry-wide patterns. Your client's patterns are different.
An HVAC company in Phoenix has different peak weeks than one in Minneapolis. A personal injury firm in a state with frequent winter weather events sees claim cycles other markets don't. A landscaper in the mid-Atlantic might have a three-week window in early spring when 40% of their annual revenue is up for grabs.
And none of that shows up in aggregate reporting.
When you're looking at year-over-year conversion totals, you're seeing the average. The peak is buried inside it. Optimization built on averages doesn't win the peak—it just doesn't lose it as badly.
Why Lead Count Alone Won't Show You the Pattern
Conversion volume can look steady while lead quality swings wildly.
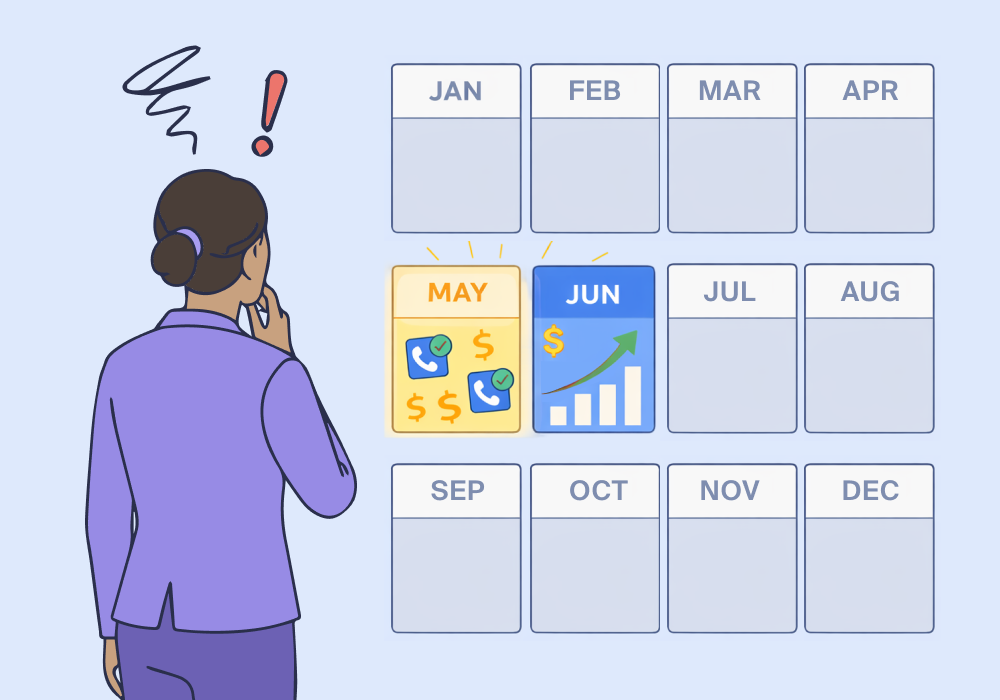
An HVAC client generates 80 leads in May and 80 leads in October. Same volume. Different story:
| Month | Leads | Qualified | Avg Quote Value | Estimated Revenue |
| May | 80 | 64 | $3,200 | $204,800 |
| October | 80 | 31 | $890 | $27,590 |
May is pre-summer. Customers are panicking about AC. They're ready to buy, quotes are high-ticket, and close rates follow.
October is post-season maintenance: lower intent, smaller jobs.
If your campaigns treat May and October the same—same budget, same bids, same ad copy—you're underinvesting in your client's most valuable window while spending just as much on a month that barely converts to revenue.
And if you're only tracking conversions, you'll never see it. Both months look identical.
What You Need to See the Pattern
Surfacing seasonal lead quality patterns requires two things working together:
1. Lead-Level Data Tied to Date
Not aggregate conversion counts—individual leads with qualification status, quote value, and revenue outcome, timestamped and attributable to source and campaign.
2. Date-Range Reporting by Lead Quality, Not Just Volume
The ability to filter any date range and see: How many leads were qualified? What was their average value? Which campaigns drove the high-value ones?
This is where most reporting tools fall short. They show you when conversions happened. They don't show you what those conversions were worth—and whether June's spike was genuinely valuable or just high-volume noise.
How WhatConverts Surfaces Seasonal Patterns
WhatConverts captures every lead—calls, forms, chats—with full attribution, qualification status, and revenue value. Every lead is timestamped.
That means you can filter any date range in the Report Builder and instantly see:
- Which campaigns drove qualified leads in your client's peak window
- How average quote value and revenue changed month-over-month
- Which sources held up during peak periods and which collapsed
Learn More: Did You Know – Timeline View Reporting
Run January against March for a tax services client. Run May against September for an HVAC account. The pattern reveals itself—not in conversion totals, but in the qualified-lead volume and value data underneath them.
Once you know which months your client wins, you can:
- Increase bids and budgets ahead of peak windows, not during them
- Identify which campaigns consistently drive high-value leads in peak periods
- Pull back spend on months where volume looks fine but value is low
- Show clients exactly which months drive the majority of their revenue—and prove why those months deserve more budget
That last one is a retention conversation. Clients who see that May generates 60% of their annual revenue potential aren't cutting marketing spend in April.
The Bigger Picture
Seasonal blind spots aren't just an optimization problem. They're a trust problem.
When a client's best month produces average results because campaigns weren't scaled to meet demand, they notice. They just don't know why. They'll attribute it to "bad luck" or "weaker campaigns" when the real answer is: nobody knew the window was open.
With date-range reporting tied to lead quality, that window is visible—before it closes.
Ready to see which months your clients are actually winning?
Start your free 14-day trial of WhatConverts today or book a demo with a product expert to see how we help prove and grow your ROI.
Get a FREE presentation of WhatConverts
One of our marketing experts will give you a full presentation of how WhatConverts can help you grow your business.
Schedule a Demo
Grow your business with WhatConverts


