


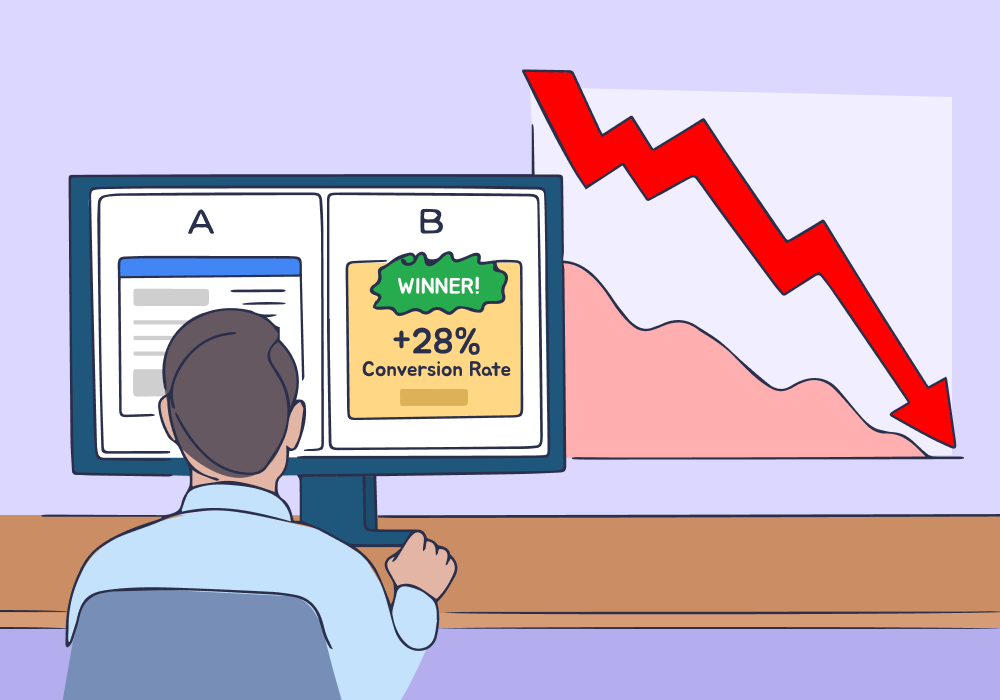
Conversion rate optimization is supposed to make things better. But what if your "winning" variation is quietly killing revenue?
Here's the trap: Your new landing page design lifted conversion rate from 3.2% to 4.1%. That's a 28% increase in lead volume. Clear winner. You rolled it out.
Six months later, you discover the old page generated leads worth $8,500 on average. The new page? Leads worth $3,200.
The new design attracted a higher volume of lower-intent prospects. You optimized for conversions while systematically degrading lead quality, and nobody noticed until the revenue shortfall became impossible to ignore.
This article reveals why your A/B testing tool is lying to you—and how to connect test results to actual lead value so your winning variations drive revenue, not just volume.
Note: Not a WhatConverts user yet? Start your free 14-day trial today or book a demo with a product expert to see how we help prove and grow your ROI.
When More Conversions = Less Business
Most A/B testing tools declare winners based on conversion volume. Fill out the form, click the button, submit the inquiry—that's a conversion.
But they don't track what happens after the conversion. They can't tell you:
- Which leads closed
- Which ones were qualified prospects versus tire-kickers
- What each lead was actually worth
So when your test shows Variation B converting 28% more traffic, you celebrate the win and deploy it site-wide. The data says it's better.
Except it's not.
What actually happened:
Your original landing page had friction. Longer form, more qualifying questions, detailed service descriptions. It converted 3.2% of visitors, but those visitors were serious buyers who understood what they were getting and came prepared with real budgets.
Your new variation removed friction. Shorter form, simpler copy, lower barrier to entry. It converted 4.1% of visitors—but many were casual browsers, comparison shoppers, and prospects with no immediate buying intent.
You generated more leads. But you also generated worse leads. And because your testing platform only measured conversions, not lead value, you had no way of knowing.
The $480K Question Nobody's Asking
Let's see the math.
Over six months, your site gets 50,000 visitors. Here's what the old page delivered versus the new "winning" variation:
| Metric | Original Page | "Winning" Variation |
| Conversion rate | 3.2% | 4.1% |
| Total leads | 1,600 | 2,050 |
| Avg lead value | $8,500 | $3,200 |
| Total revenue potential | $13,600,000 | $6,560,000 |
Your new page generated 450 more leads. But those leads were worth $7,040,000 less in aggregate.
That's $1.17M per month in lost revenue potential. Over six months: $7.04M.
CRO without lead value tracking doesn't optimize for business outcomes. It optimizes for the wrong metric and calls it a win.
Read More: The Best Conversion Rate Optimization Tools for 2026: A Complete Guide
Why This Happens (And Why It Keeps Happening)
The problem isn't the test. It's the feedback loop.
Most conversion optimization workflows look like this:
- Design variation
- Split traffic
- Measure conversion rate
- Deploy the winner
- Move to the next test
Lead quality never enters the equation because CRO tools don't have access to post-conversion outcomes. They capture the click. They don't capture the close.
So you optimize based on incomplete data. And incomplete data produces decisions that look smart on dashboards but destroy performance in reality.
The Fix: Close the Loop Between Conversions and Revenue
CRO works when you track what happens after the conversion, not just whether it happened.
That requires connecting three data points most teams keep separate:
- Which marketing source drove the lead (campaign, keyword, landing page variation)
- What the lead actually wanted (service requested, budget mentioned, qualification status)
- What revenue that lead generated (quote value, closed deal amount, lifetime value)
Once those three connect, you stop optimizing for conversions and start optimizing for revenue.
WhatConverts makes this automatic:
- Track every lead back to its source. Calls, forms, and chats tie to campaign, keyword, and landing page—including A/B test variations. You see exactly which version drove each lead.
- Capture lead context. Call recordings, transcripts, and form submissions reveal what prospects actually said. Were they asking about pricing, or just gathering information? Did they mention a budget, or were they comparison shopping?
- Assign value to every lead. Quote value, sales outcome, and deal size connect to the marketing source. Now you know which variation generates $8,500 leads versus $3,200 leads.
- Feed that data back into optimization. Instead of testing for more conversions, test for more valuable conversions. Let revenue be the metric that determines the winner.
When lead value becomes part of your testing workflow, CRO stops chasing volume and starts driving profit.
Scenario: When the "Losing" Variation Actually Won
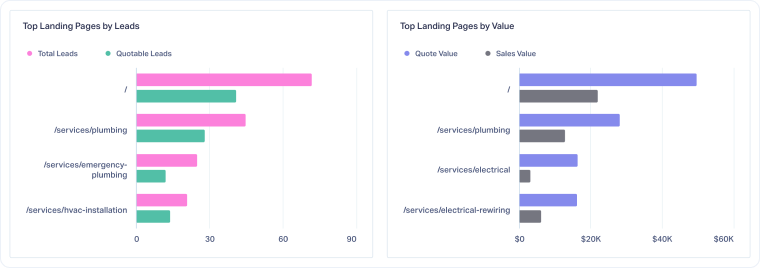
An HVAC company runs a landing page test. Variation A has a short form and simple copy. Variation B requires service selection, urgency indicator, and property details.
Variation A wins—12% higher conversion rate. They deploy it.
Two months later, call recordings reveal a pattern: Variation A leads asked vague questions, requested quotes for services the company didn't offer, and rarely booked. Variation B leads came prepared with specific needs and realistic timelines.
Using WhatConverts to track lead value by source, they discover Variation B generated leads worth 2.8x more than Variation A. The "losing" variation was actually the winner—they just hadn't been measuring the right outcome.
They revert to Variation B. Lead volume drops 12%, but revenue increases 31%.
What to Optimize For When Conversion Rate Doesn't Tell the Story
If conversion rate alone doesn't reveal quality, what should you track instead?
- Value per conversion. Not just volume, but what each lead is worth. Track average quote value, sales close rate, and customer lifetime value by landing page variation.
- Qualification rate. What percentage of conversions are actually qualified prospects versus tire-kickers? If Variation A converts 5% but only 40% qualify, while Variation B converts 3.8% but 85% qualify, Variation B wins.
- Sales velocity. How fast do leads move from conversion to close? High-quality leads book faster, negotiate less, and close at higher rates.
- Campaign ROI. Connect ad spend to revenue outcomes. If Variation A costs $50 per lead but generates $1,200 in revenue per lead, while Variation B costs $75 per lead but generates $4,500, the math flips.
These metrics require tracking leads beyond the initial conversion—which is exactly what WhatConverts was built to do.
Read More: Advanced Reporting and Clear Attribution Powers 22% Growth [Case Study]
Stop Optimizing Blind
CRO without revenue visibility is guesswork with extra steps.
When you measure conversions without measuring outcomes, you risk deploying "winners" that quietly degrade performance for months before anyone notices.
The fix isn't complicated: track lead value at the source level, connect conversions to revenue, and let real business outcomes determine what's working.
Ready to stop optimizing for the wrong metric?
Start your free 14-day trial of WhatConverts today or book a demo with a product expert to see how we help prove and grow your ROI.
Get a FREE presentation of WhatConverts
One of our marketing experts will give you a full presentation of how WhatConverts can help you grow your business.
Schedule a Demo
Grow your business with WhatConverts


