You sent your monthly marketing report yesterday. Today, you get an email: “Can you just tell me if this is working?”
Your report was comprehensive. Professional. Google Analytics screenshots, ad performance tables, call tracking metrics, conversion funnels, keyword-level data—the works.
And yet, they didn't read it. Not because they're being difficult, but because they're drowning in data they don't understand.
The Problem: Too Much Data, Zero Clarity
Most agency reports fall into two traps: too complex or too disconnected.
You're speaking marketer. They're speaking business owner. Bounce rate, CPC trends, impression share, quality scores—these matter for optimization. But your client runs a plumbing company. They don't know what impression share means. They want to know: "Did we get customers?"
Numbers without meaning. A table showing 847 clicks, 43 conversions, and $3,247 in spend tells you a story. To them, it's just numbers. What does 5.08% conversion rate mean for their business? Is that good?
Dashboard access isn't transparency. You give clients login credentials thinking it builds trust. They log in, see dozens of metrics, and close the tab confused. They have access to everything, but they understand nothing.
Why Data Confusion Threatens Client Retention
When clients don't understand their reports, the relationship falls apart.
Trust erodes. Can't see value? They assume there isn't any. Confusion becomes doubt, and doubt becomes churn.
Budget approvals stall. Time to scale? They need to know why. But they've been nodding along to reports they don't understand for months. They're not betting more money on something they can't explain.
Competitors win on clarity alone. Another agency pitches "simple reporting you'll actually understand." Your client, drowning in your data dumps, takes the meeting. Your results might be better, but their presentation wins anyway.
How You Can Solve It
You can fix this without new tools—it just takes rethinking your reports.
- Speak Business Language, Not Marketing Jargon
Replace "43 conversions" with "43 leads generated; 16 became customers worth $5,000 each." Show outcomes, not analytics terms. - Lead with One Clear Metric
What's the single number that matters most? Qualified leads? Cost per customer? Lead with that. Everything else is context. - Use Simple Attribution
"Google Ads brought in 18 calls. Facebook brought in 12 forms. Organic drove 8 inquiries." Clear channels without requiring clients to understand UTM parameters. - Create a 60-Second Summary
Start every report with what changed, why it matters, and what you're doing about it. Clients should grasp the story in under a minute. - Show Actual Leads, Not Just Numbers
When possible, include lead details: "Here's who called, what they asked about, and where they came from." Make it real.
This works. But it requires discipline to keep reports simple when you want to show all your work.
The Easier Solution
Instead of manually translating analytics into business language, use a platform that reports in terms clients understand.
That's what WhatConverts does.
- Shows actual leads with names and details instead of just conversion counts
- Translates data into dollars earned, connecting leads to actual business revenue
- Clear channel attribution that business owners immediately grasp
- Customizable views that match how clients think about their business
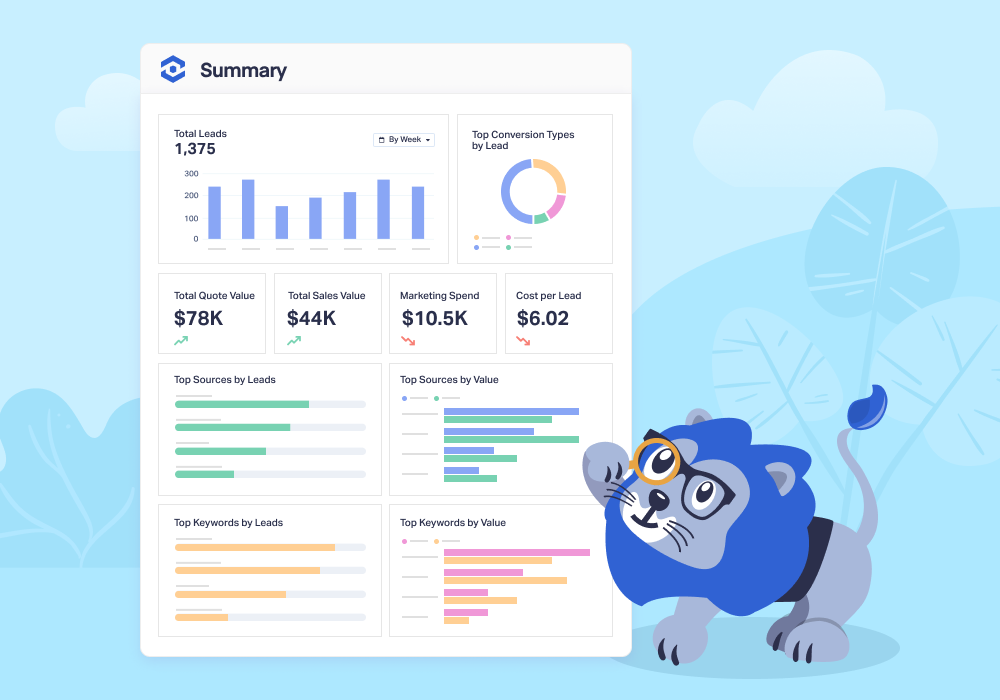
- Visual, scannable design with clear up/down indicators
- Lead-centric reports focused on outcomes, not analytics jargon
The result? Clients engage with results instead of nodding along confused.
Real Agency Example
Digilatics had a home services client ready to grow, but growth required partnership. The client wanted transparency that went beyond standard metrics like clicks and CTR—numbers that left them asking "but is this actually working?"
After implementing WhatConverts, Digilatics transformed their reporting to speak the client's language: leads generated, jobs booked, quote-to-sales percentages, ROI by channel and location.
The new reports:
- Answered questions before they were asked
- Built client trust
- Fueled 22% business growth
- Led to the client's first $1 million monthly revenue milestone
Read More: Advanced Reporting and Clear Attribution Powers 22% Growth [Case Study]
Why This Matters for Agencies
When clients understand their reports:
- They ask strategic questions instead of saying "looks good"
- Budget conversations become straightforward math, not contentious negotiations
- They spot issues and opportunities themselves—problem-solving with you, not blaming you
- Renewals are easier because they can explain to their CFO why it's working
- Referrals increase because they're confident in what you deliver
Agencies that solve the analytics overwhelm problem keep clients longer, win bigger retainers, and turn clients into advocates.
And whether you simplify your existing reports or use WhatConverts, the payoff is the same: stop sending data dumps. Start having strategic conversations.
Ready to replace confusion with clarity and turn clients into engaged partners?
Start your free 14-day trial of WhatConverts today or book a demo with a product expert to see how we help prove and grow your ROI.
Get a FREE presentation of WhatConverts
One of our marketing experts will give you a full presentation of how WhatConverts can help you grow your business.
Schedule a Demo
Grow your business with WhatConverts


