


Running Google Ads without lead-quality visibility is guesswork. CTR, CPC, and impression share tell you what happened, but not whether those clicks turned into real customers. Agencies end up defending budgets using surface metrics while high-intent opportunities stay buried in the noise.
The new Google Ads Report in WhatConverts closes that gap. It pulls your Google Ads data into WhatConverts, enriches it with full lead attribution, and ties every click and conversion to lead quality, quote value, and sales value.
One report. One source of truth. A clear line from Google Ads spend → lead → ROAS.
Why It Matters for Agencies
Google Ads is often your client’s largest marketing investment. And with rising CPCs and CPAs, it’s becoming the hardest channel to justify.
The problem for marketers is that standard dashboards show activity, not outcomes. They can’t answer:
- Which campaigns generate quotable leads?
- Which keywords produce real revenue?
- Where are we wasting budget?
- What should we scale next month?
The Google Ads Report answers all four in a clean, easy-to-understand report.
Instead of “Here are your clicks,” you can finally say, “Here’s where your revenue came from.”
Note: To get the most value from this report, you need to be on the Elite Plan. This plan unlocks Marketing Spend, which seamlessly pulls your Google Ads budget into the report, revealing cost per click, cost per lead, ROAS, and other budget-based metrics. If you aren't on the Elite Plan, upgrading your plan is easy.
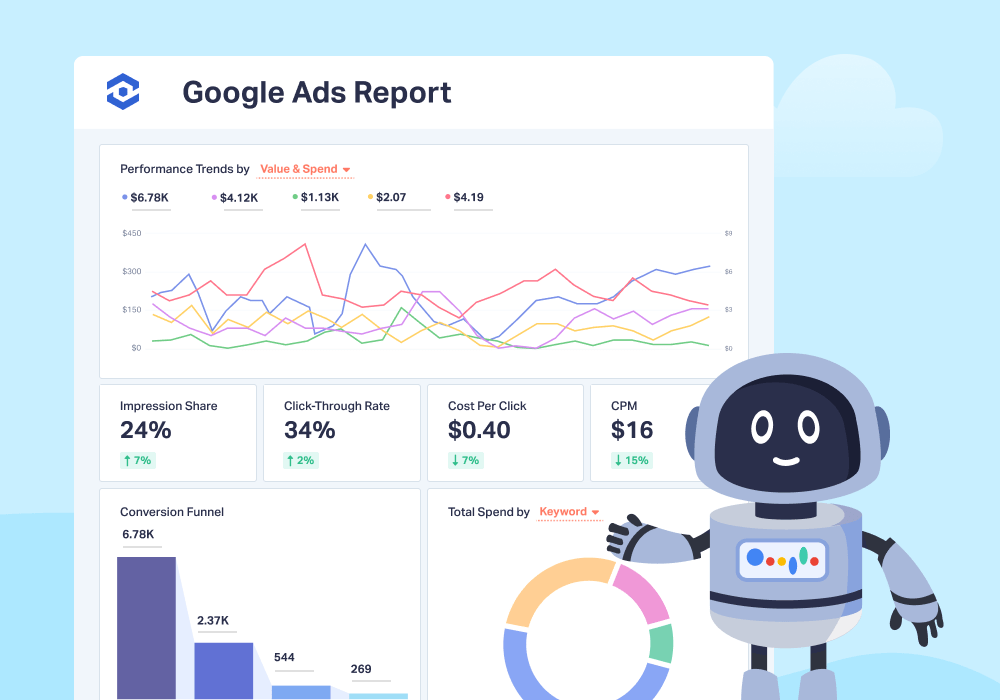
Inside the Google Ads Report
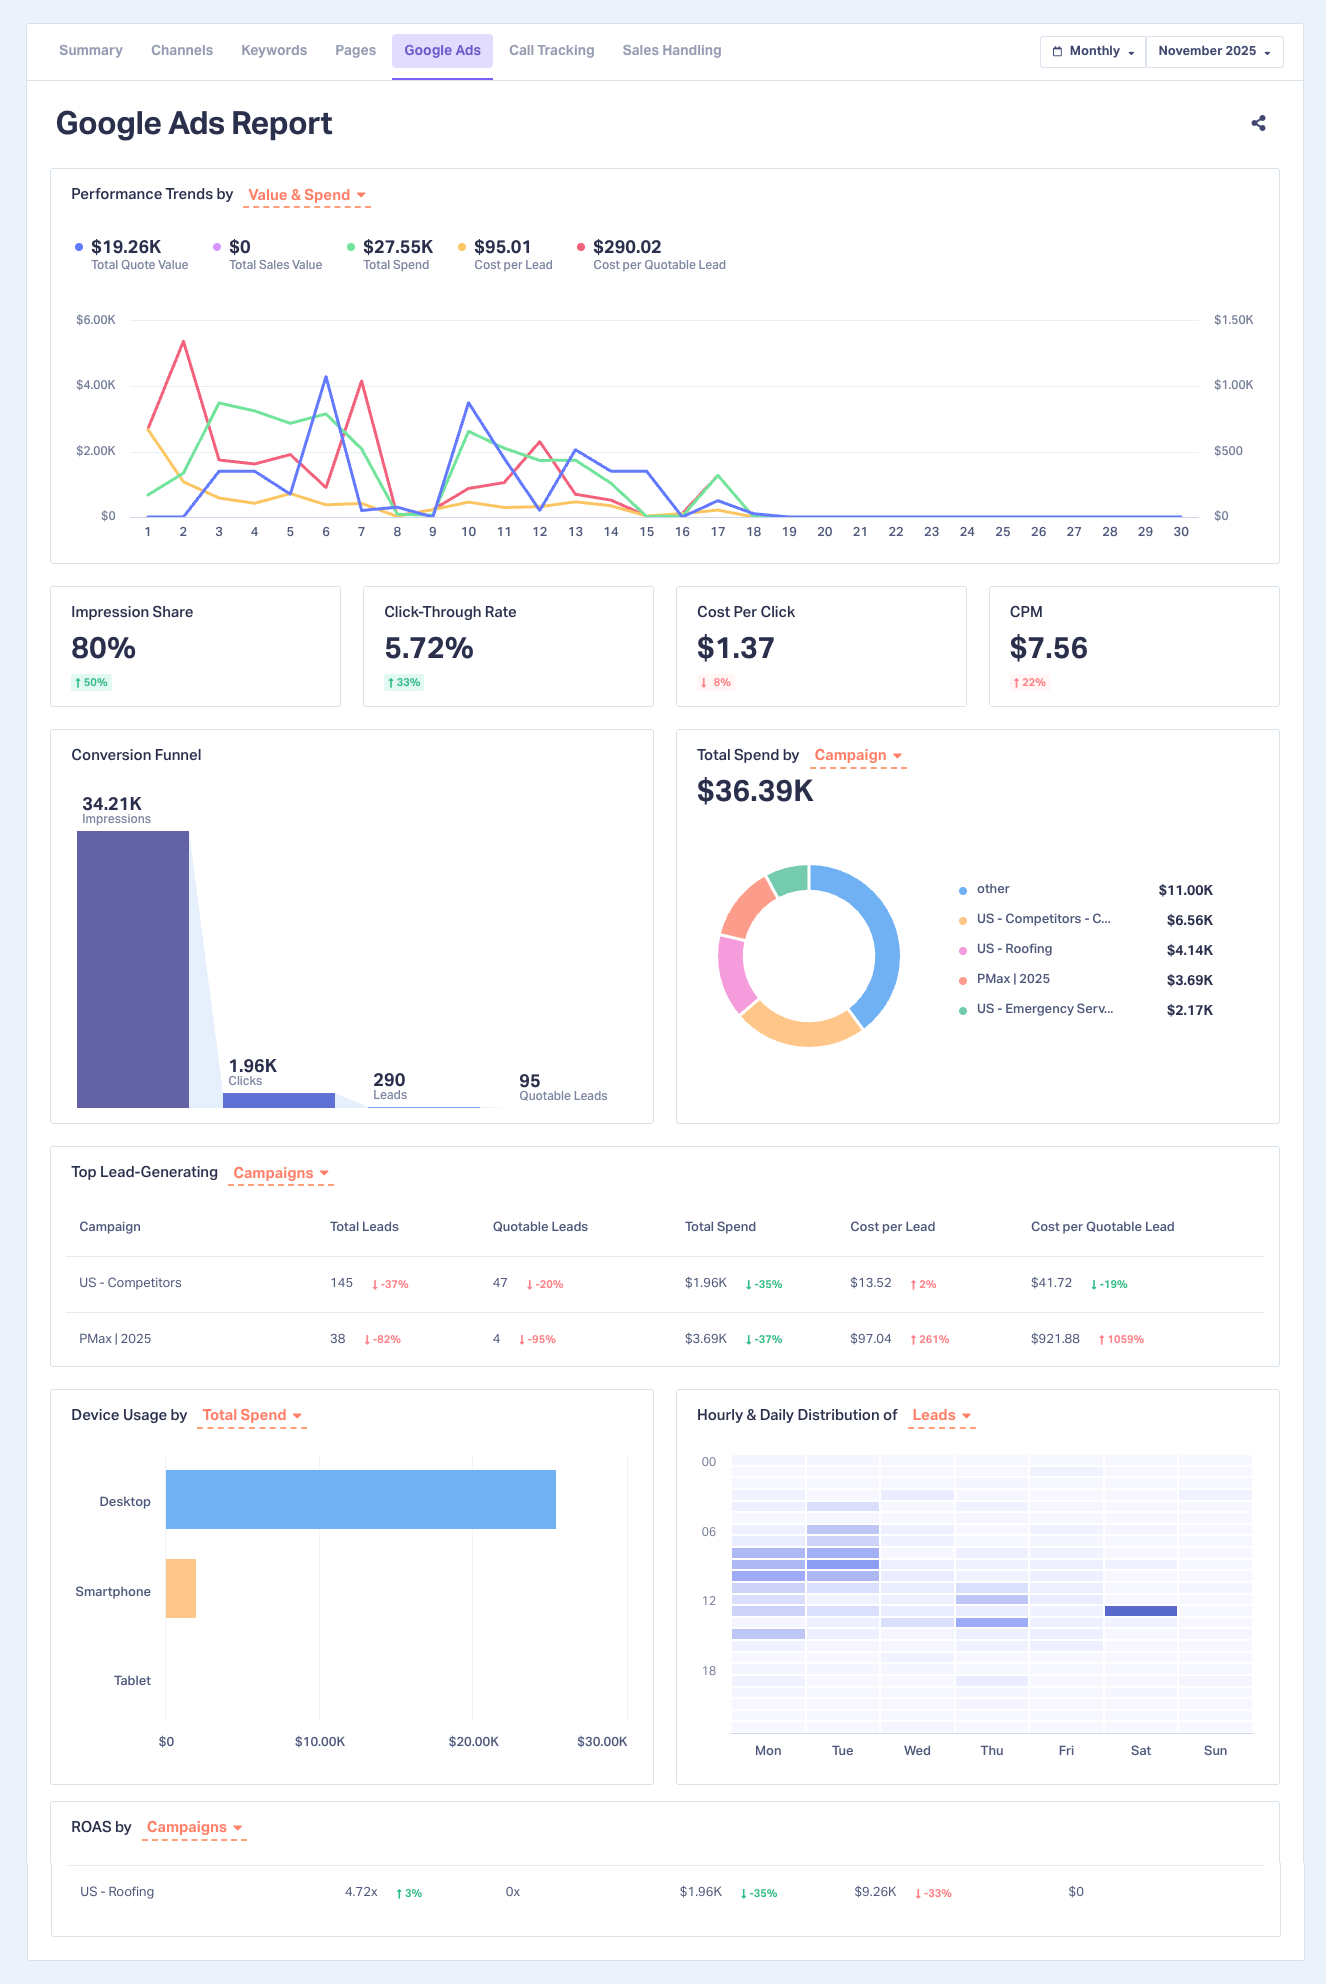
- Performance Trends by Value & Spend or by Conversions
- Four Key Metrics
- Conversion Funnel
- Total Spend by Keyword, Campaign, or Content
- Top Lead-Generating Campaigns, Keywords, or Content
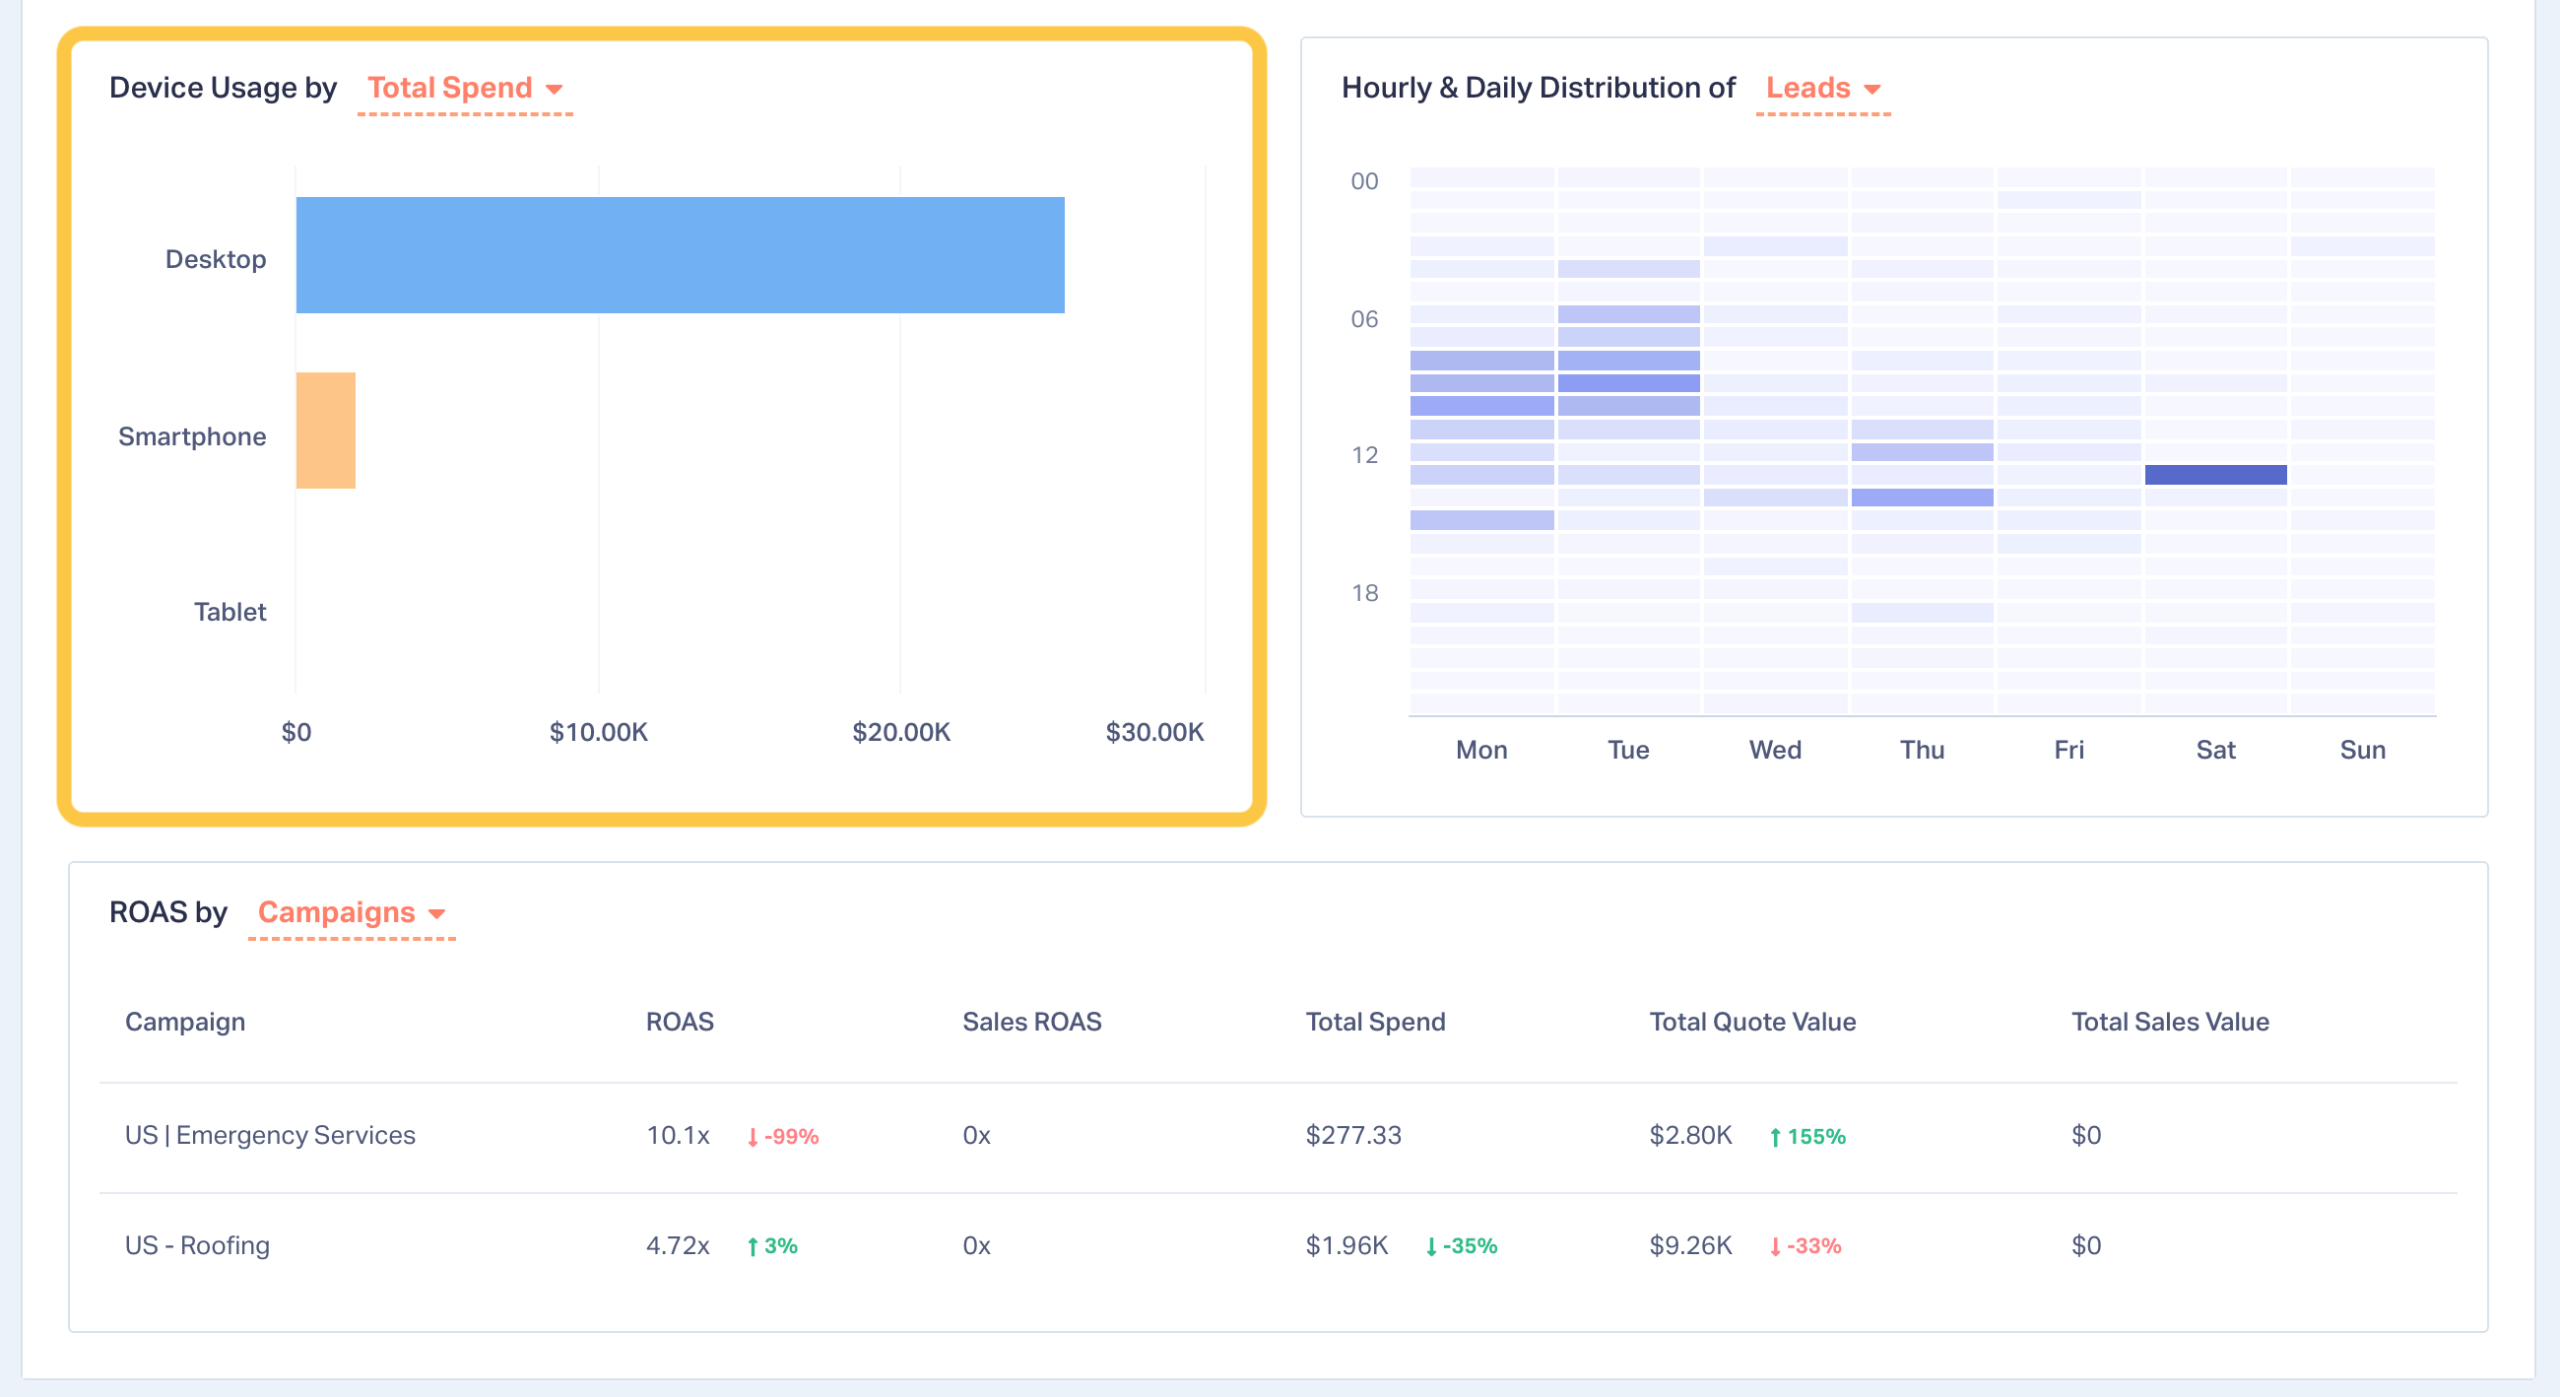
- Device Usage
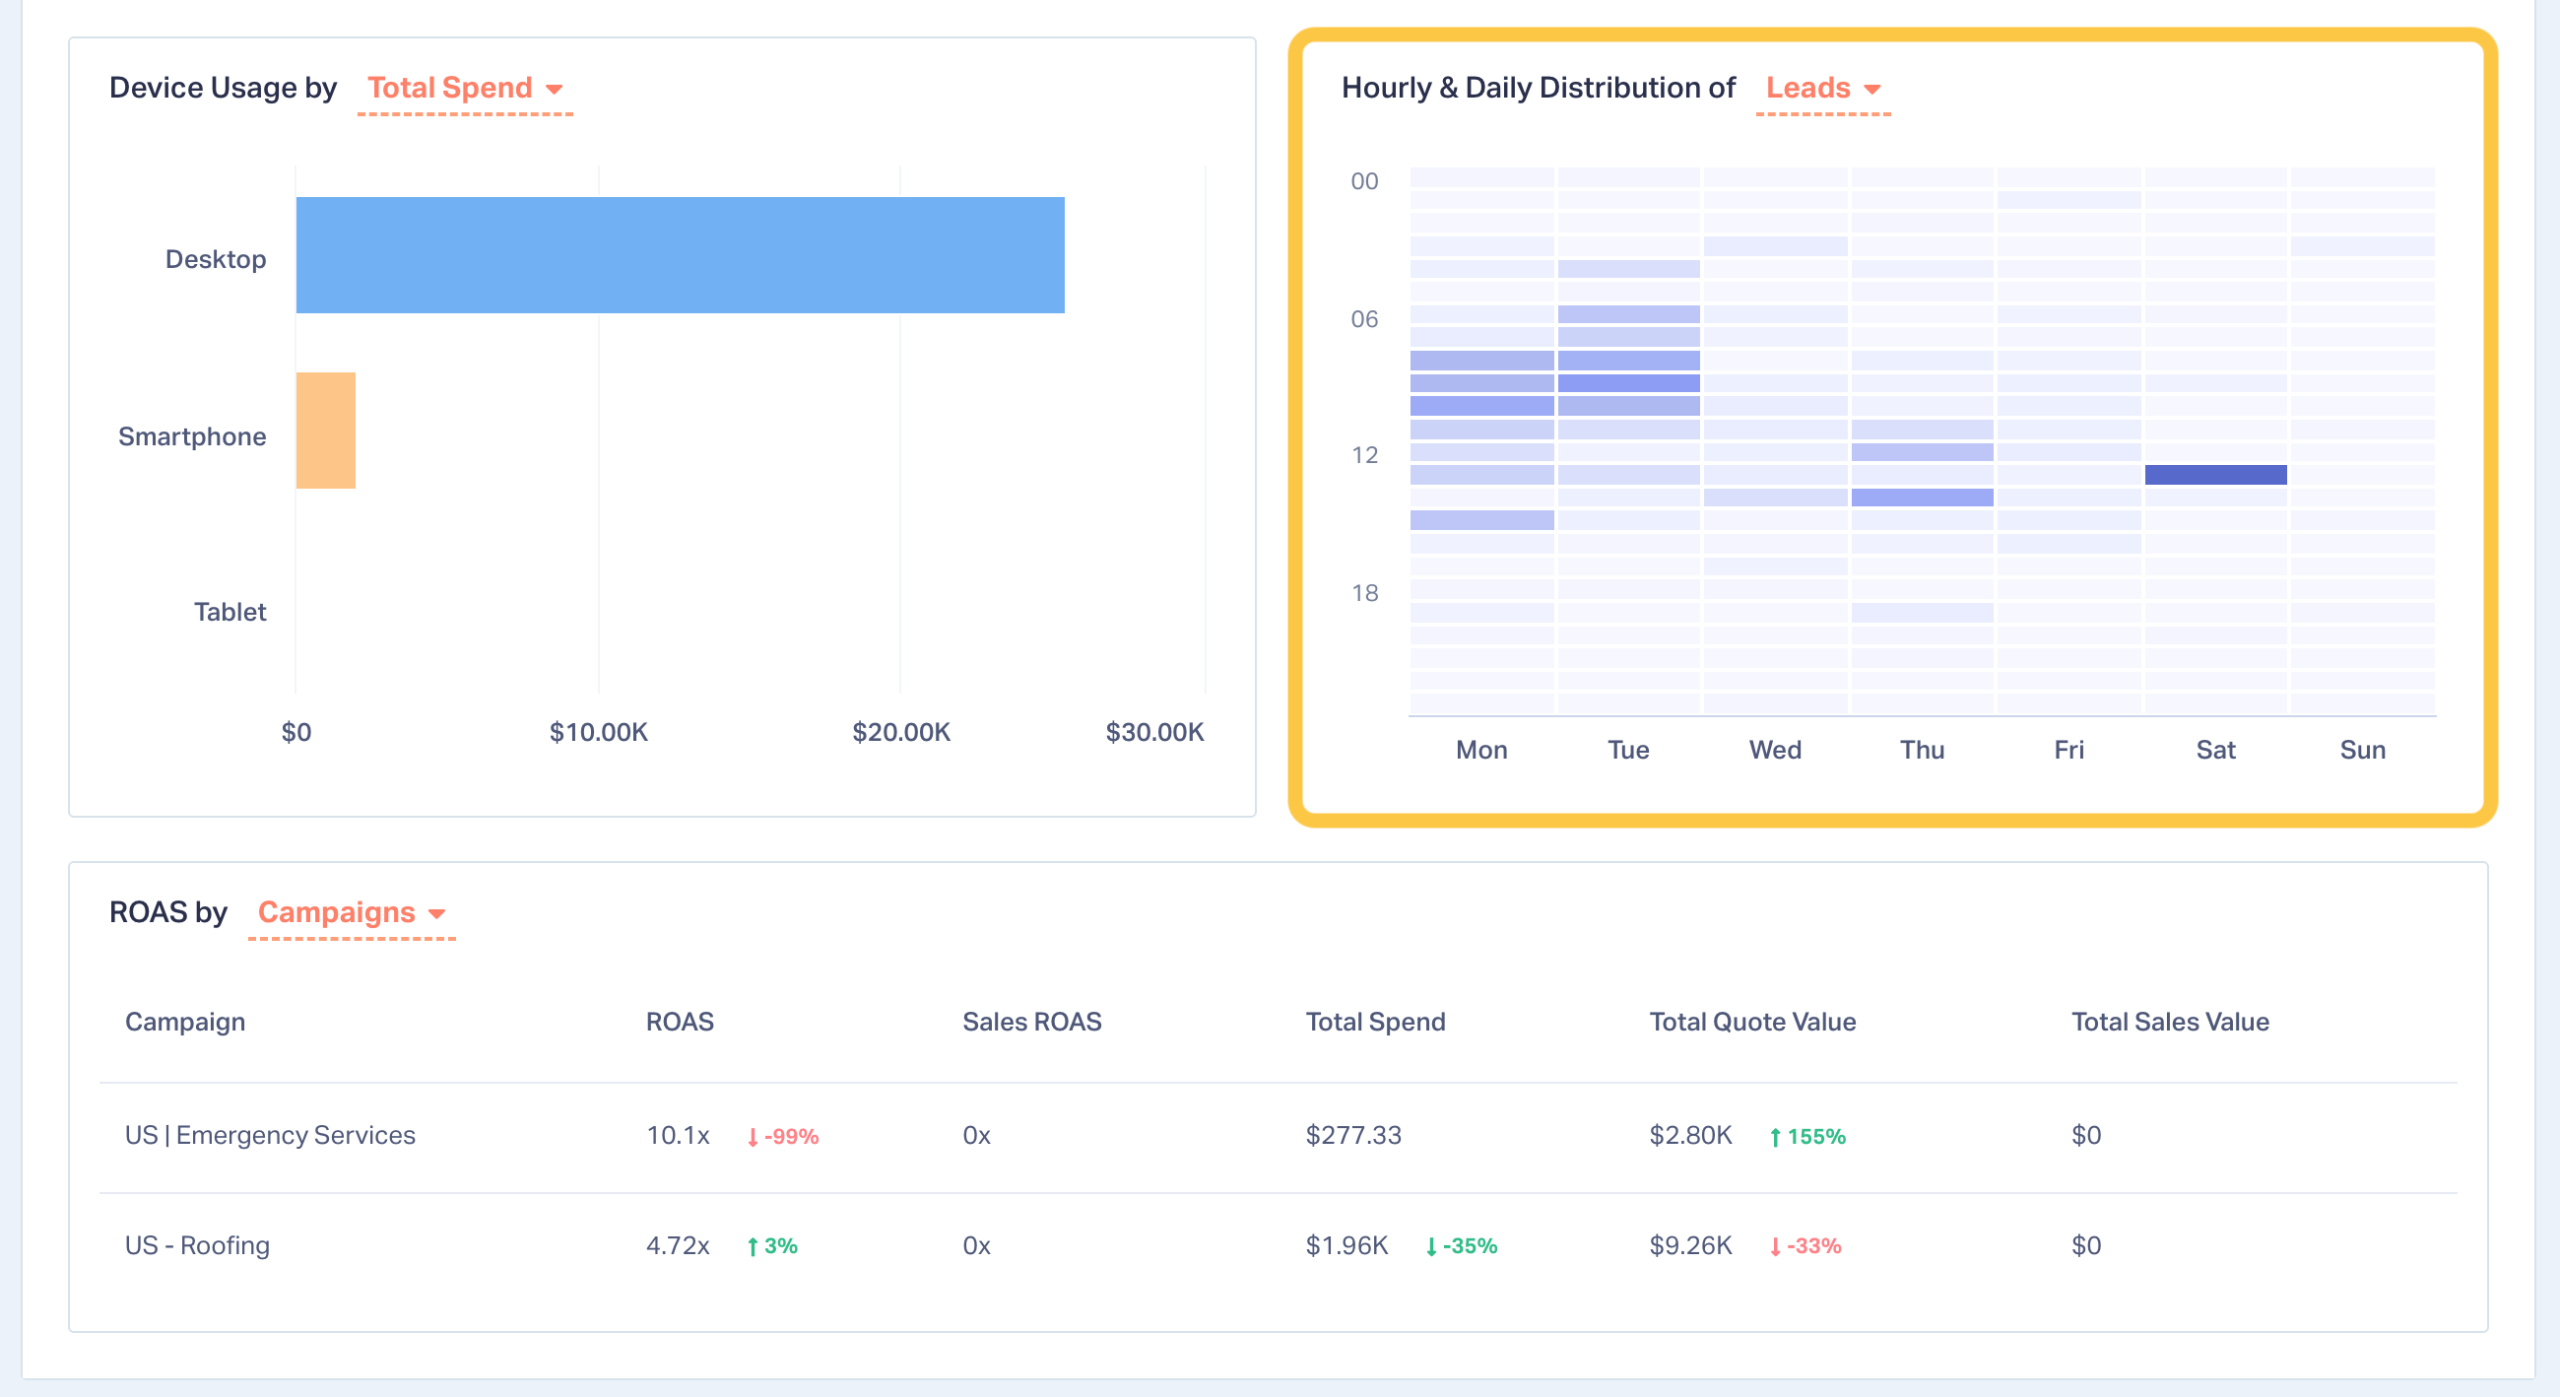
- Hourly & Daily Distribution
- ROAS by Campaign, Keyword, or Content
To keep this product update sharp and useful, we’re spotlighting the four sections agencies rely on most, followed by a quick summary of the additional insights you can unlock.
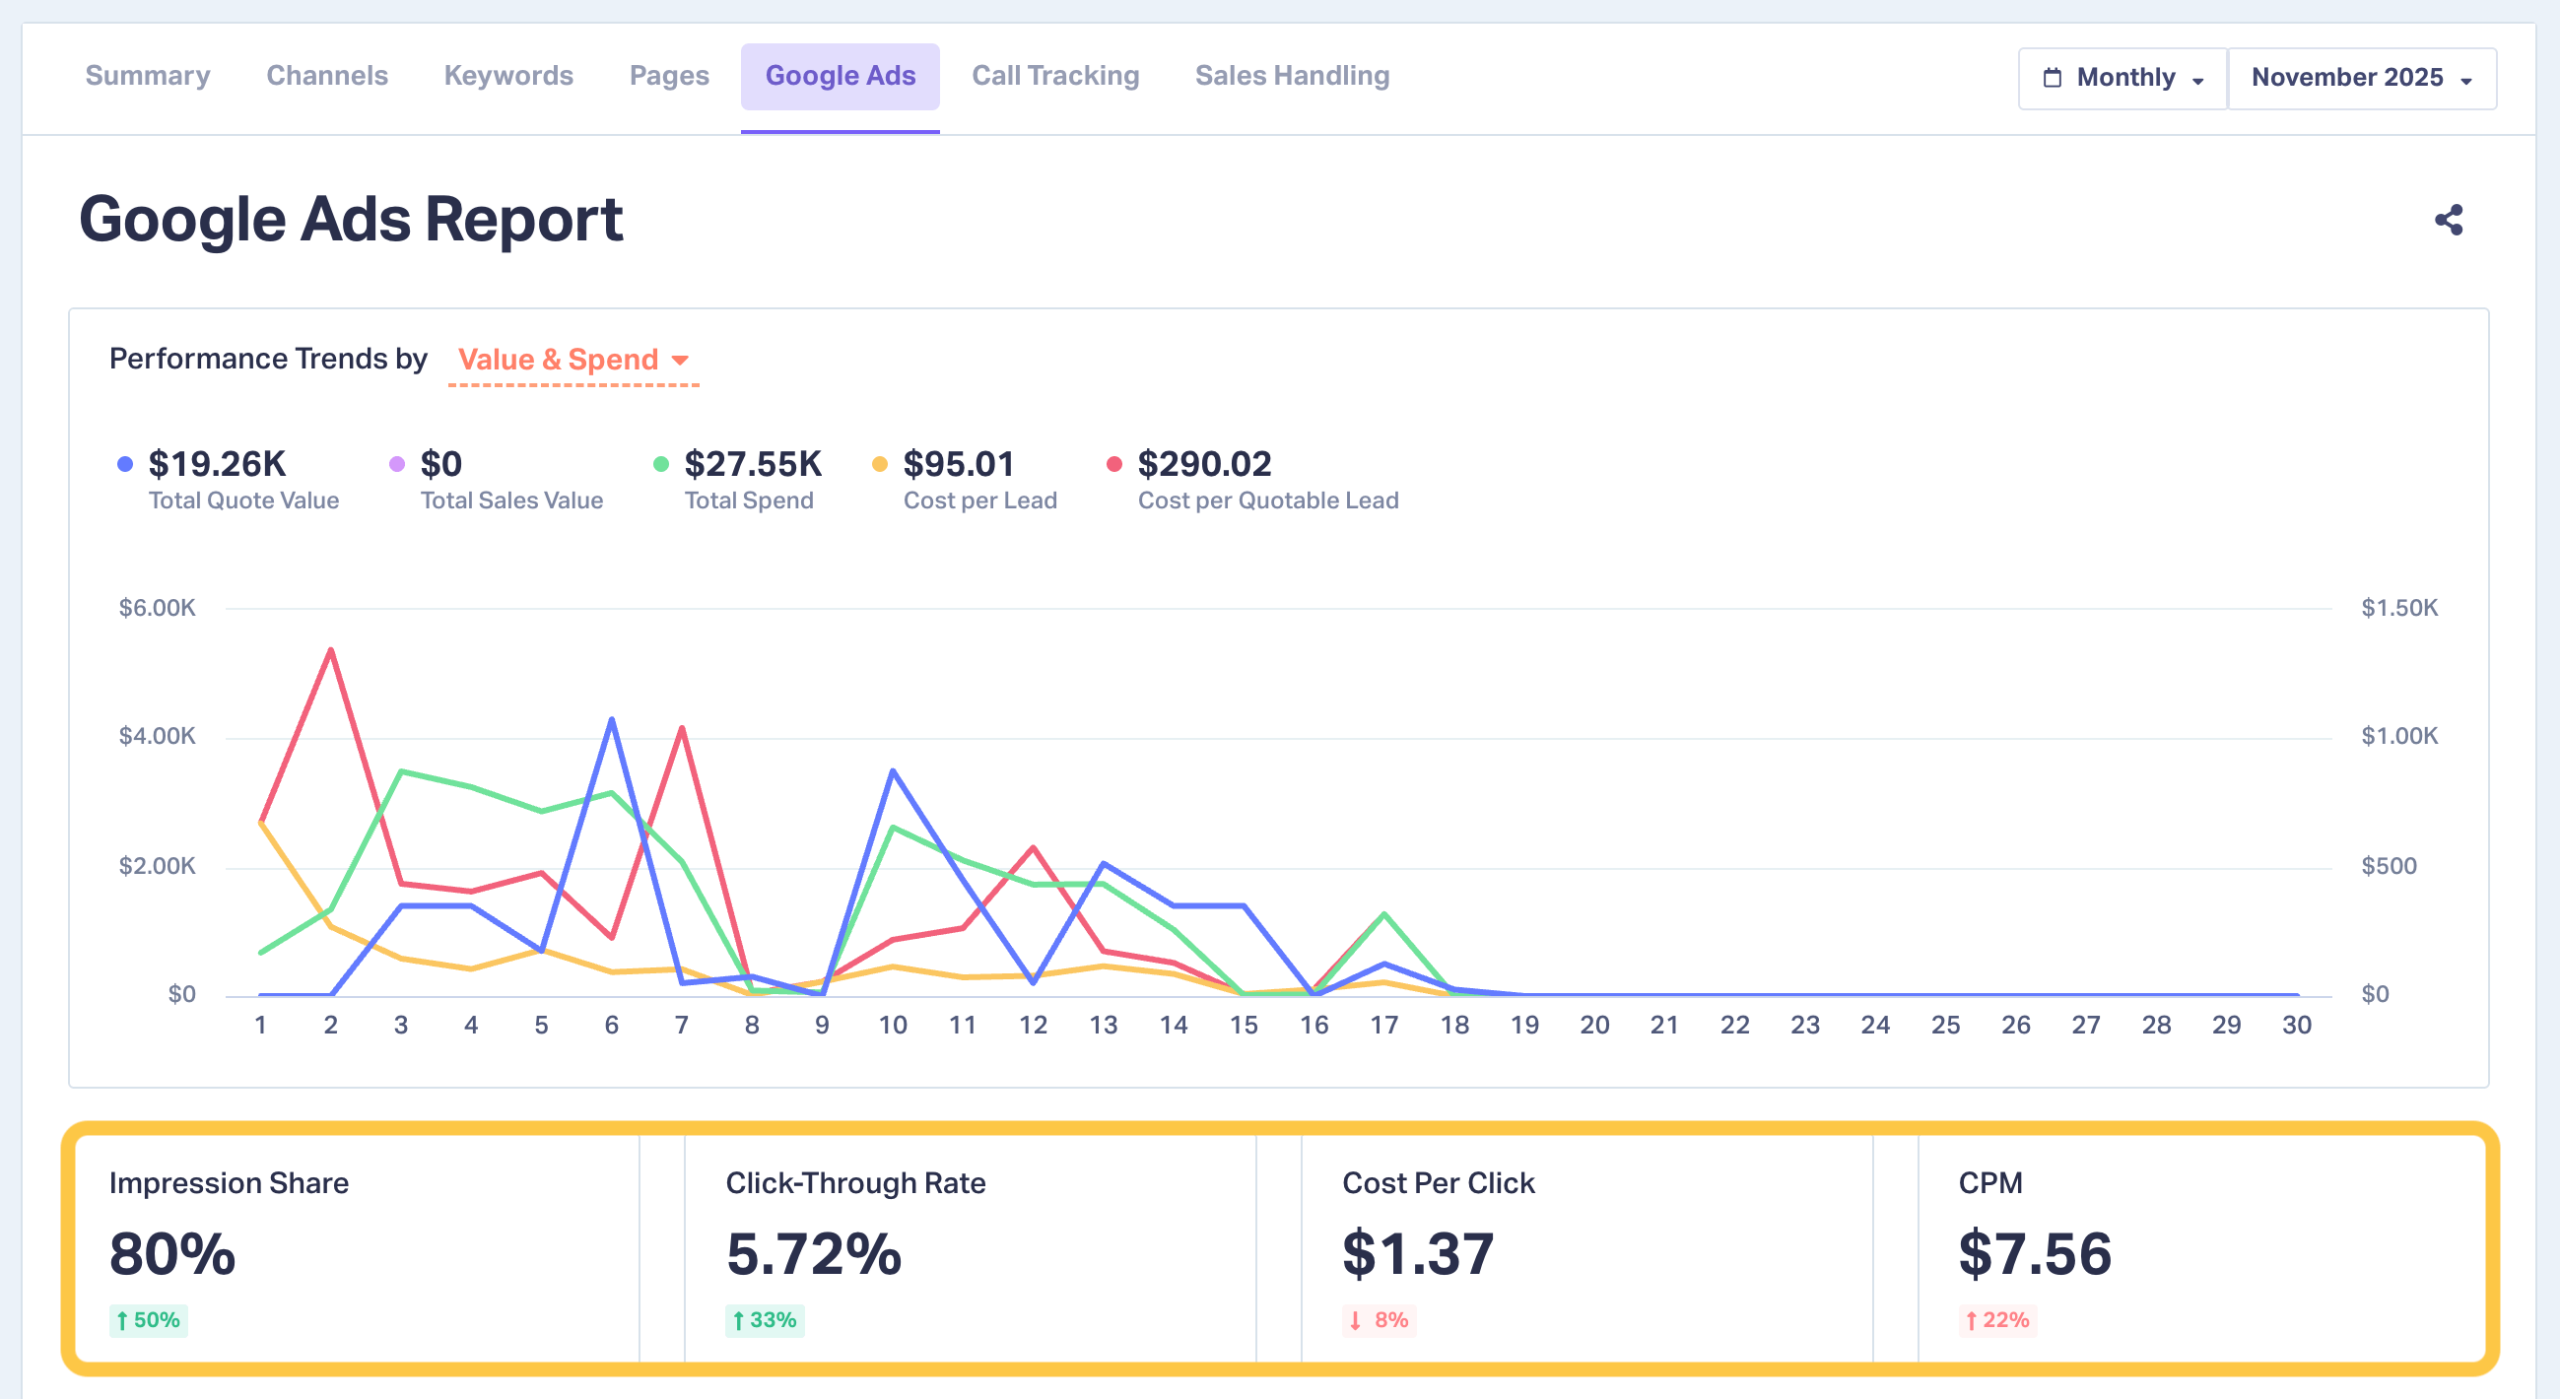
1. Performance Trends by Value & Spend (or by Conversions)
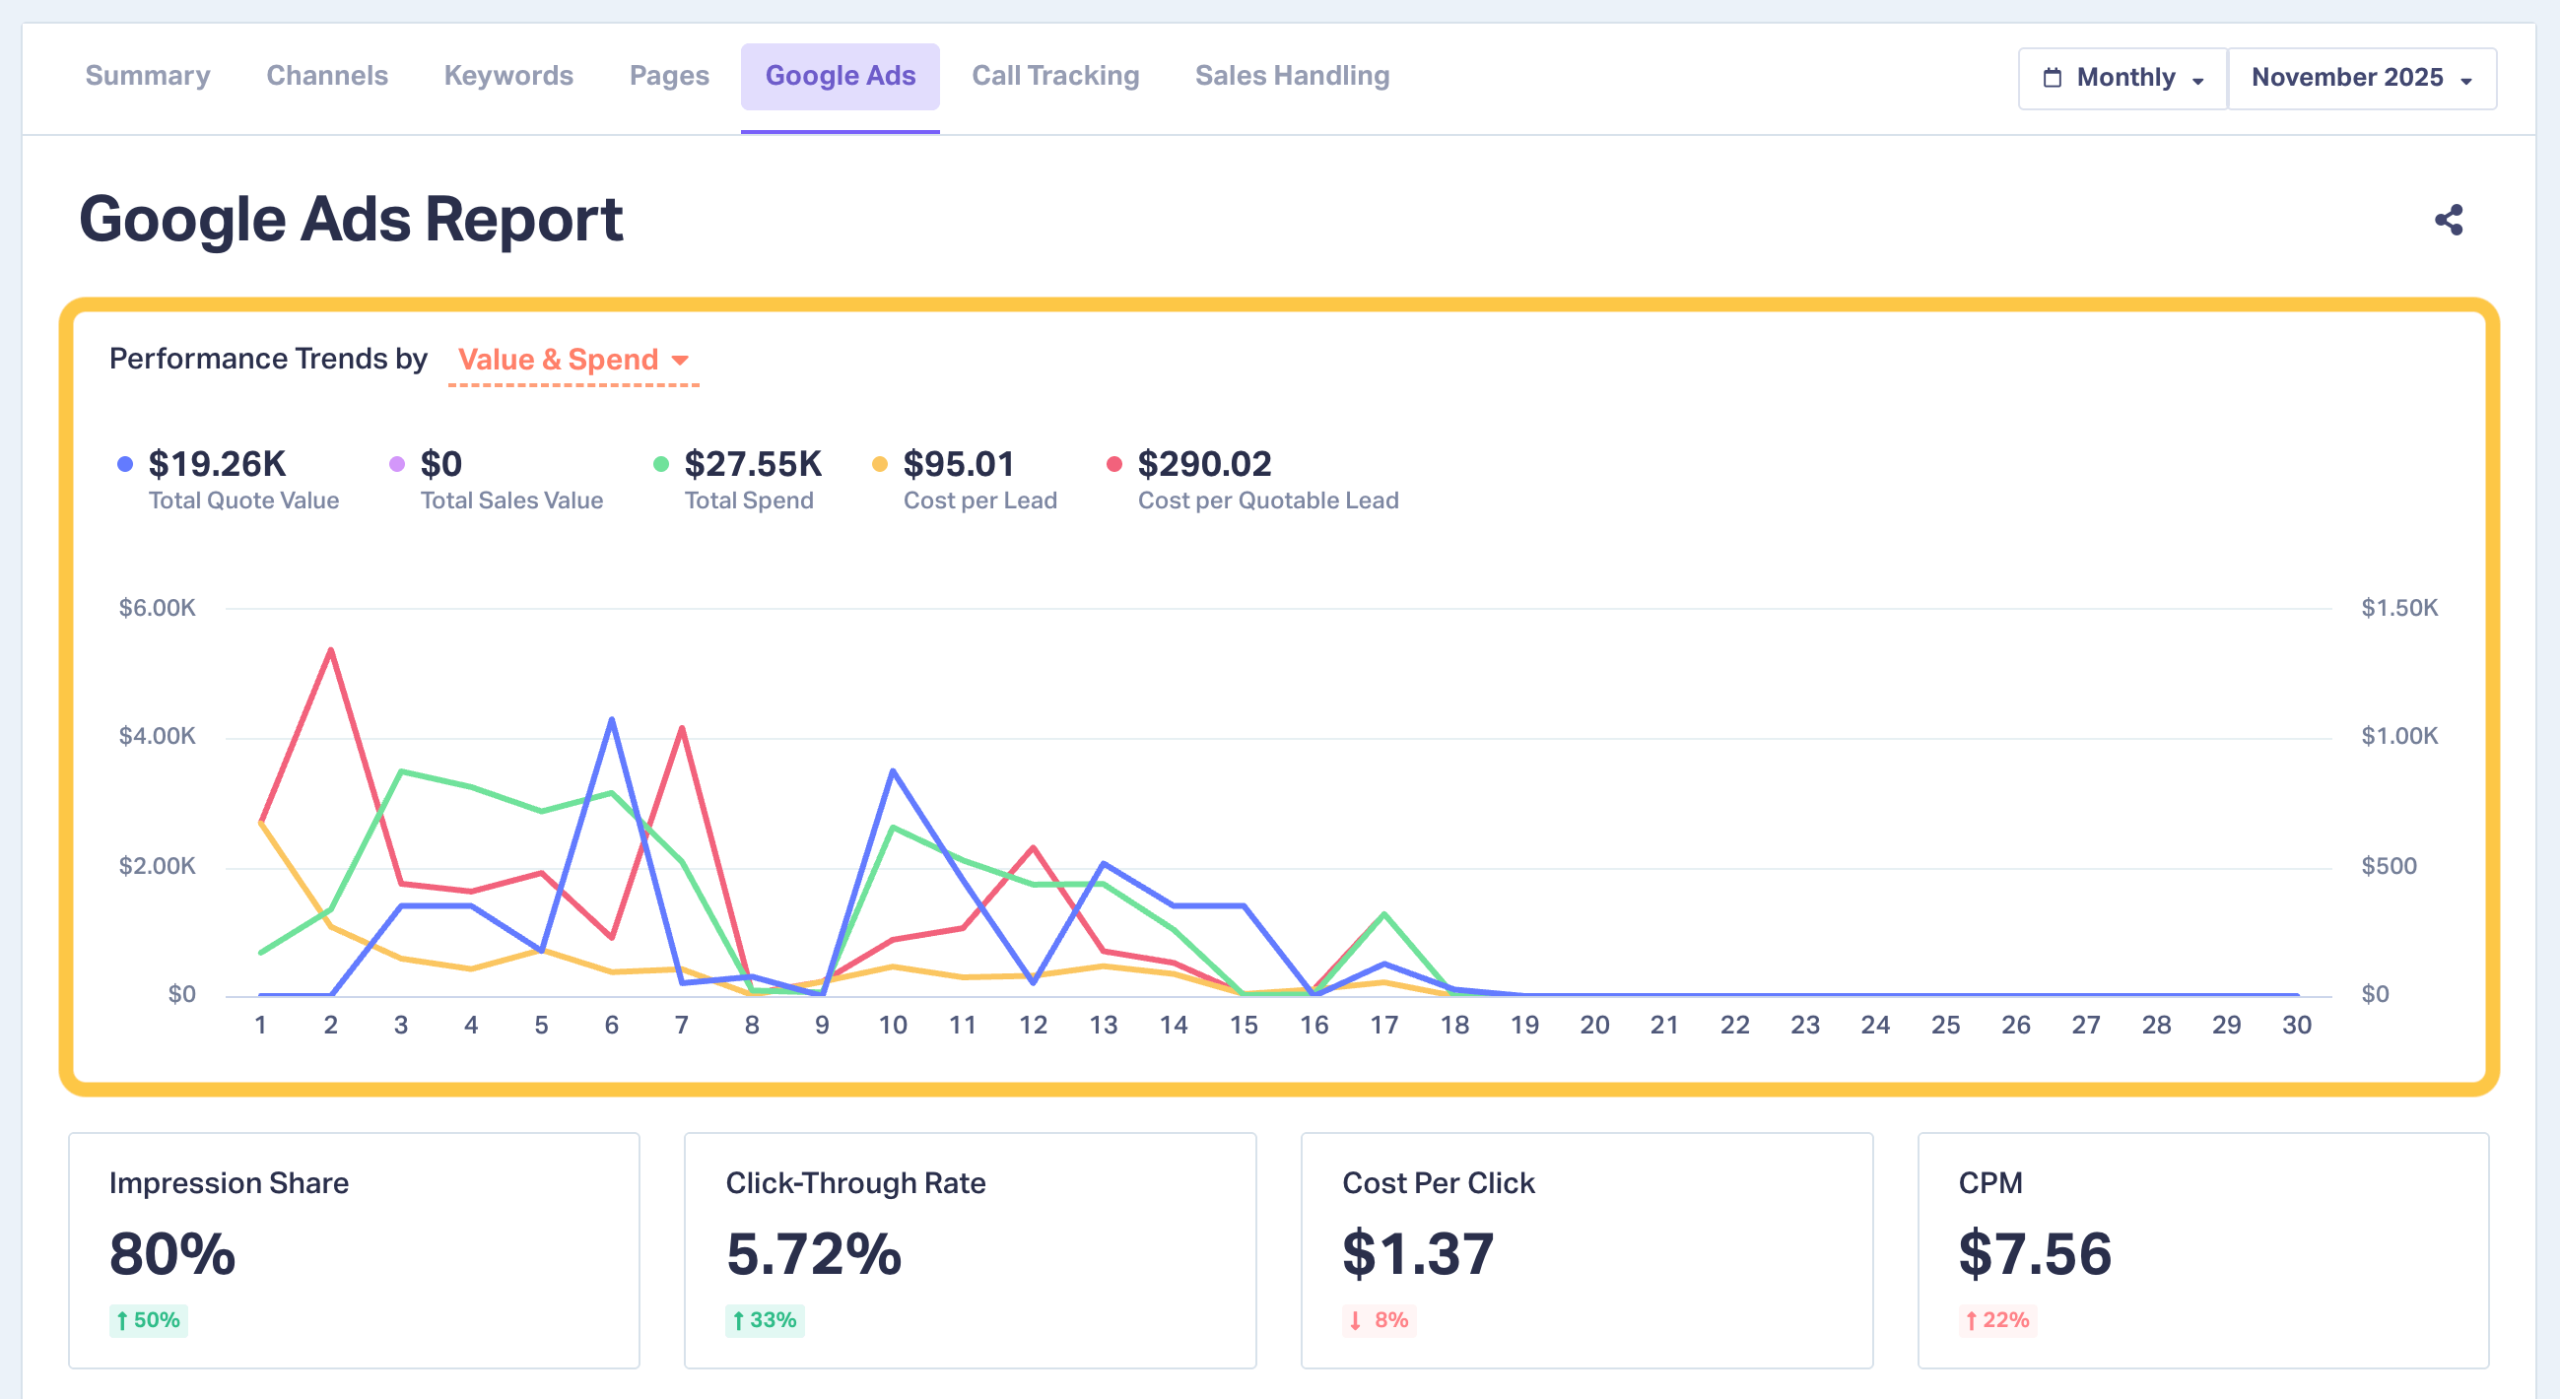
Example
A roofing agency spotted a drop in cost per quotable lead halfway through the month, right after launching new emergency-repair messaging. Lead volume stayed flat, but quality improved dramatically.
What Agencies Do With It
Highlight the effects of recent changes and optimize campaigns based on those learnings. For example, adjust more campaigns to target emergency-repair messaging.
2. Conversion Funnel (Impressions → Clicks → Leads → Quotable Leads)
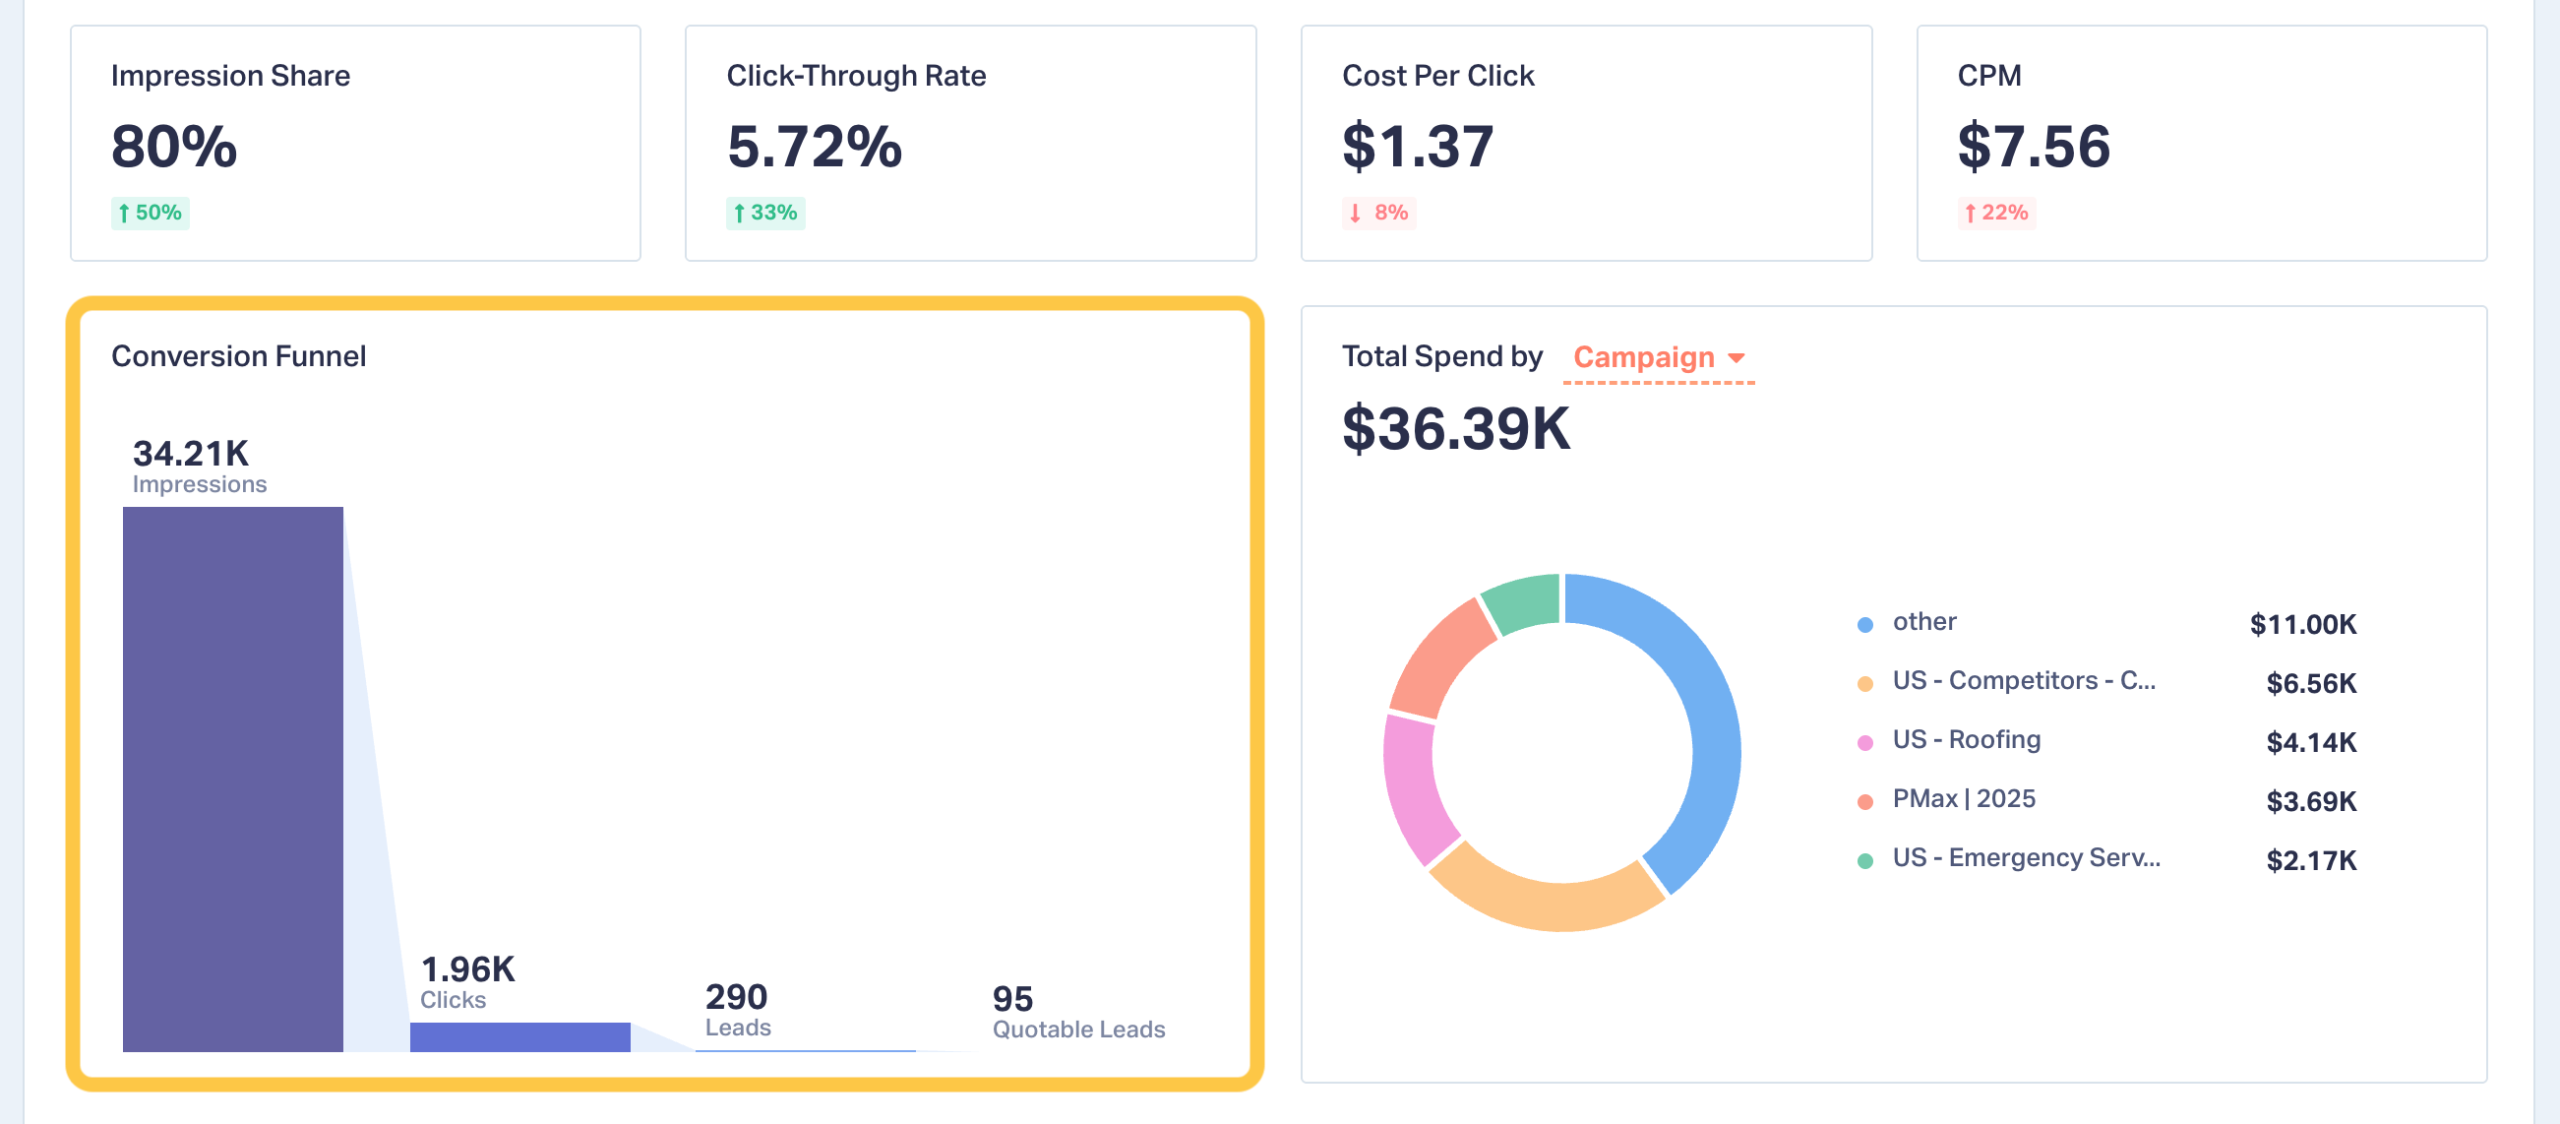
Example
An HVAC company had strong click volume but low conversion rates. The funnel revealed most clicks came from mobile searches like “AC tune-up coupons” and other high-intent, low-value keywords.
What Agencies Do With It
Exclude mismatched keywords, tighten targeting, and fix device-specific drop-offs (like mobile landing pages).
3. Budget Allocation: Spend by Campaign, Keyword, or Content
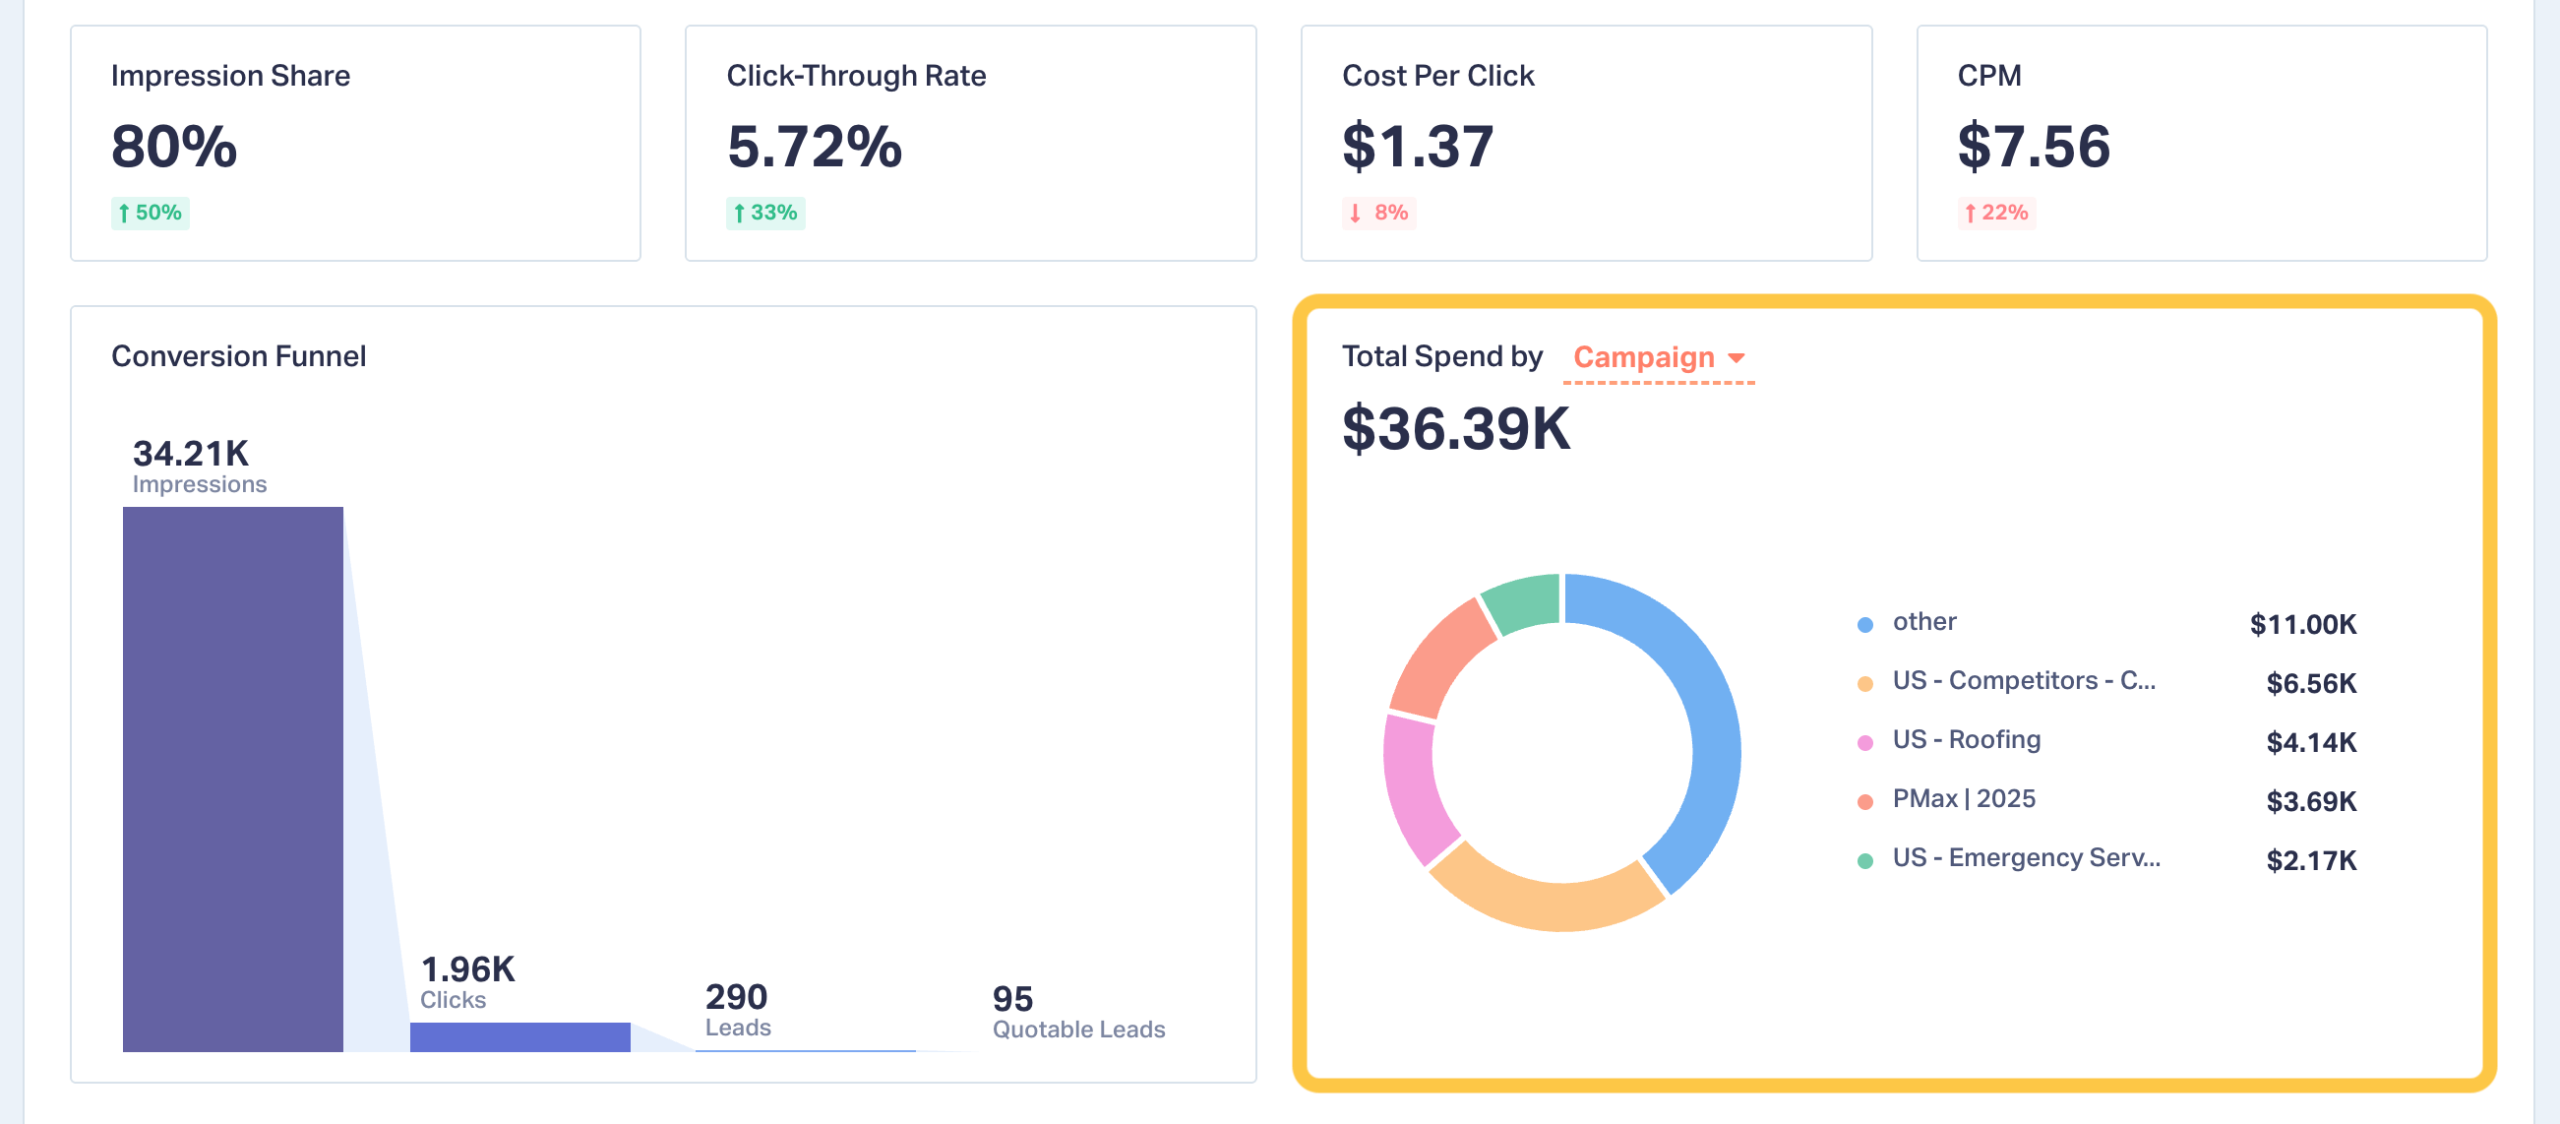
Example
A personal injury firm discovered 40% of spend went to broad “injury lawyer” keywords that produced weak leads. But niche “truck accident attorney” terms — only 10% of spend — drove their highest-value cases.
What Agencies Do With It
Cut waste. Expand proven niches. Reinvest with confidence.
4. ROAS by Campaign, Keyword, or Content
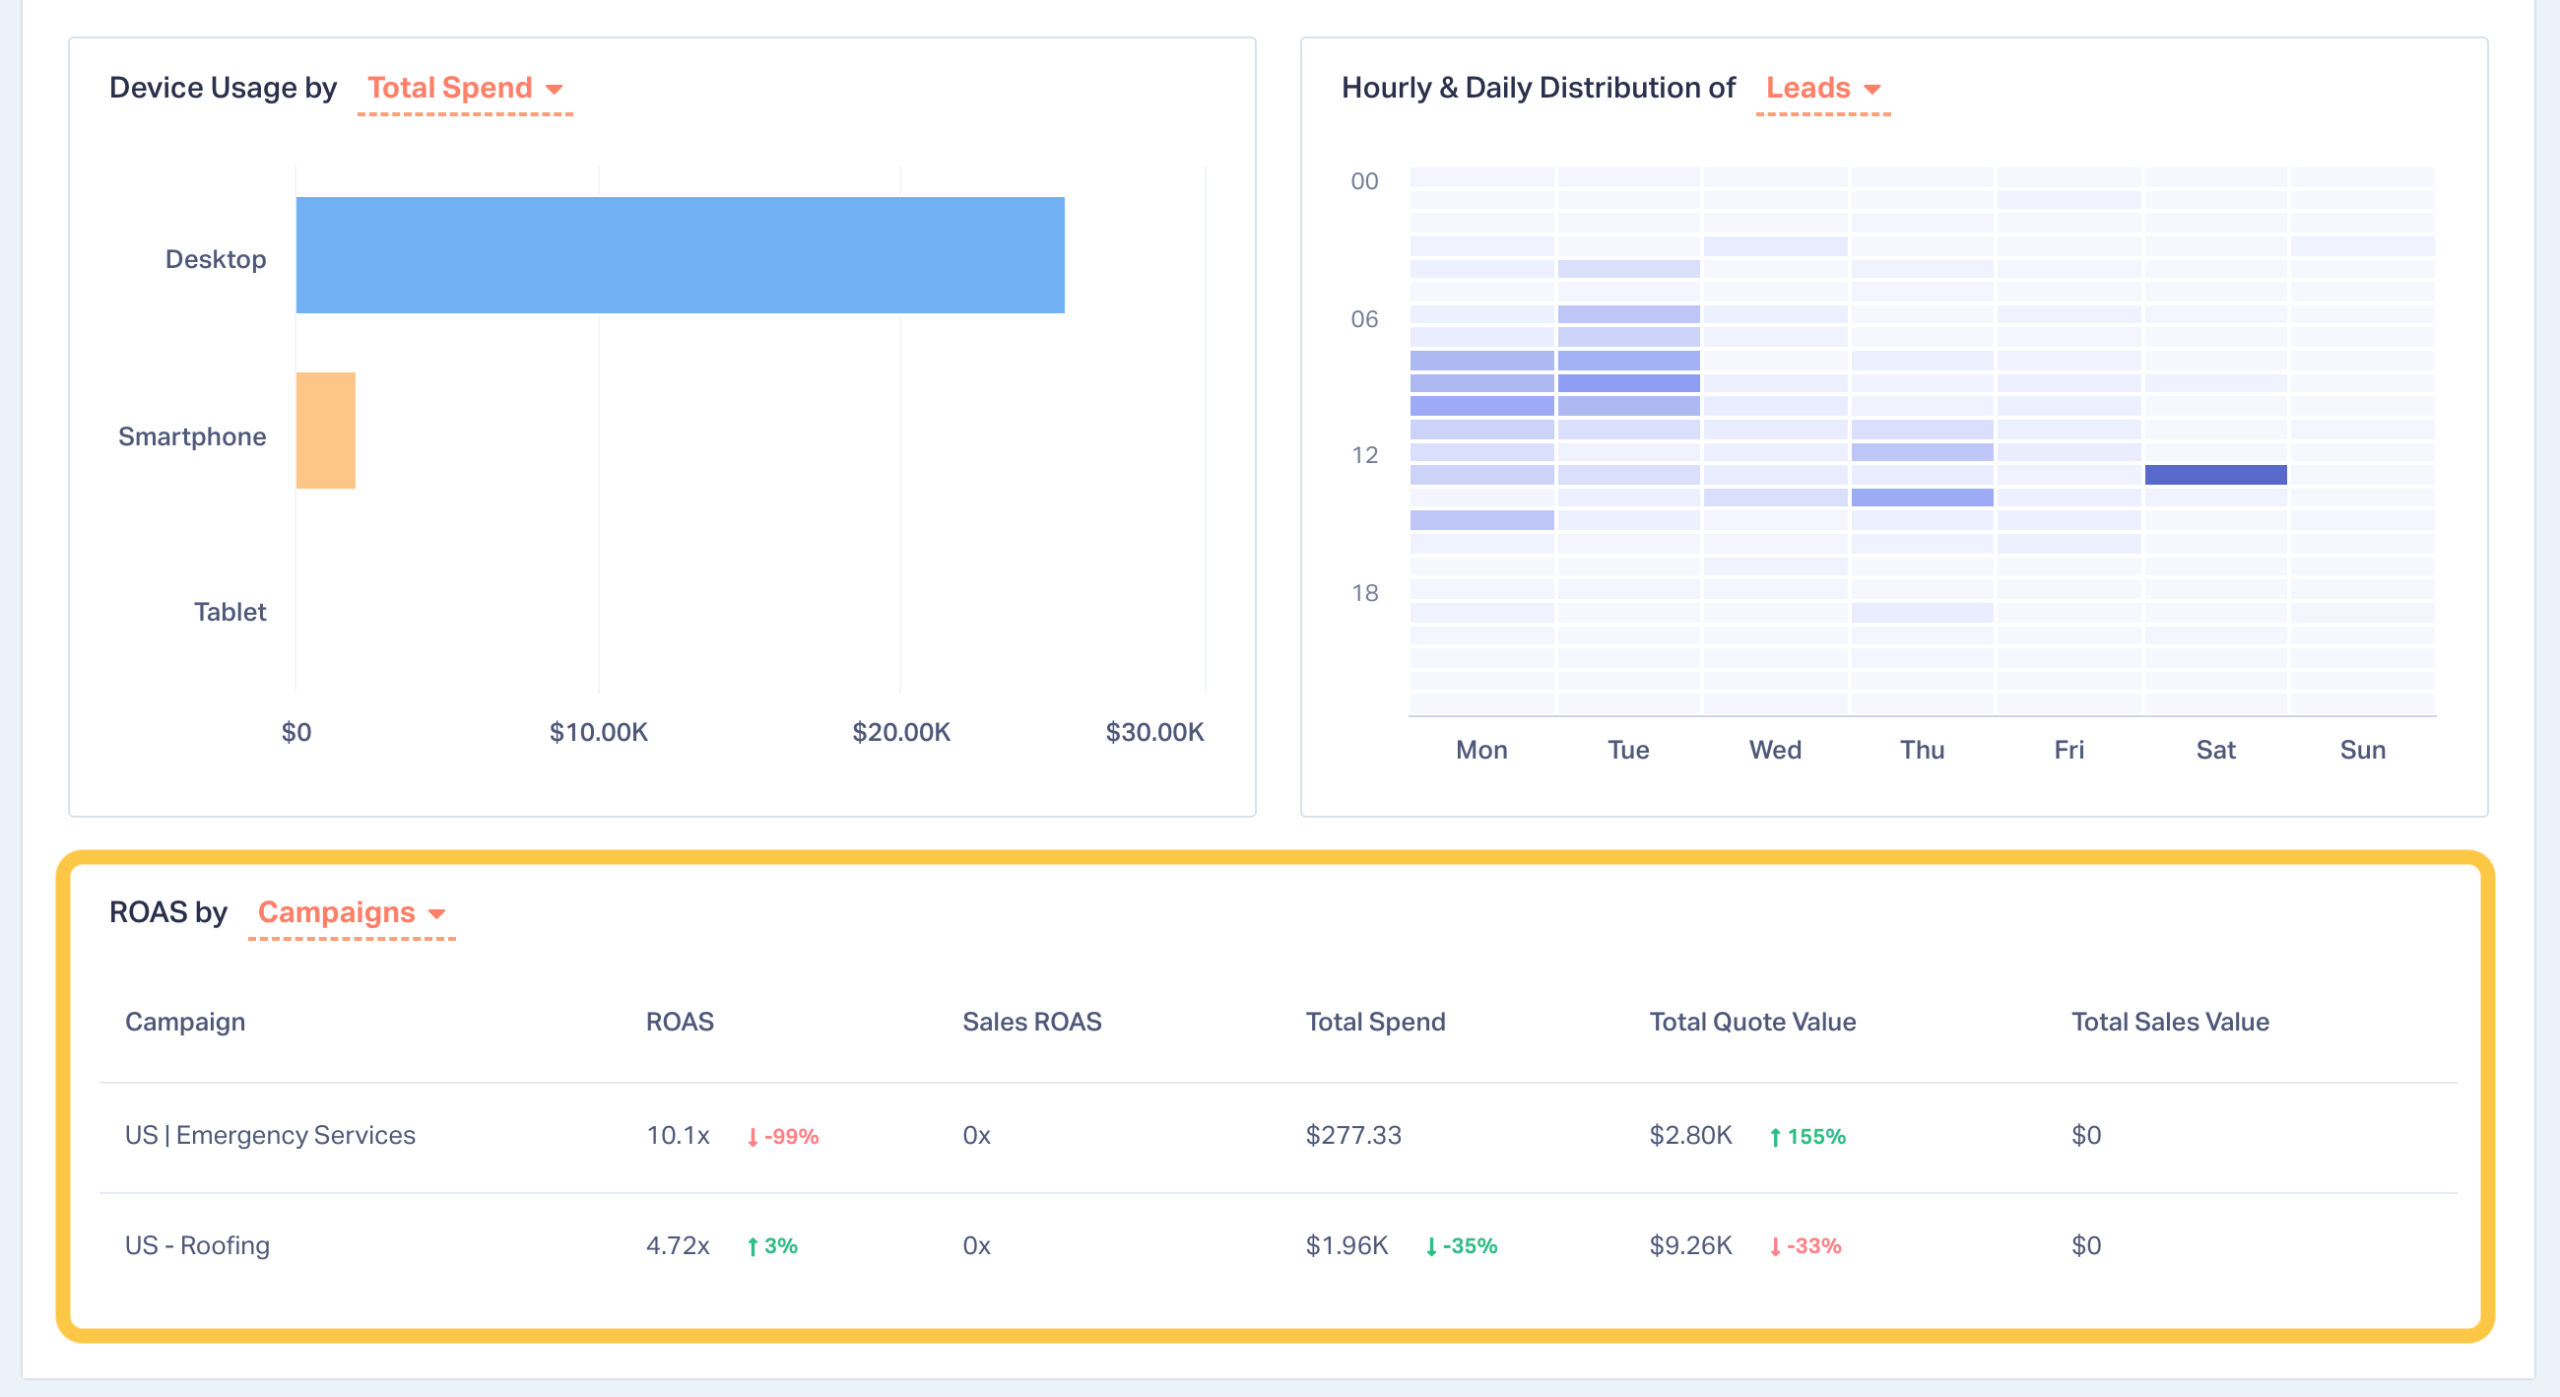
Example
One agency found that a keyword with a high CPC and low conversion volume returned 6× ROAS, while “efficient” keywords barely broke even.
What Agencies Do With It
Make revenue-led bidding decisions, not volume-led ones.
Additional Insights You Can Explore
The four sections below give you the data you need to extract even more nuanced insights from your Google Ads.
Four Key Metrics
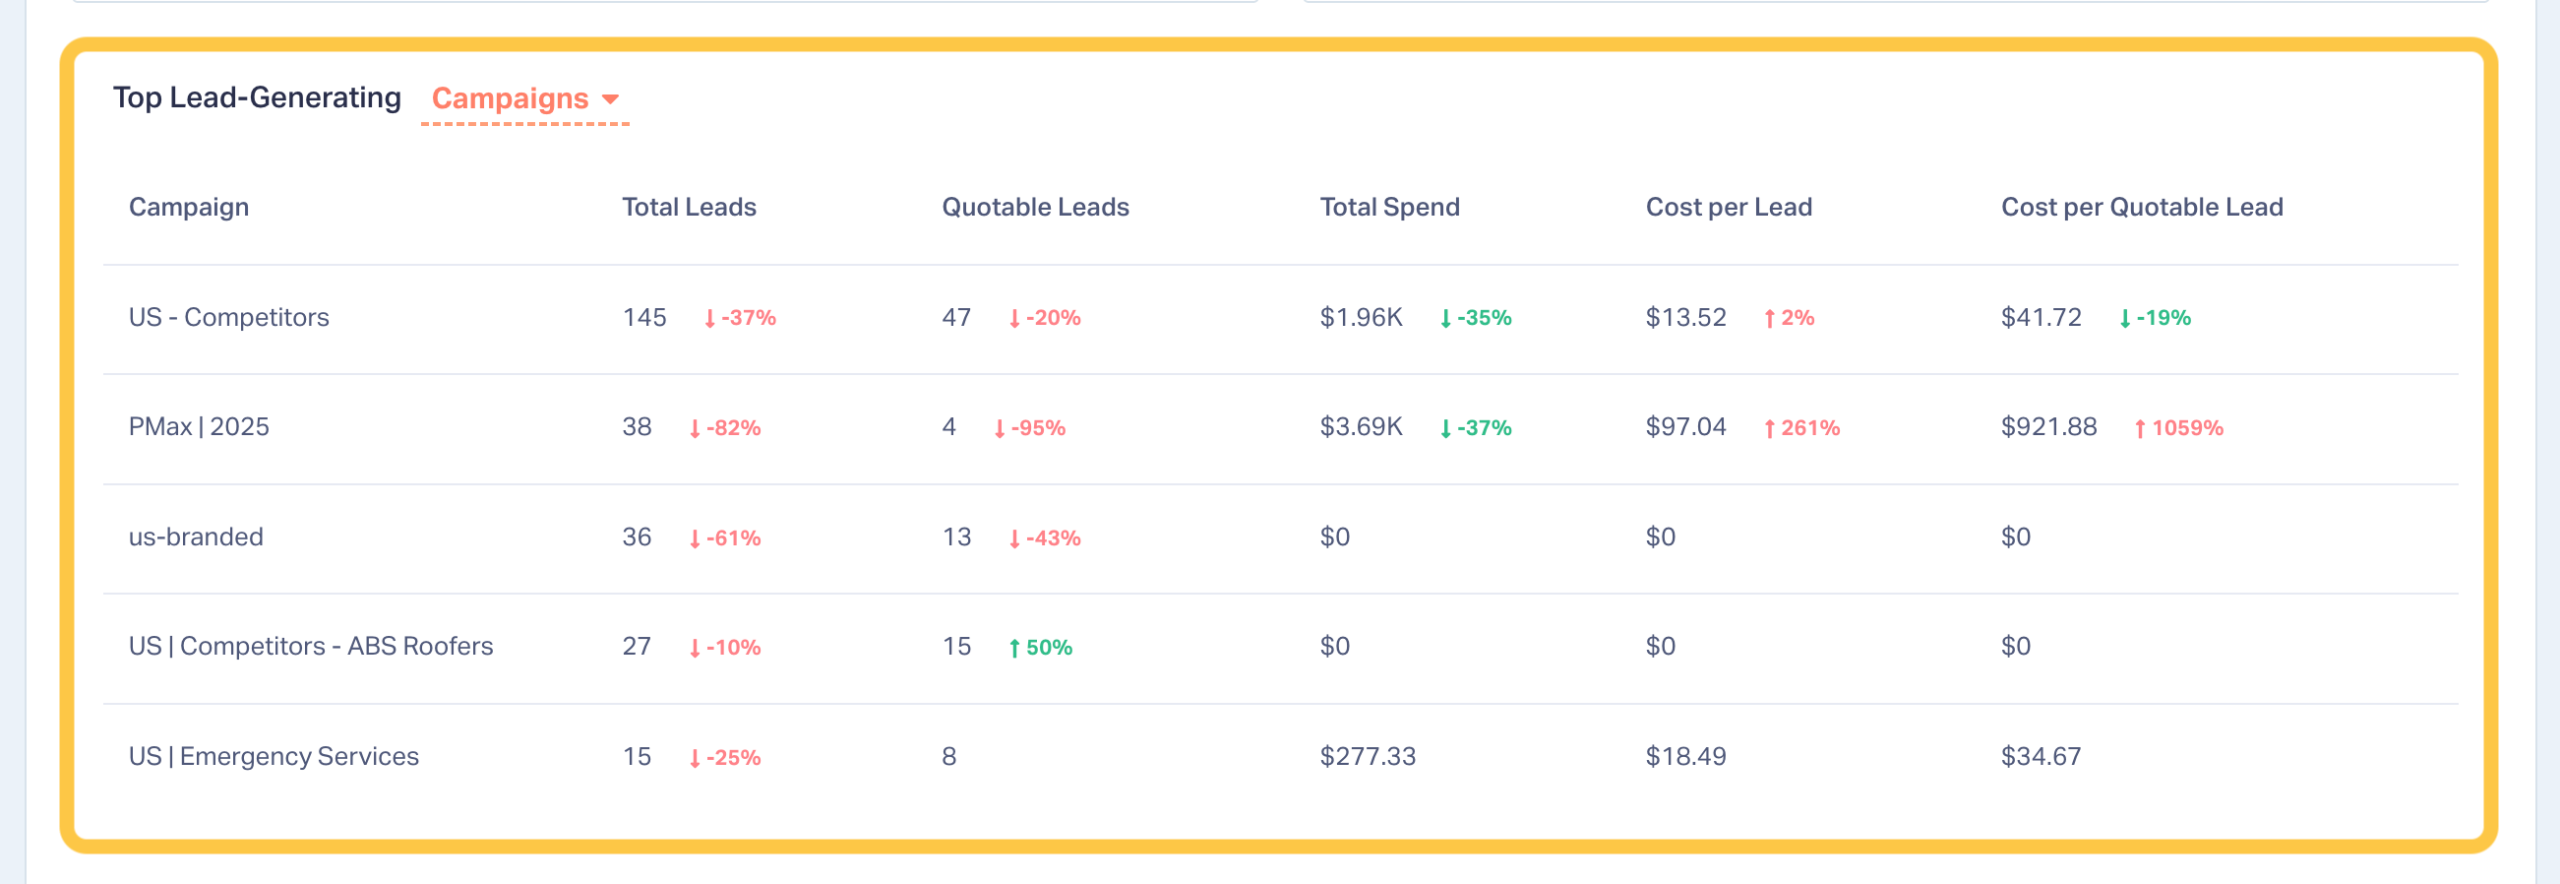
Top Lead-Generating Campaigns, Keywords, or Landing Pages
Device Usage
Hourly & Daily Distribution
How Agencies Use the Google Ads Report
Here are additional ways agencies put the Google Ads Report to work:
- Shift budget to high-ROAS campaigns and profitable niches
- Eliminate wasted spend from low-value keywords
- Improve conversion paths by device or landing page
- Identify dayparting opportunities for faster lead responses
- Prove revenue outcomes in client meetings with confidence
This is the clarity agencies need to optimize faster and defend budgets with data that actually holds up.
Getting Started (30 Seconds)
Accessing the Google Ads Report is simple.
- Connect your Google Ads account to WhatConverts
- Open Reports → Google Ads Report
- Add quote or sales values in Lead Manager to unlock revenue-based insights
Once your lead values are in place, every section in the report lights up automatically.
Turn Google Ads Activity Into Revenue Clarity
Clicks, impressions, and CPC only show activity. This report shows impact — the campaigns, keywords, and pages that actually drive revenue.
For agencies, that means stronger reporting, smarter optimization, and bulletproof conversations with clients.
Ready to see which ads really pay off?
Book a 20-minute demo or start your 14-day free trial now!
Get a FREE presentation of WhatConverts
One of our marketing experts will give you a full presentation of how WhatConverts can help you grow your business.
Schedule a Demo
Grow your business with WhatConverts


