


Marketing performance rarely fits inside a 30-day window. Seasonality, year-over-year growth, and the full life of a campaign all play out over months, and the reports you use to measure them should be able to keep up.
Your favorite Marketing Reports in WhatConverts now let you run reports across a full year and compare one period against another, so you can see long-term trends and prove sustained results in a single view. Even with twelve months of data in play, reports load just as fast as they always have.
Here's a quick snapshot of what's new:
- Year-long date ranges: Build reports across up to a full year, well past the previous 30-day and monthly limits
- Period-over-period comparison: Compare any extended range to the previous equivalent period, like the last 12 months against the 12 months before
- Same fast load times: Pulling a full year of data is as quick as pulling a single month, with no added wait
- A simpler date picker: Choosing and comparing specific periods now takes fewer clicks
Let's take a closer look at what changed.
Note: Not a WhatConverts user yet? Start your free 14-day trial of WhatConverts today or book a demo with a product expert to see how we help prove and grow your ROI.
Why This Matters
Reports are most useful when the time frame matches the question you're trying to answer. A 30-day view works for a quick performance check, but annual planning, end-of-year reviews, and long sales cycles all call for a wider lens.
With longer date ranges and built-in comparisons, you can now:
- Measure performance across a full year in one report
- Compare this year to last year to confirm real growth
- Spot seasonal patterns that shorter windows leave out
- Move between annual, quarterly, and monthly views without rebuilding anything
These updates make Marketing Reports more useful for the conversations that happen over months and quarters, not just the last few weeks.
Related Reading: Marketing Spend + 6 New Reports
What's New in Marketing Reports
Year-Long Date Ranges
What it does
Lets you generate Marketing Reports across a date range of up to a full year, rather than capping at a 30-day or monthly period.
How it works
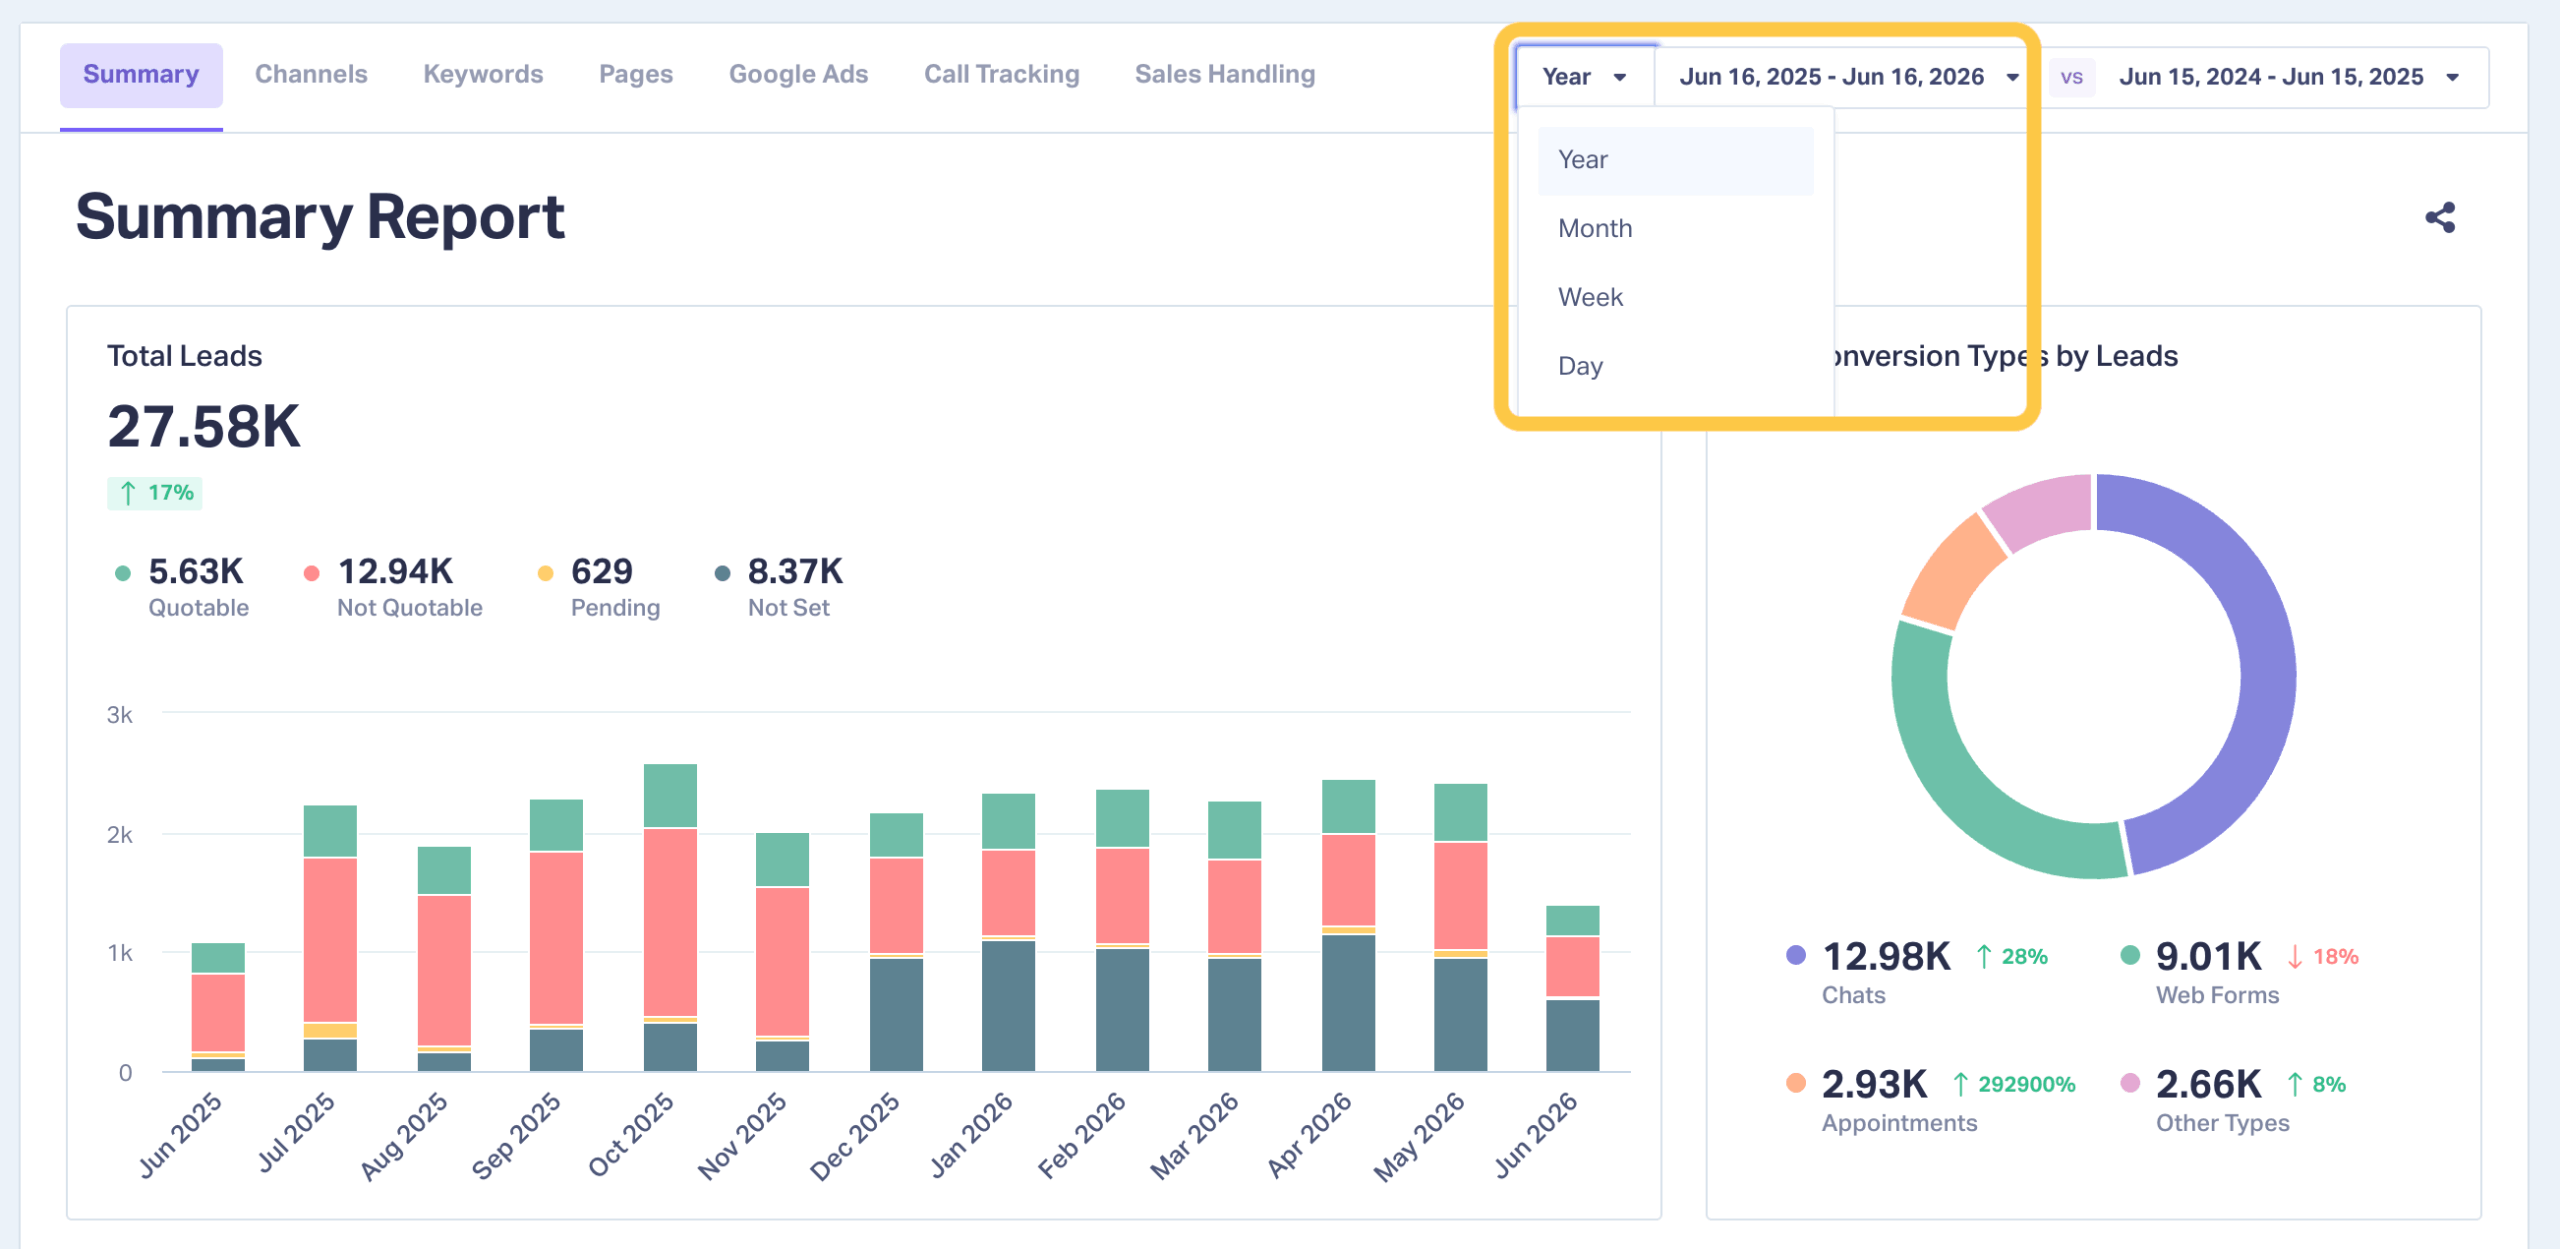
When you set the report period, you can now choose an extended range such as the last 12 months. The report pulls every lead in that window and breaks it down by your marketing sources, the same way it does for shorter periods.
Why it matters
Annual planning and client reviews depend on long-range data. A full-year view surfaces seasonal swings, long sales cycles, and growth trends that shorter windows leave out, which makes your reporting far more useful for big-picture decisions.
Period-Over-Period Comparison
What it does
Lets you compare an extended date range against the previous equivalent period.
How it works
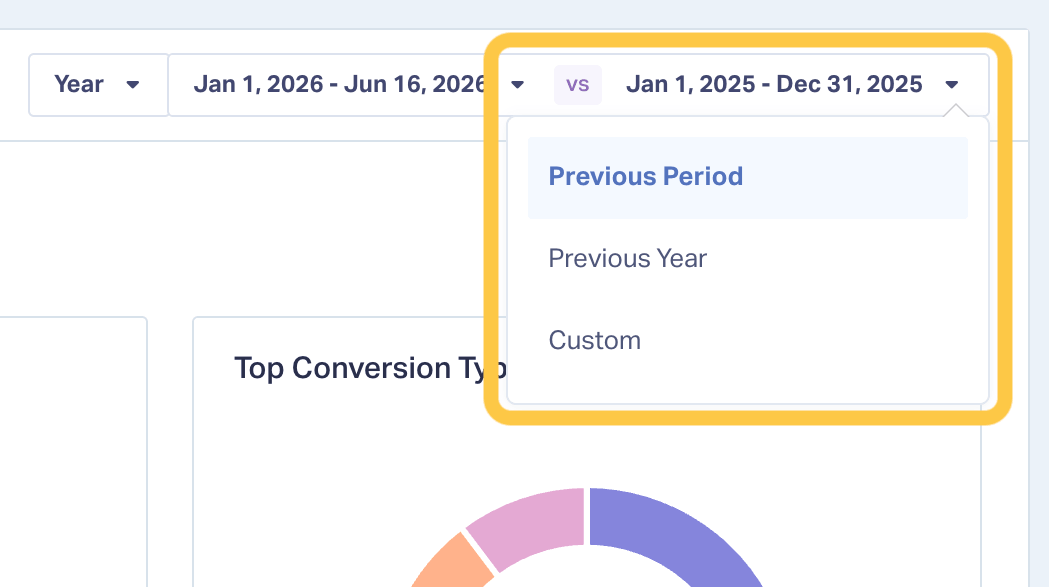
Choose your reporting window, then compare it to the period immediately before it. If you select the last 12 months, the report lines it up against the 12 months prior. The same approach works for shorter ranges, like one month against the previous month.
Why it matters
Year-over-year comparison is how you tell real growth apart from short-term swings. Seeing both periods together makes it easy to show whether performance is trending up, where the gains are coming from, and how this year stacks up against the last.
Fast Load Times on Year-Long Reports
What it does
Keeps report generation quick even when the selected range covers a full year.
How it works
Pulling one month or twelve takes the same time to collect and display. Larger ranges no longer mean longer waits.
Why it matters
Longer date ranges are only useful if you can actually work with them. Fast performance lets you move between annual, quarterly, and monthly views without losing momentum during analysis or a live client call.
A Simpler Date Selection Experience
What it does
Makes choosing and comparing reporting periods faster and more intuitive.
How it works
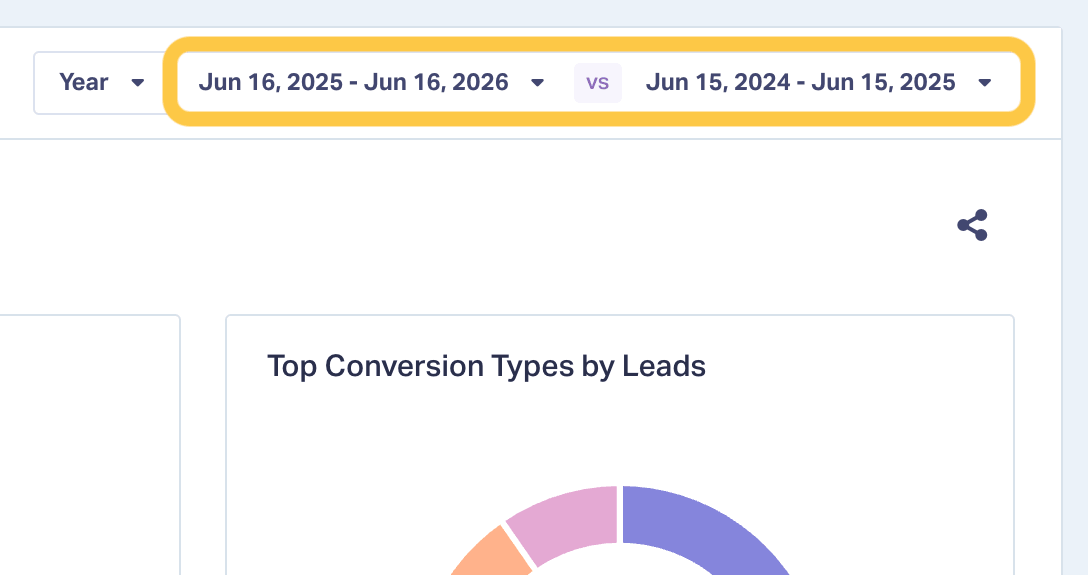
The updated date picker streamlines selecting a specific period, such as last month, and lining it up against another period for comparison. Fewer steps, clearer controls.
Why it matters
Building reports should be quick. A cleaner selection flow gets you to the insights sooner and reduces friction when you put reports together on a regular basis.
Real-World Example
Imagine you're preparing an annual performance review for a client.
Before, you were limited to 30-day snapshots, so covering a full year meant exporting twelve separate reports and stitching them together by hand.
Now you select the last 12 months, compare it to the previous 12 months, and see the whole year in one report. You can point to seasonal peaks, show year-over-year lead growth, and explain exactly where performance improved. The report loads in seconds, so you can adjust the view live in the meeting if the client asks a follow-up question.
How to Get Started
[Screenshot: navigating to Reports and opening the date range selector]
- Log in to WhatConverts
- Go to Reports
- Open the report you want to view
- Set your date range to an extended period, such as the last 12 months
- Turn on comparison to line it up against the previous period
- Review your results, then export or share as needed
Once your range is set, the report updates with the full period and its comparison.
Tips & Best Practices
- Use the 12-month view for annual planning and end-of-year client reviews
- Compare year-over-year to tell seasonal patterns apart from genuine growth
- Switch between monthly, quarterly, and annual ranges to check trends at different zoom levels
- Take advantage of the fast load times to explore comparisons live during client calls
What's Next
We're continuing to expand how Marketing Reports help you analyze performance over time. Expect more flexibility in how you select, compare, and visualize date ranges in future updates.
If you're a current user, log in to your account to try the new date range options in your reports.
Not a current user and want to see how Marketing Reports fit into your workflow?
Start your free 14-day trial of WhatConverts today or book a demo with a product expert to see how we help prove and grow your ROI.
Get a FREE presentation of WhatConverts
One of our marketing experts will give you a full presentation of how WhatConverts can help you grow your business.
Schedule a Demo
Grow your business with WhatConverts


