

A slow market and a broken campaign produce the exact same dashboard. Two completely different problems, two completely different fixes, and no way to tell which one you're dealing with.
Leadership sees fewer leads, higher CPL, and conversion rate drops and assumes something is wrong with the campaign. Agencies scramble to "fix" it with new creative, new bids, and new landing pages.
But often, it’s just a market fluctuation.
The diagnostic that allows you to tell the two apart isn't volume, it’s lead quality. And most agencies don't have quality data broken out by source, so they end up making the wrong call.
This article shows how to tell the difference fast, before you spend a month optimizing a campaign that just needed to ride out a soft quarter.
Note: Not a WhatConverts user yet? Start your free 14-day trial of WhatConverts today or book a demo with a product expert to see how we help prove and grow your ROI.
Why the Two Scenarios Look Identical
Volume metrics can't distinguish between a market that contracted and a campaign that stopped working. Both produce:
- A drop in lead count
- A rise in cost per lead
- A dip in conversion rate
That's because volume metrics measure how many people responded, but not who they were or what they were worth.
When demand softens, fewer people are in-market. The campaign still reaches the right audience; there's just fewer people in that audience for the campaign to reach. The leads that come through are still serious buyers with real budgets.
When a campaign genuinely breaks, what happens is very different. Targeting drifts, creative goes stale, or the offer stops landing. The campaign starts pulling in time-wasters and wrong-fit prospects.
Same surface metrics, but a completely different underlying problem with a completely different fix.
Here's a side-by-side of what you'd actually see in each scenario. Run through the left column, check what's true in your own data, and the diagnosis comes into focus fast.
| What to check | If it's a slow market: | If the campaign is broken: |
| Competitor activity | Competitors are reporting similar volume drops | Competitors look unaffected; you've lost ground to them |
| Category demand (Google Trends) | Search interest is down industry-wide | Category demand is stable, but your impression share dropped |
| Sales team feedback | Conversations feel normal; deals are just slower to close | Sales is complaining about junk leads and time wasted on bad fits |
| Lead mix (geography, demographics) | Looks roughly the same as before | Unusual shifts: new regions, new demographics, wrong audience |
| Search terms report | Mostly relevant queries, just fewer of them | Irrelevant or off-topic queries pulling clicks |
| Qualification rate | Holding steady or rising | Slipping |
| Average lead value | Holding steady or rising | Falling |
| Won deal size | Matching historical averages | Shrinking |
The Wrong Call Costs Money Either Way
Misdiagnose a slow market as a broken campaign, and you'll burn weeks rebuilding something that wasn't broken (and likely make it worse). New creative tested against soft demand will look like it's failing too, so you'll change it again and again.
Misdiagnose a broken campaign as a slow market and you'll keep spending on a system that's slowly degrading. By the time volume drops far enough to force action, you've wasted an entire quarter of budget.
Either way, the client sees results slip. And you can't explain why with confidence, because the data you have can't actually answer the question.
The Diagnostic: Lead Quality by Source
Here's what tells you what's really going on.
In a slow market, lead quality holds steady or rises. Volume drops, but qualification rate stays flat. Average lead value stays flat or climbs, because in a tighter market, casual shoppers drop out first and serious buyers remain.
In a failing campaign, lead quality degrades alongside volume. Qualification rate slips. Average lead value falls. You're getting fewer leads and the ones you get are worse.
That single comparison tells you which scenario you're in. The catch: you need qualification status and lead value tied to every lead, broken out by source and campaign. Most agencies are still working off conversion counts and CPL.
So when leadership asks what's wrong, they're guessing.
How WhatConverts Surfaces the Difference
WhatConverts captures every call, form, and chat with full source and campaign attribution. Then it lets you tag leads as qualified or unqualified and assign quote or sales values to each one.
That gives you the two metrics that actually matter when volume drops:
- Qualification rate by source. What percentage of leads from this campaign are real prospects? Is that number stable, or has it slipped?
- Average lead value by source. What's a lead from this campaign actually worth? Is the dollar value holding, or shrinking?
Pull those reports next to the volume drop and the picture clears up fast.
If qualification rate and lead value held steady while volume fell, the market got slower. Hold the line. If qualification rate and lead value dropped alongside volume, something inside the campaign needs work. Investigate.
You stop guessing. You start diagnosing.
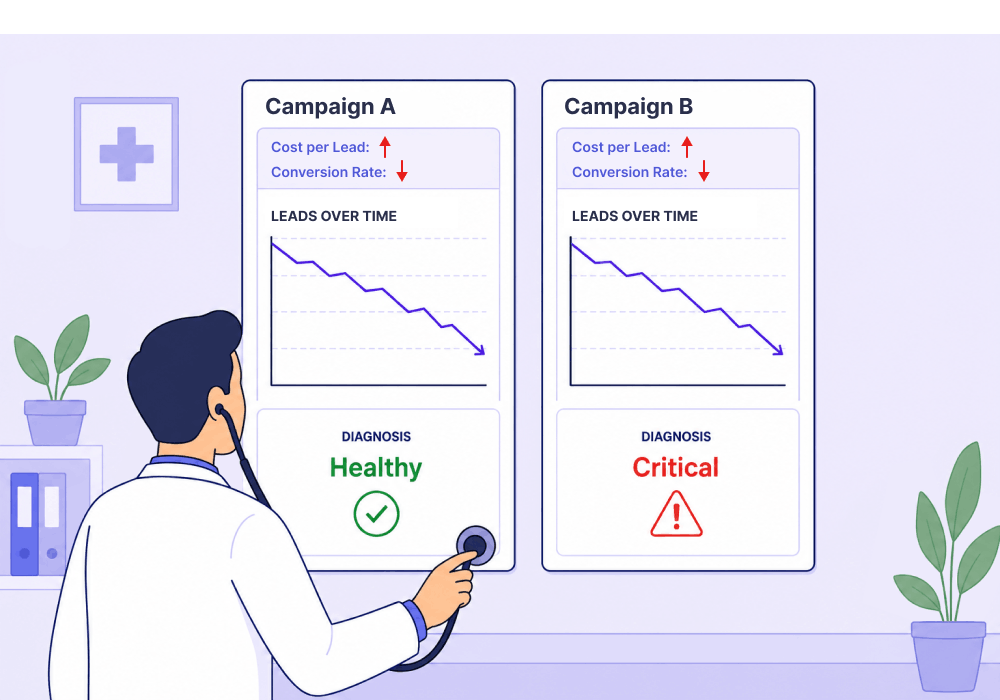
What This Looks Like in Practice
Picture two campaigns at the same agency. Both show the same Q3 drop.
Campaign A:
| Q2 | Q3 | |
| Leads | 120 | 78 |
| CPL | $85 | $130 |
| Conversion rate | 4.2% | 3.4% |
Campaign B:
| Q2 | Q3 | |
| Leads | 140 | 92 |
| CPL | $90 | $138 |
| Conversion rate | 4.5% | 3.6% |
Identical story so far. Leadership sees both and says: cut spend or rebuild creative on both. Both look broken.
Now look at quality.
Campaign A:
| Q2 | Q3 | |
| Qualification rate | 38% | 41% |
| Avg. lead value | $4,200 | $4,400 |
Campaign B:
| Q2 | Q3 | |
| Qualification rate | 35% | 14% |
| Avg. lead value | $3,900 | $1,650 |
Now it’s clear that you’re looking at two completely different problems.
Campaign A is riding out a slow market. Fewer leads, but the leads coming through are more qualified and worth more. Casual shoppers dropped out; serious buyers stayed. The right move is to hold spend, protect the position, and wait for demand to return.
Campaign B is broken. Volume fell and quality collapsed. Qualification rate cut by more than half. Lead value down 58%. Something inside the campaign (targeting, creative, offer, landing page) is pulling in the wrong people. The right move is to investigate fast, before another month of spend goes out the door.
Without quality data by source, both campaigns get the same treatment. With it, the agency knows exactly where to spend their optimization hours and exactly what to tell the client.
Diagnose Before You Optimize
A volume drop is a question, not an answer. The question is: did the market shrink, or did this campaign stop working? The answer lives in lead quality.
Here's the unlock:
- Track every lead with source, campaign, and qualification status.
- Assign quote or sales value to each lead.
- Pull qualification rate and average lead value by source.
- Compare quality trends to volume trends: steady quality means market, declining quality means campaign.
- Optimize only what's actually broken.
Volume tells you something changed. Quality tells you what.
Ready to know whether your numbers are slipping because of the market or the campaign?
Start your free 14-day trial of WhatConverts today or book a demo with a product expert to see how we help prove and grow your ROI.
Get a FREE presentation of WhatConverts
One of our marketing experts will give you a full presentation of how WhatConverts can help you grow your business.
Schedule a Demo
Grow your business with WhatConverts


