


Proving ROI means connecting three numbers:
- What you spent
- Which leads came from that spend
- How much revenue those leads generated
Simple in theory. Nightmare in practice.
Ad spend lives in Google Ads. Lead data lives in your tracking platform. Revenue lives in your CRM. Getting those three numbers into the same place requires hours of spreadsheet work—exporting reports, matching data, fixing errors.
WhatConverts's Marketing Spend feature eliminates the spreadsheet entirely. Spend flows in automatically. Every lead connects to its source. Revenue ties back to the exact campaign that generated it.
Instant ROI calculations—without building a single formula.
Note: Not a WhatConverts user yet? Start your free 14-day trial today or book a demo with a product expert to see how we help prove and grow your ROI.
Why Manual ROI Calculations Fall Apart
Calculating ROI for a single campaign is easy math.
Spend $1,000. Get 20 leads. Close 4 sales worth $5,000. That's 5x ROI.
But real marketing doesn't run on one platform with one campaign.
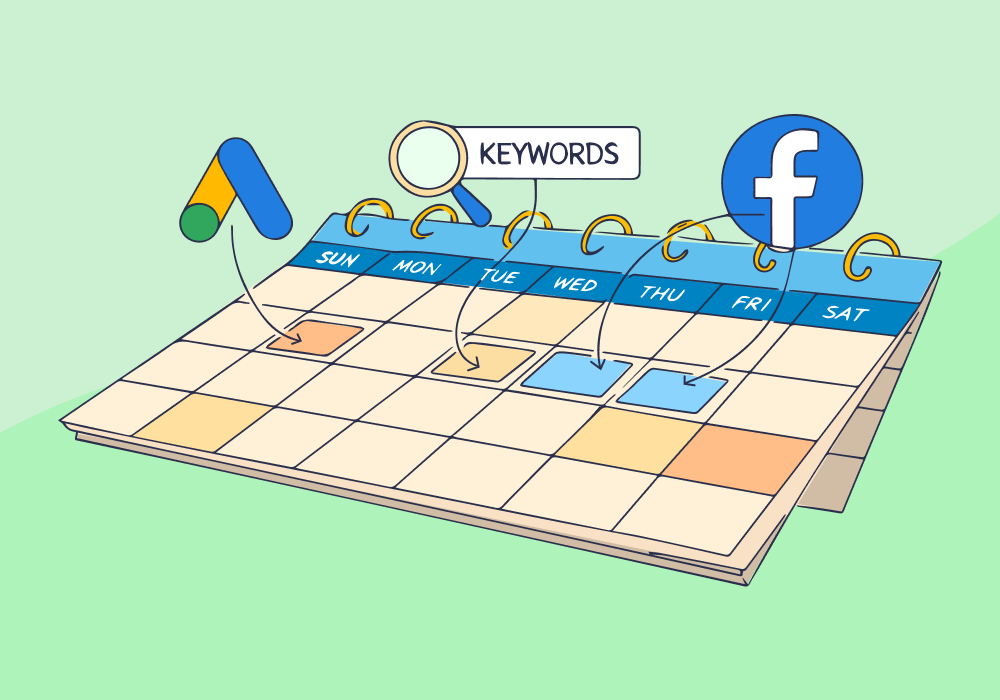
You're running Google Ads, Facebook Ads, Bing Ads. Maybe direct mail. Maybe SEO. Each platform tracks spend differently. Each reports conversions in its own format. None of them know what happens after someone becomes a lead.
The data lives in three separate places:
- Spend sits inside ad platforms
- Leads live in your tracking tool or CRM
- Revenue lives in your sales system
To calculate ROI, you export data from each system, import it into Excel, and try to match everything together using formulas and naming conventions that were never designed to align.
Worse, aggregate ROI hides the truth.
"Total spend: $12,000. Total revenue: $84,000. ROI: 7x."
That number feels reassuring, but it hides the truth. One keyword might generate 50 leads that become two customers. Another generates eight leads that become six customers. They both show up in your total, but they deserve completely different budget decisions.
What Changes When ROI Is Connected Automatically
True ROI visibility isn’t about faster math. It’s about seeing the relationship between spend, leads, and revenue without manually stitching it together.
When those pieces are connected automatically, three things become possible:
- Every dollar of spend is tied to a real business outcome
- Every lead carries context about where it came from
- Revenue flows back to the exact campaigns and keywords that produced it
Instead of asking, “Did Google Ads work?” you can answer, “Which parts of Google Ads actually drove profit?”
That shift from channels to specifics is where ROI becomes actionable.
Seeing ROI Where It Actually Lives
When spend, attribution, and revenue are unified, ROI stops being a monthly report and starts becoming a daily decision tool.
Rather than walking through every possible report, here are three examples that illustrate how automated ROI changes how marketers operate.
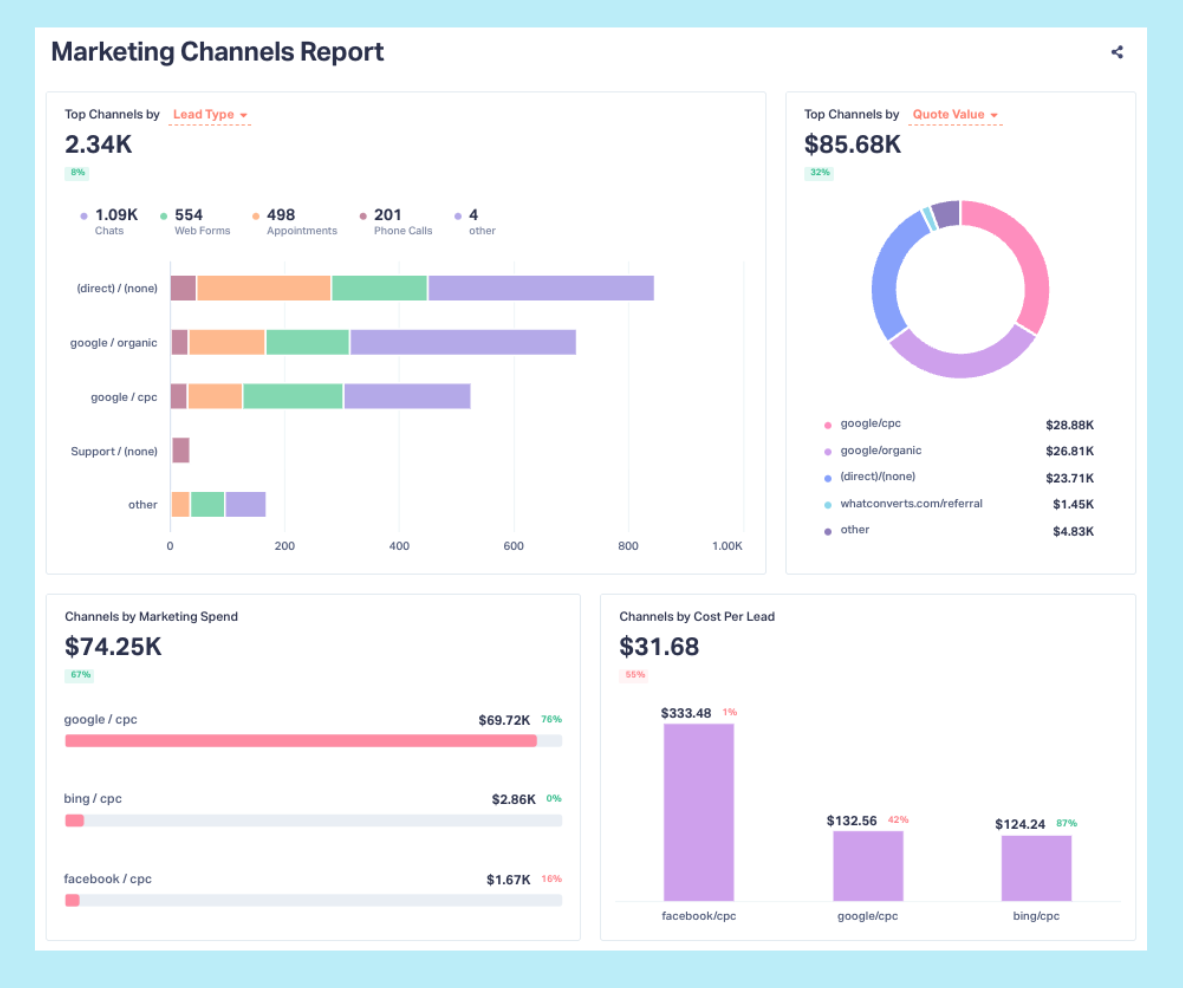
Compare Channels Based on Revenue, Not Lead Volume
When you can see spend, leads, and revenue side by side, channel performance often looks very different than expected.
A channel that generates fewer leads might produce significantly more revenue. Another that looks “cheap” on a cost-per-lead basis might quietly drain budget once sales outcomes are considered.
Instead of debating which channel should perform better, you can see which ones actually do—and adjust budget accordingly.
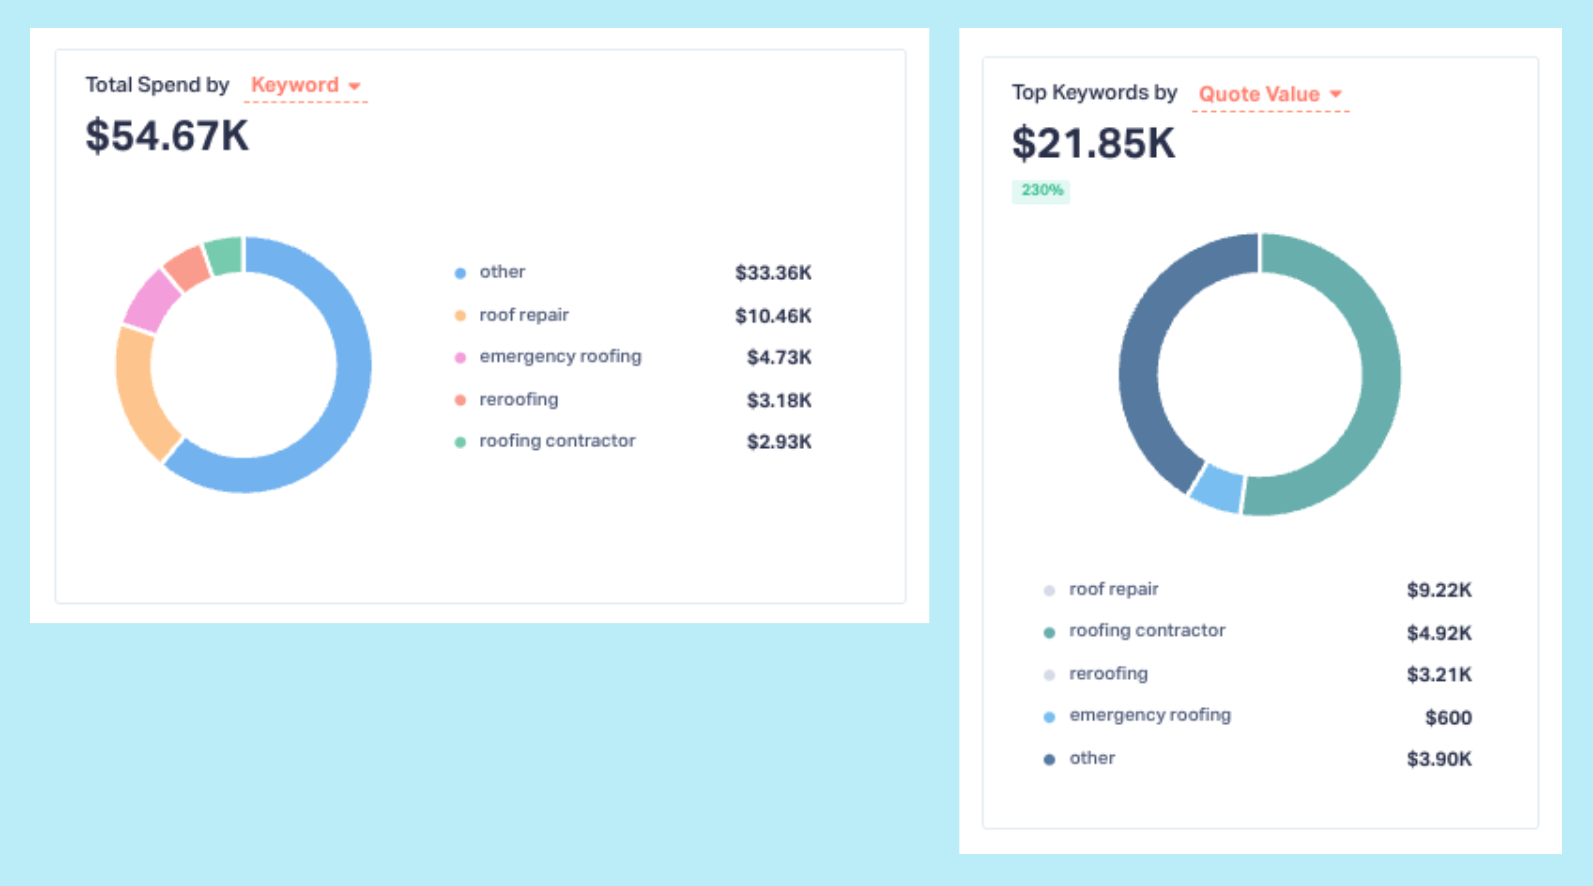
Identify the Keywords That Deserve More Budget
Keyword-level ROI visibility is where many spreadsheet workflows break entirely.
With connected data, you can see exactly how much was spent on a keyword, how many leads it generated, and how much revenue those leads produced.
That’s how you uncover patterns like:
- Low-volume keywords that drive high-value customers
- High-volume keywords that generate noise but little revenue
Armed with that insight, budget shifts stop being speculative. You fund what proves itself.
From Spreadsheet Reporting to Live ROI
The difference between spreadsheet ROI and automated ROI isn’t convenience. It’s timing.
Spreadsheets are backward-looking. They tell you what happened after the opportunity to act has passed.
Live ROI visibility works differently. As spend flows in, leads arrive, and revenue is recorded, performance signals update continuously. Profitable efforts surface faster. Inefficient ones are exposed sooner. Budget decisions improve in real time, not weeks later.
At that point, ROI stops being something you calculate and starts being something you operate with.
The Real Cost of Spreadsheet ROI
Spreadsheets don’t just cost time. They cost momentum.
They delay insight, hide specifics, and encourage averages when precision is required.
In a world where ad platforms optimize in real time, relying on manual ROI calculations means you’re always reacting to yesterday’s data.
When spend, leads, and revenue are connected automatically, ROI becomes a living system. You stop guessing which marketing works and start proving it—continuously.
That’s how ROI turns from a reporting exercise into a growth lever.
Curious what your true ROI looks like without the spreadsheet?
See how automated ROI tracking reveals what’s working—and what’s quietly wasting budget.
Start your free 14-day trial of WhatConverts today or book a demo with a product expert to see how we help prove and grow your ROI.
Get a FREE presentation of WhatConverts
One of our marketing experts will give you a full presentation of how WhatConverts can help you grow your business.
Schedule a Demo
Grow your business with WhatConverts


