


 Alex Thompson
You open the Lead Manager to answer one question for a client: which campaigns are bringing in leads worth chasing?
To get there, you filter. Click a chart, narrow the table, add a column. But the old layout made it hard to tell which filters were shaping the numbers in front of you, and it was easy to walk away with the wrong answer.
Not anymore. The redesigned Lead Manager puts your filters at the top of the page, right above the chart and table they control, and each new filter animates in as you apply it. Your views save as you work, and you can share them with your team. So when you decide where the budget goes, you know exactly what you're looking at.
TL;DR: What's New
- Filters at the top: Filters now sit right above the Lead Overview Chart and animate in when you apply them, so you always know what's shaping your numbers
- Autosaving views: Every change saves to the view you're in, with Undo and Redo, so the setup you build is there next time
- View menu: Duplicate, rename, share, or delete a view from its tab, so your whole team can work from the same setup
- Main benefit: Agencies get to their best leads faster, misread fewer reports, and make budget calls with confidence
Why This Matters
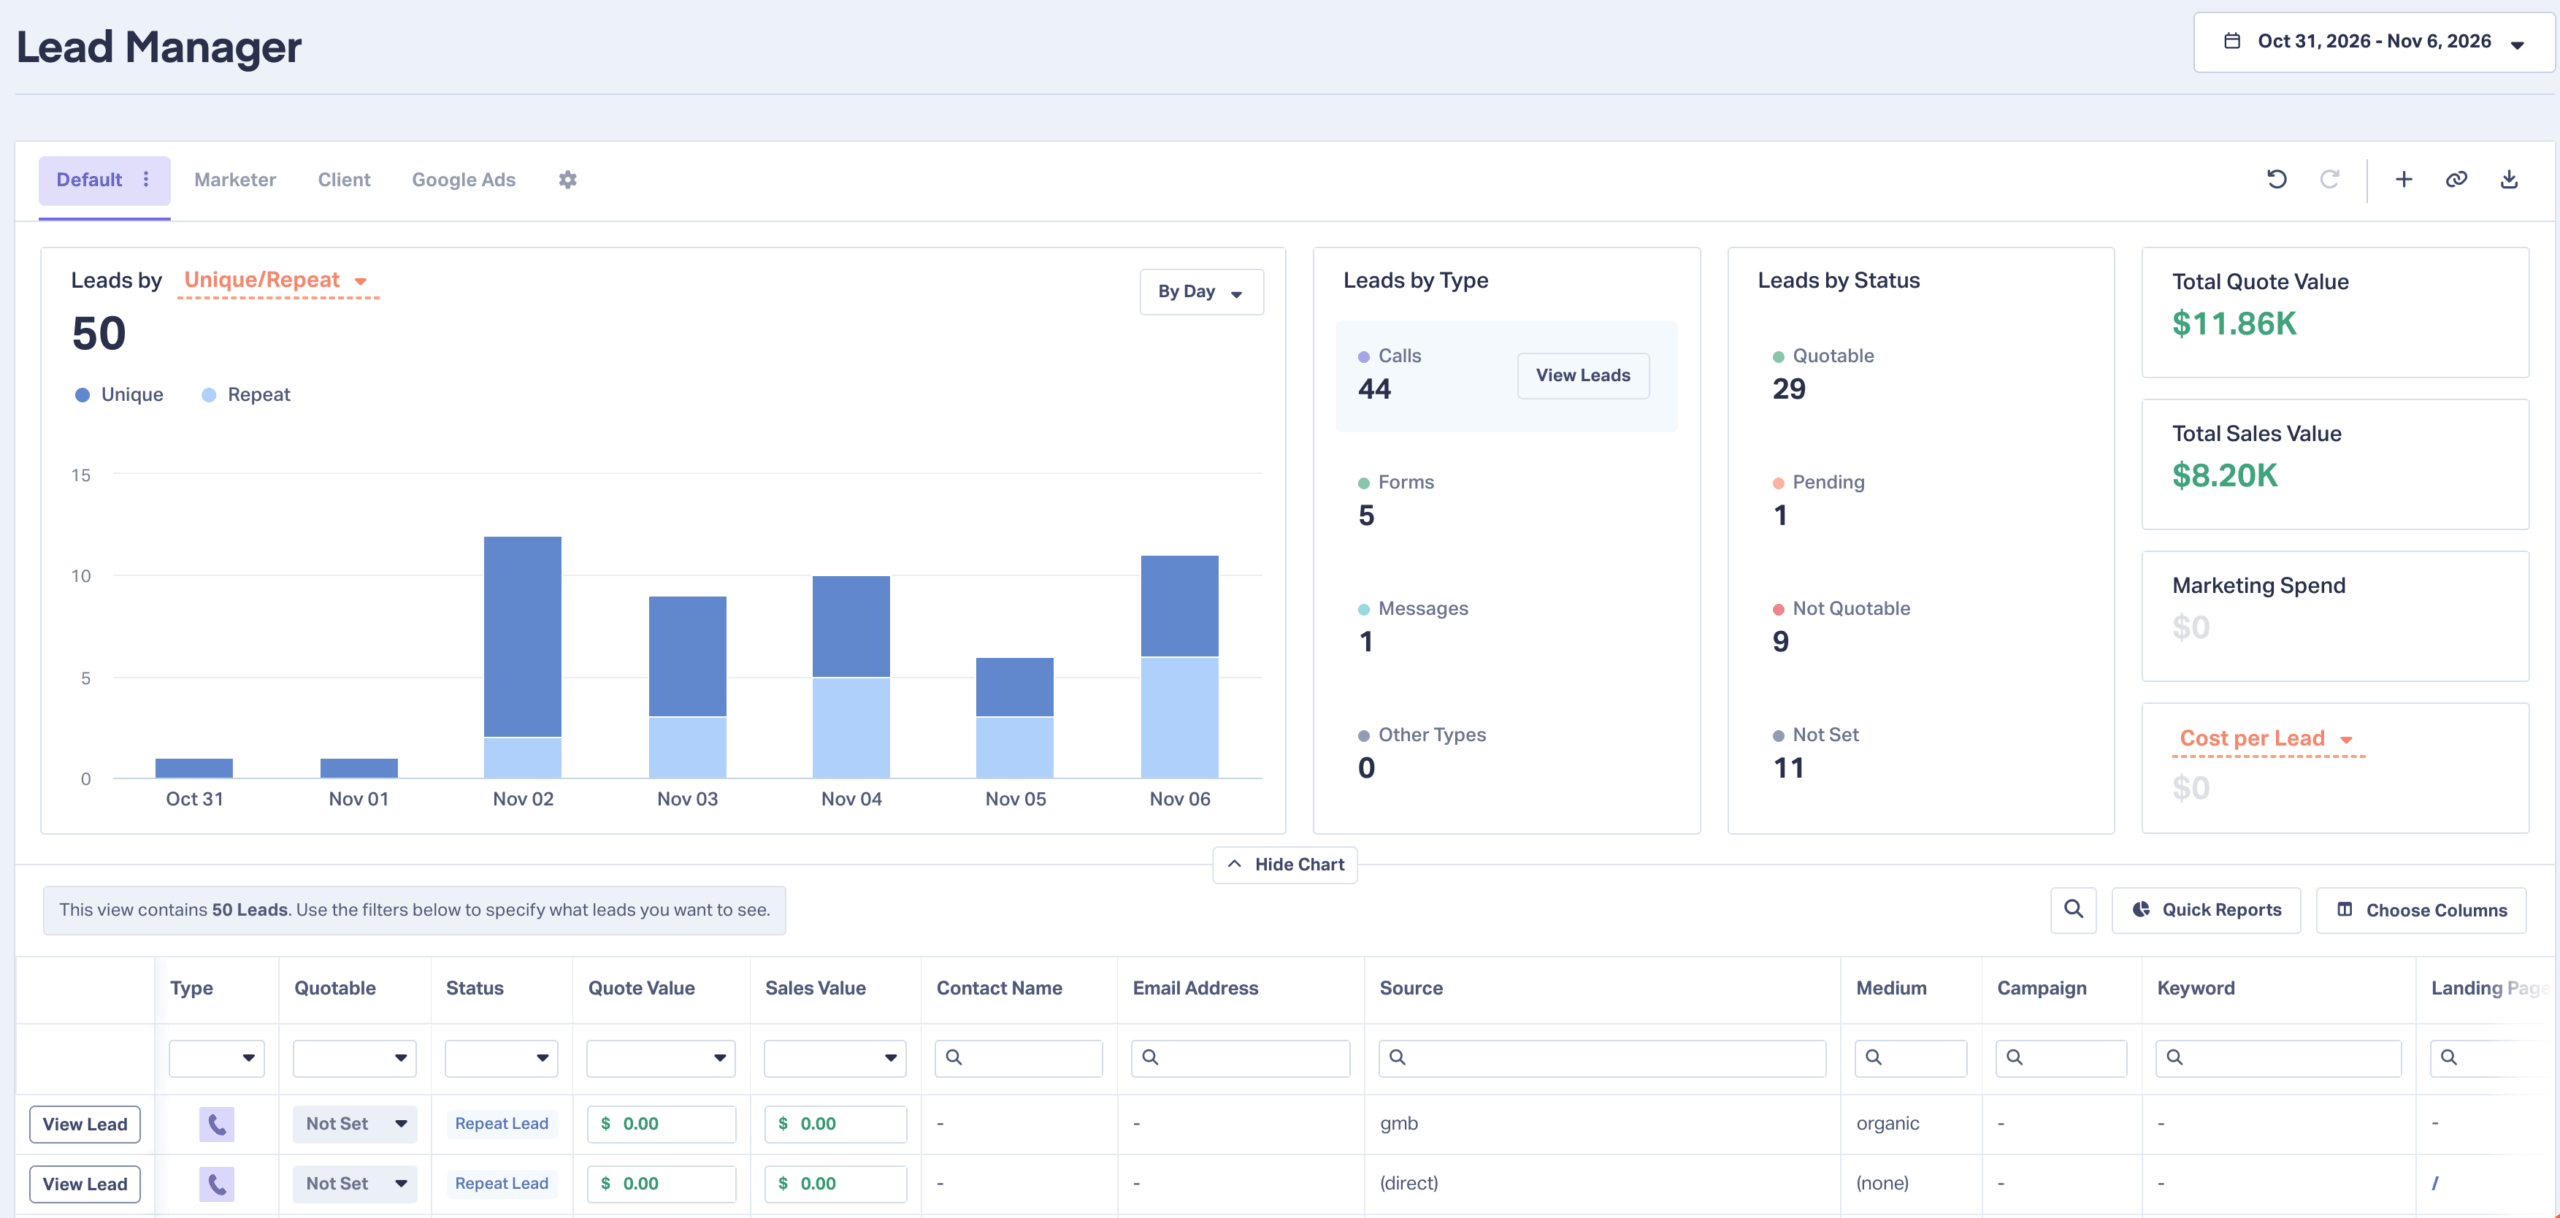
The Lead Manager is where you separate high-value leads from the noise and figure out which campaigns, sources, and channels are working. All of that depends on knowing which filters are shaping the numbers in front of you.
Before this update, it was easy to lose track. Click a chart to view its leads, and the table filtered with little sign that anything changed. Filter the table, and the charts changed too. Make a few changes to a view, click away before saving, and they were gone.
Read a filtered view as the full picture, and a campaign that's driving good calls can end up paused.
The redesigned Lead Manager makes the connection obvious. Filters sit at the top, they apply to everything below them, and your work saves as you go. For your agency, that means:
- Faster answers. Fewer clicks and less scrolling between your filters and your results
- Fewer misreads. You see the moment a filter changes the view, before you draw conclusions from it
- Views you can count on. Your setup stays put, and duplicating a view protects the original
- The whole team can do the analysis. Share a view, and a new hire starts from the same setup as your most experienced account manager
What's New (Feature Breakdown)
Views You Can See
What it does
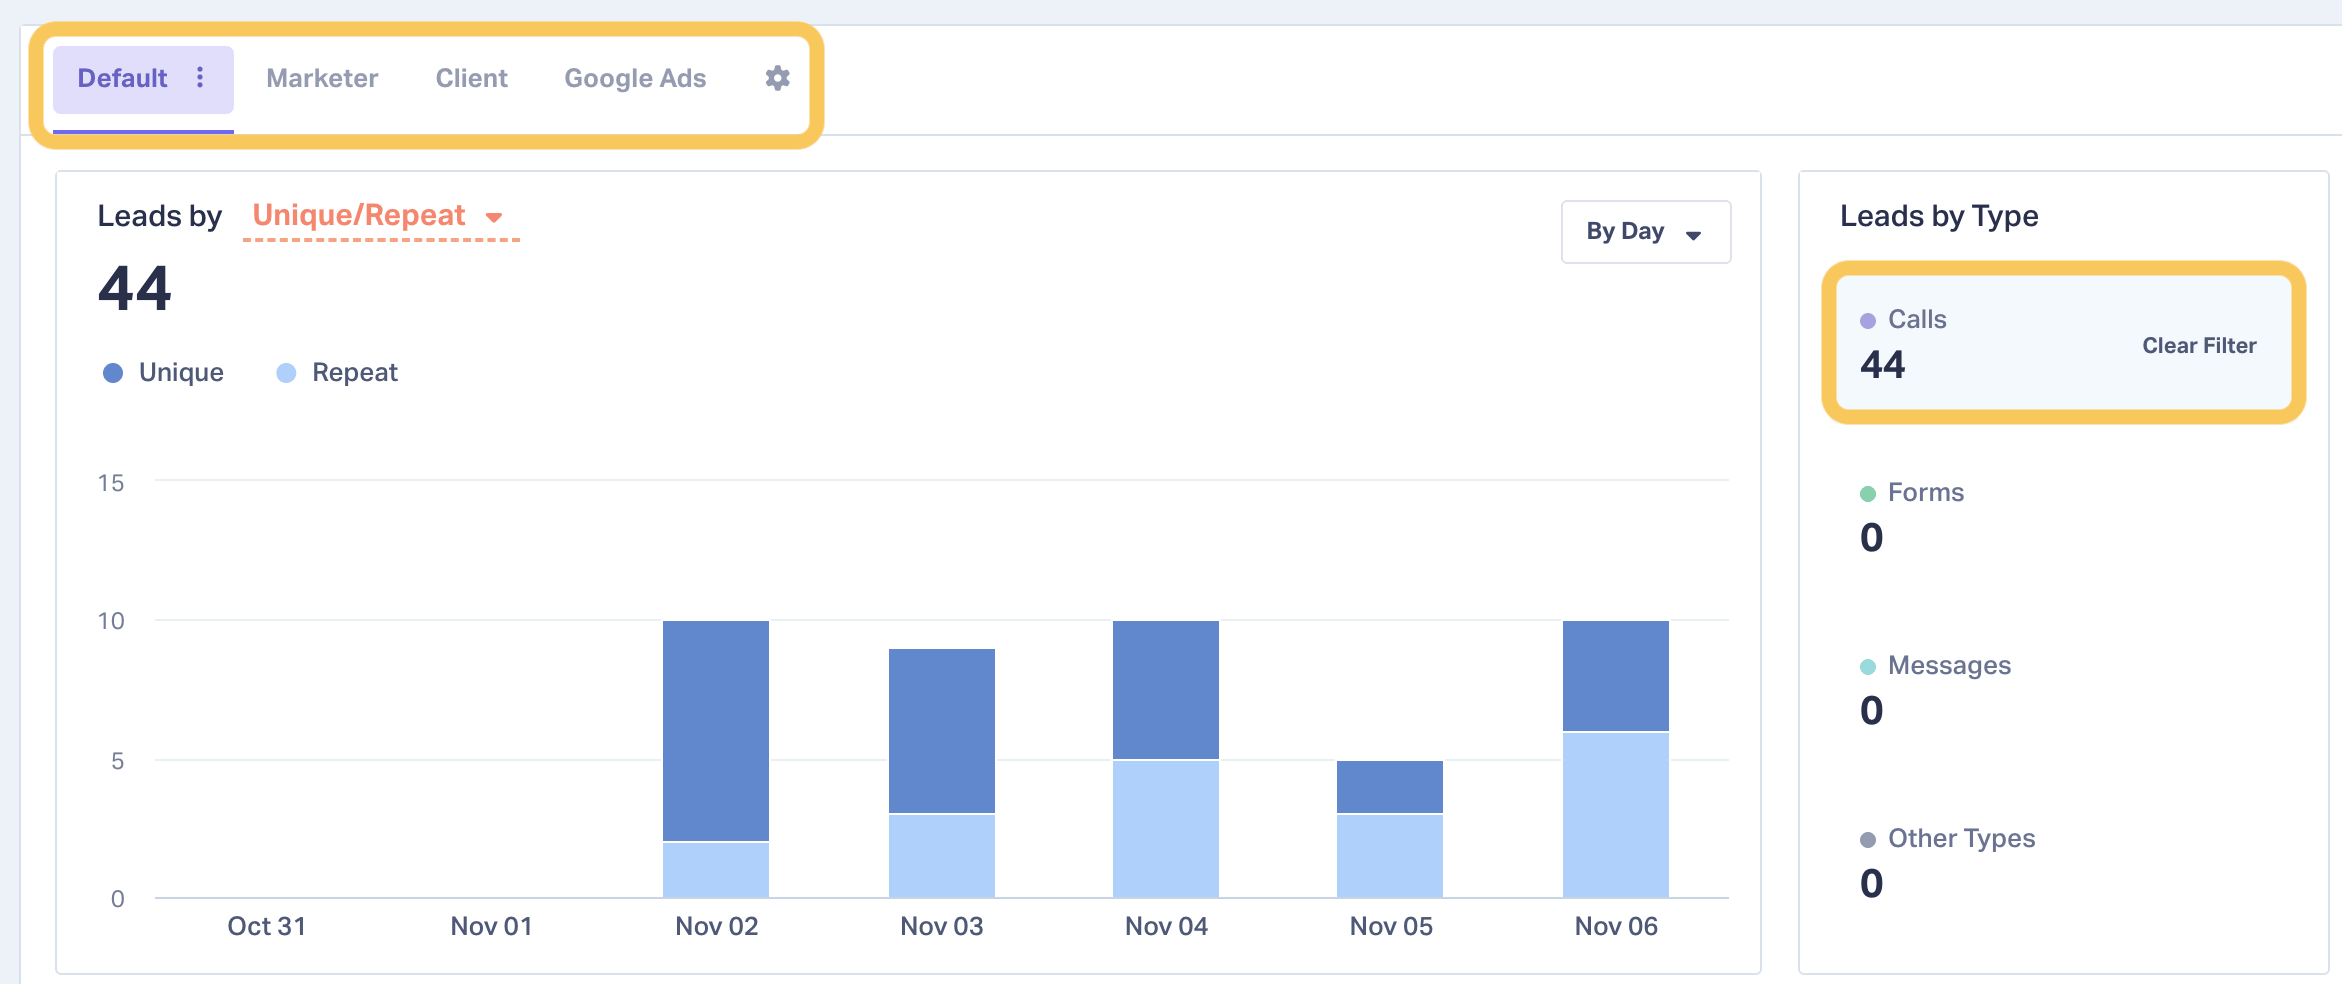
Puts your views right above the chart and table they control, so you always know what's shaping the numbers in front of you.
How it works
- View tabs and filters now sit at the top of the page, above the Lead Overview Chart, instead of between the chart and the table
- Every active view shows directly above the chart, so the filters, chart, and table read as one view
- Apply a filter from the chart or from a table column, and it animates in at the top. Even if you've scrolled down to the table, you'll see the change.
Key benefit
Catch a filter change the moment it happens, instead of 15 minutes into reading the wrong data.
Views That Save Themselves
What it does
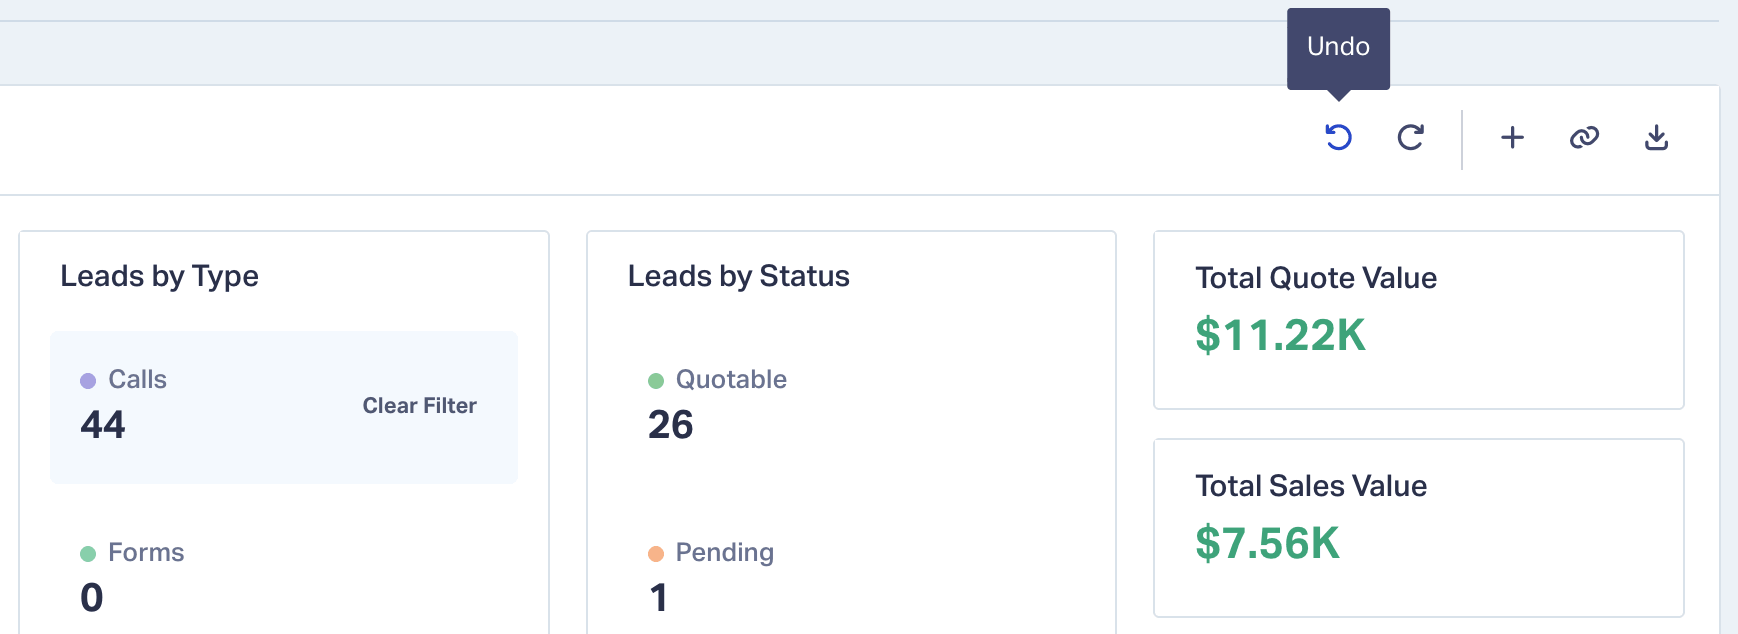
Saves every change to the view you're in, so the setup you build is the setup you come back to.
How it works
- Add, remove, or reorder columns, or apply a filter, and the change saves to your active view
- Views work like regular tabs. The tab you pick stays where it is and keeps its name while you work. No more jumping to Current View.
- Click Choose Columns, turn columns on or off, and close the window. There's no prompt to save.
- Made a change you didn't want? Use the Undo and Redo buttons in the toolbar.
Key benefit
Spend your time on the analysis instead of rebuilding columns and filters.
Duplicate and Share Views
What it does
Puts every view action in one menu on the view's tab, so a view one person builds can become the whole team's starting point.
How it works
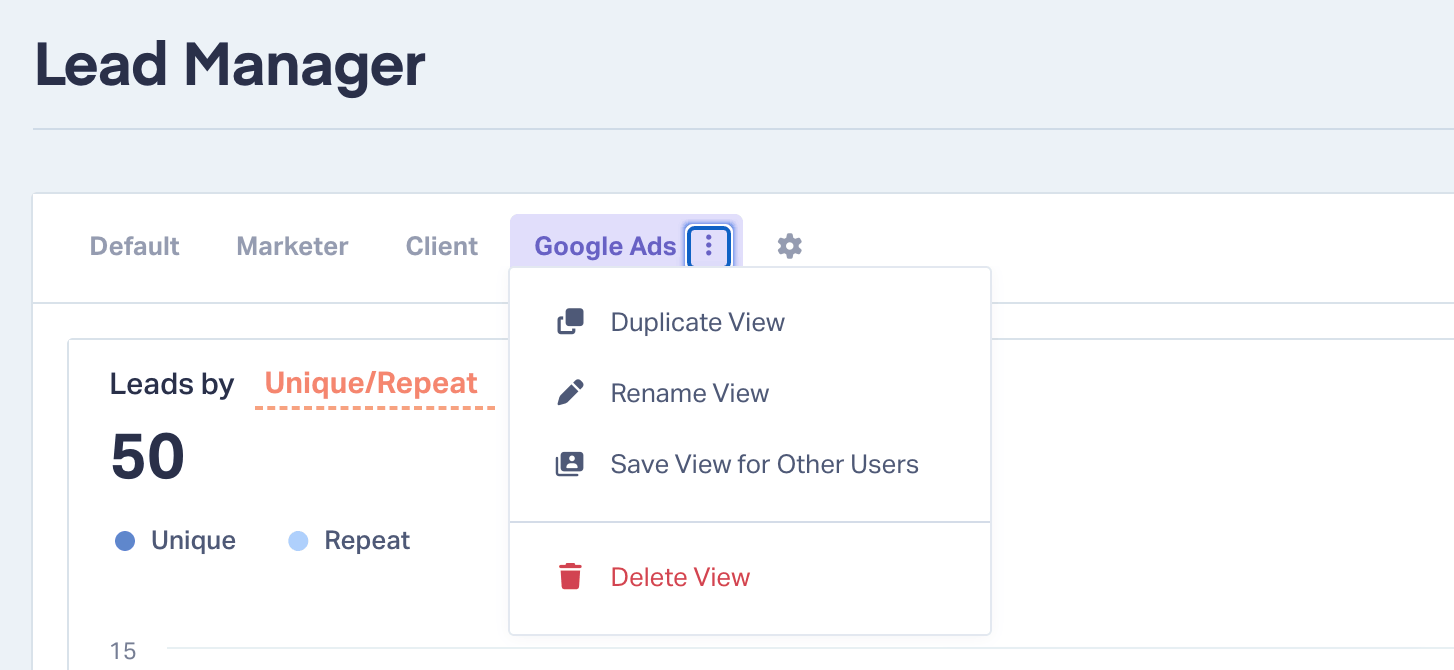
Click a view, then click the three-dot menu (⋮):
- Duplicate View. Makes a copy, like Google Ads (copy). Since views save as you work, duplicate one before you start experimenting. The original stays as it was.
- Rename View. Give the view a name your team will recognize, like "Client Reporting" or "Quotable Calls."
- Save View for Other Users. Enter each teammate's email address, confirm the view name, and click Save View. If you used to share views through Save as New View, this is where that option lives now.
- Delete View. Remove a view you don't need anymore.
Key benefit
Your best setup doesn't live only in your most experienced person's account. Anyone on the team can start from it.
New Leads by Channel Chart
What it does
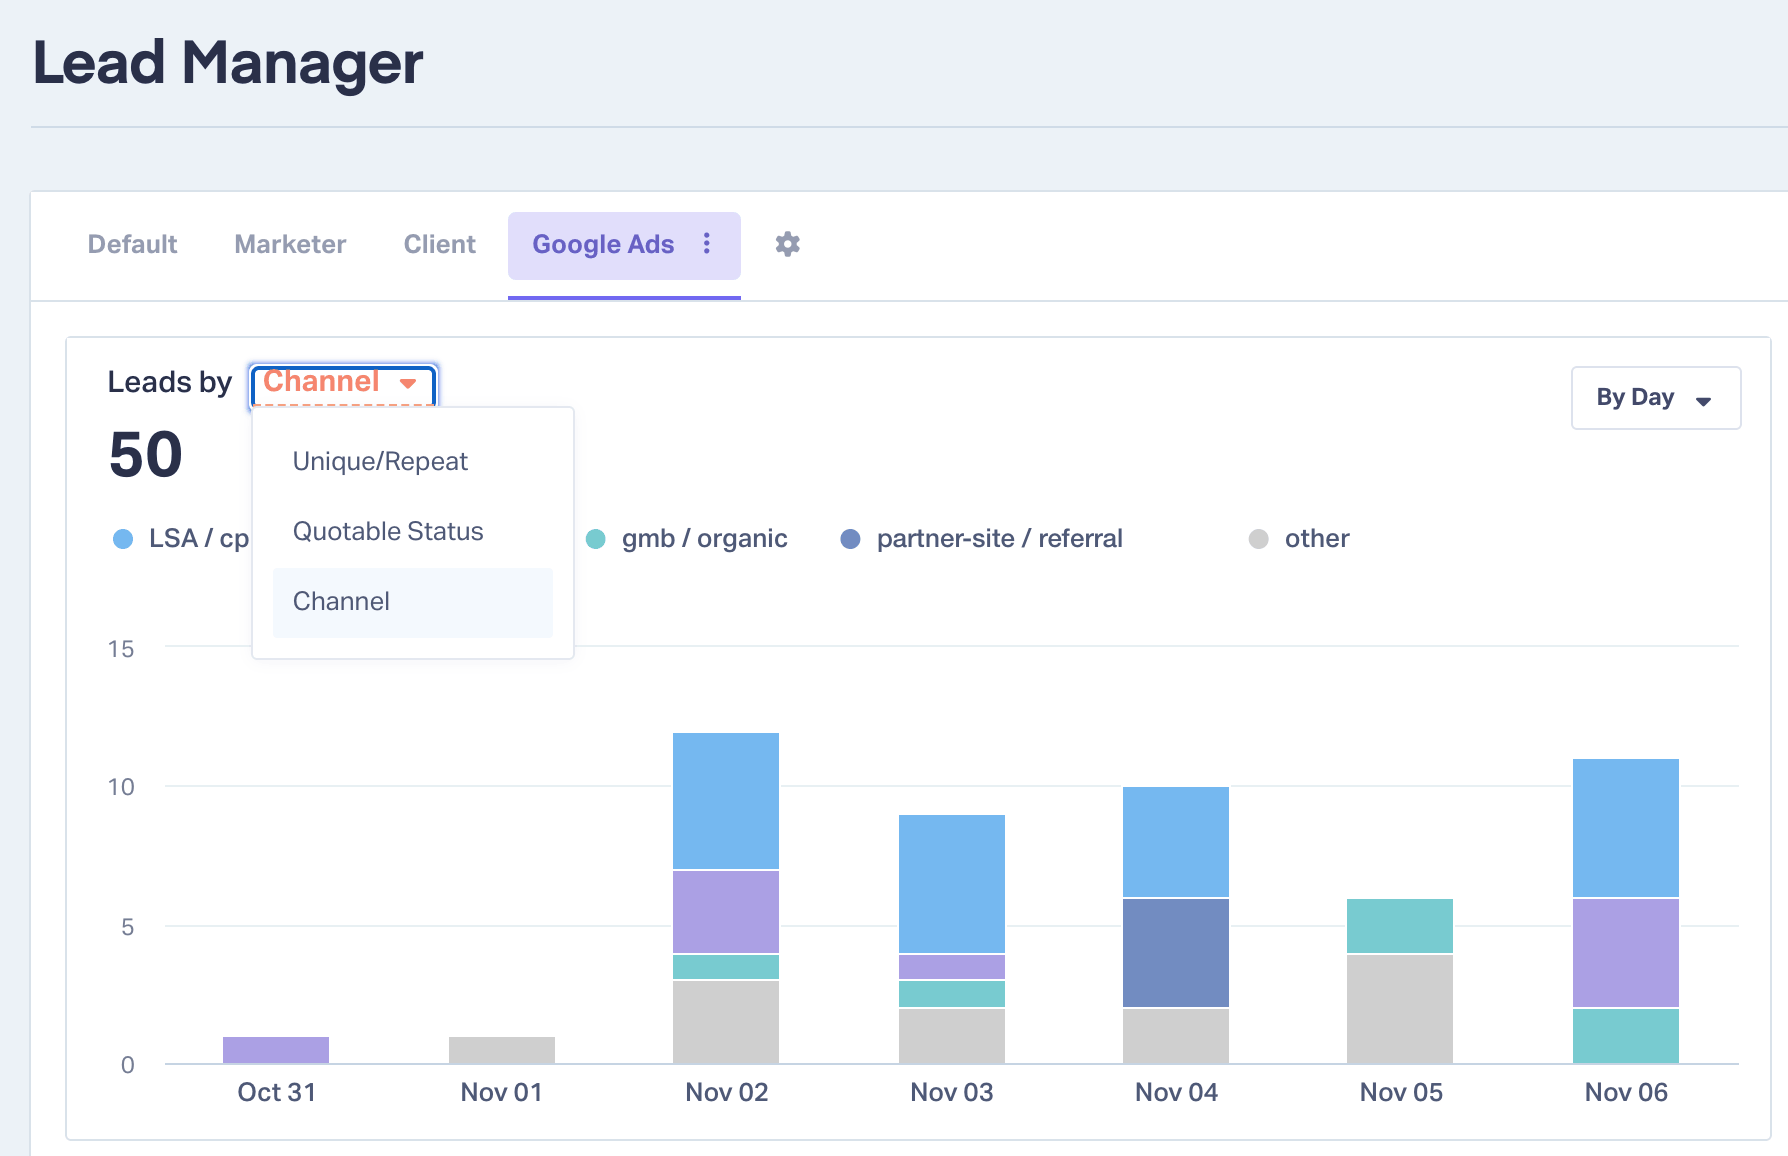
Adds a Leads by Channel view to the Lead Overview Chart.
How it works
The chart now has a Leads by Channel view that breaks your leads out by source and medium. It uses the same filters as the rest of the page.
Key benefit
See where your leads come from at a glance, filtered the same way as your table.
Real-World Example
Jen manages Google Ads for a home services client spending $12,000 a month. Her question is simple: which campaigns bring in calls worth quoting?
Before the update, she clicked Phone Calls on the chart and didn't notice the table had filtered. She spent 15 minutes reading call leads as if they were all leads, and almost recommended pausing a campaign that was actually driving good calls.
Now, the moment she clicks Phone Calls, a filter for it animates in at the top of the page, right above the chart. She knows exactly what she's looking at. She adds a filter for Quotable leads marked Yes or Pending.
Two campaigns are bringing in most of the quotable calls.
She moves about $4,000 a month toward those two and pauses the rest. Then she duplicates the view, renames it "Quotable Calls," and shares it with the account coordinator who builds the client's monthly report. Next month, the coordinator runs the same analysis without asking Jen how she set it up.
How to Get Started
- Log in to WhatConverts and open the Lead Manager
- Apply a filter from the chart or the table, and watch it appear at the top of the page
- Set up the columns and filters you need. Your changes save automatically.
- Click the three-dot menu (⋮) on the view's tab to duplicate it, rename it, or share it with your team
Lead Manager Views are available on all plans for Master Account Users.
Tips & Best Practices
- Check the filters above the chart before you share numbers with a client. If a filter is on, the numbers you're reporting cover only part of the account.
- Duplicate a view before you experiment. Your changes save as you go, so the original changes with them.
- Build one view for each question you answer often, like which campaigns drive quotable calls or how this month compares to last
- Share your best views with new team members so they can do the analysis from day one
Resources & Links
- What is the Lead Manager?
- What is the Lead Overview Chart?
- Create a Lead Manager View
- Manage Your Lead Manager Views
- Choose Lead Manager Columns
- Filter Leads in the Lead Manager
Conclusion
You can't make good calls about a client's marketing from a view you don't fully understand.
With the redesigned Lead Manager, you can always see which filters are shaping your numbers, your views stay the way you built them, and your whole team works from the same setup. You get to the leads that matter faster and make budget calls you can stand behind.
Log in now to try out the new Lead Manager
See It In Action: Book a Free Demo
Get a FREE presentation of WhatConverts
One of our marketing experts will give you a full presentation of how WhatConverts can help you grow your business.
Schedule a DemoGrow your business with WhatConverts


