Marketing Spend just got a major upgrade, making it easier than ever to track your ad budgets, measure ROI, and optimize campaigns.
In short: WhatConverts now automatically pulls in your spend data across ad platforms through the integrations. No more manual setup. No more guesswork.
If you’re already using Marketing Spend, we think you’re going to love the new interface. And if you aren’t, now’s the time to start! All you have to do is connect to your ad platform through the integrations—simple.
Note: Marketing Spend is only available on the Elite Plan. If you aren't on the Elite Plan, upgrading your account is a snap.
What You Can Do with the New Marketing Spend Feature?
Knowing how much you spend on each marketing channel is essential for understanding ROI.
With the updated Marketing Spend feature, you can:
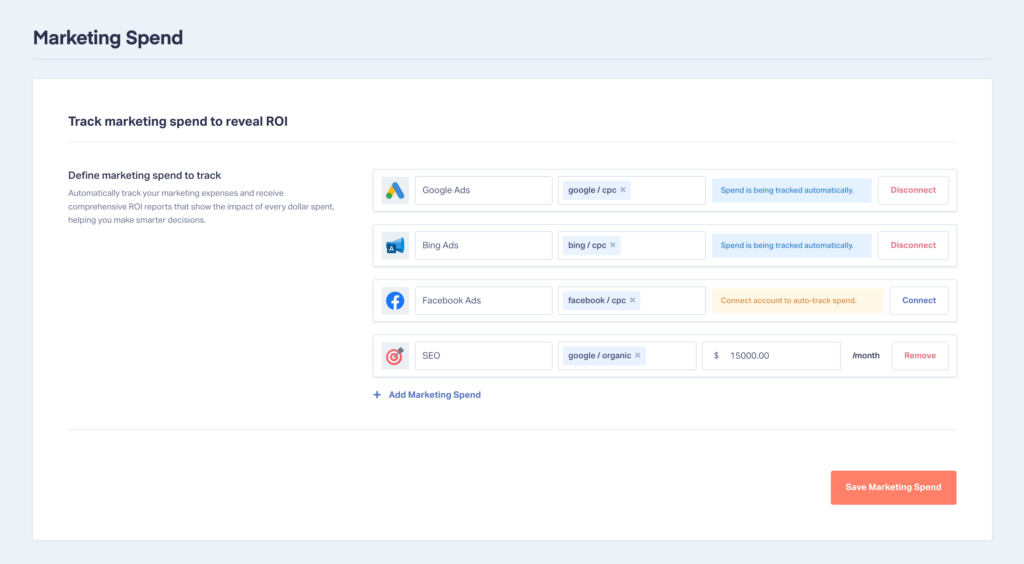
- Automatically track spend from Google Ads, Bing Ads, and Facebook Ads as soon as your integrations are connected.
- Manually add spend for other channels like SEO, print, or sponsorships to calculate full ROI across all marketing.
- See cost per lead instantly in reports, helping you identify which channels and campaigns drive the best returns.
- Drill down by campaign, keyword, landing page, and more to see which parts of your marketing deliver the highest value.
- Spot high-value opportunities and shift budget towards what works.
Example Use Case: The Summary Report

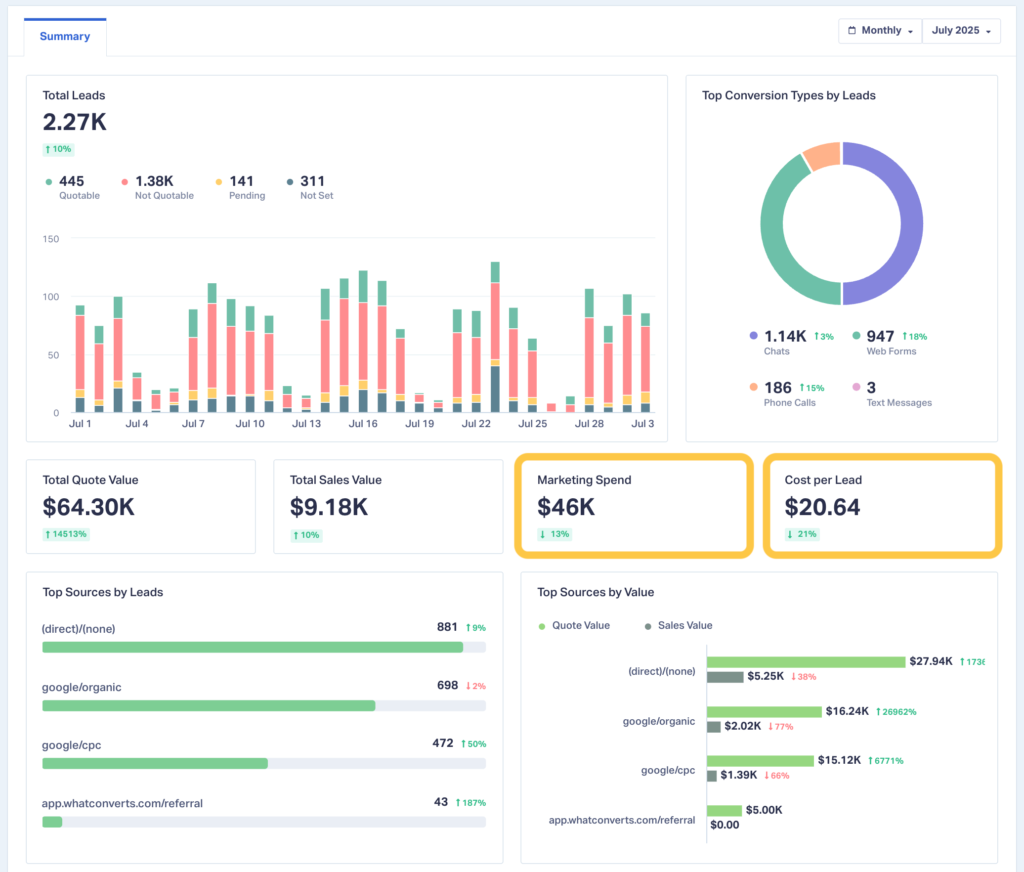
For these weekly check-ins, you head over to the newly updated Summary Report, which now includes Marketing Spend and Cost Per Lead. Here, you can instantly view the overall cost per lead across all campaigns, plus how it’s changed week-over-week or month-over-month.
For example, this week you notice the cost per lead is $20.64, which is 21% lower than last month. What could this change mean?
| Change in Cost Per Lead (CPL) | What It Could Mean | Recommended Action |
| CPL is lower than last period | Campaigns are performing well | Shift more budget into high-performing campaigns or commit more to experimental campaigns to find new opportunities. |
| CPL is lower, but lead quality drops | Increase in low-quality, spam, or unqualified leads | Review leads in the dashboard to verify quality. Adjust targeting or filters to focus on high-value leads. |
| CPL is lower, but conversion rate from lead to sale also drops | Leads are cheaper but less likely to generate revenue | Reassess campaign targeting and messaging to attract more purchase-ready prospects. |
| CPL is lower, and lead volume has increased significantly | Your reach and efficiency have improved | Monitor quality and capacity to handle more leads. Consider scaling ad spend to maximize momentum. |
Bottom line: One dashboard now gives you both ROI and cost trend data, helping you act faster on opportunities and potential problems.
What’s New

Now it’s:
- Integrated by default for Google Ads, Bing Ads, and Facebook Ads (once connected).
- Streamlined into a single spend group per channel, keeping data clean and reports easy to read.
- More accurate thanks to direct pulls from your ad platforms.
- Report-ready with dedicated spend and cost-per-lead sections in your Summary Report.
Why This Matters
This update is part of a larger push to tie real sales value to marketing activity.
By combining lead quality, sales value, and marketing spend, you can finally see the true ROI (not just clicks, impressions, or raw lead counts).
Whether you’re an agency proving results to clients or an in-house marketer looking to optimize budgets, this change makes ROI reporting simpler, clearer, and more actionable.
How to Set It Up
- Go to Reports → Marketing Spend in your WhatConverts account.
- Ensure your integrations for Google Ads, Bing Ads, and/or Facebook Ads are connected during onboarding or via your integrations settings.
- If connected, spend data flows in automatically.
- Add manual spend for non-integrated channels (e.g., SEO, events, mailers):
- Enter your monthly budget.
- Assign the correct Source and Medium (e.g., “google / organic” for SEO).
- Save — and you’re done.
For Current Users
- Already tracking spend? You may need to adjust your setup. The new system tracks by Source/Medium rather than multiple dimension combinations.
- Multiple spend groups per channel are no longer supported — one spend group per channel keeps things clean and consistent.
- Need help adjusting? Our support team can walk you through any necessary changes.
Need Help?
Note: For more on Marketing Spend, please see the Help Center documentation.
Our support team is here to ensure your marketing spend is set up correctly. Contact us to review your account and start getting clearer, more valuable ROI insights.
Want clearer reporting on your marketing’s ROI? Book a demo with one of our product experts today!
Get a FREE presentation of WhatConverts
One of our marketing experts will give you a full presentation of how WhatConverts can help you grow your business.
Schedule a Demo
Grow your business with WhatConverts


