


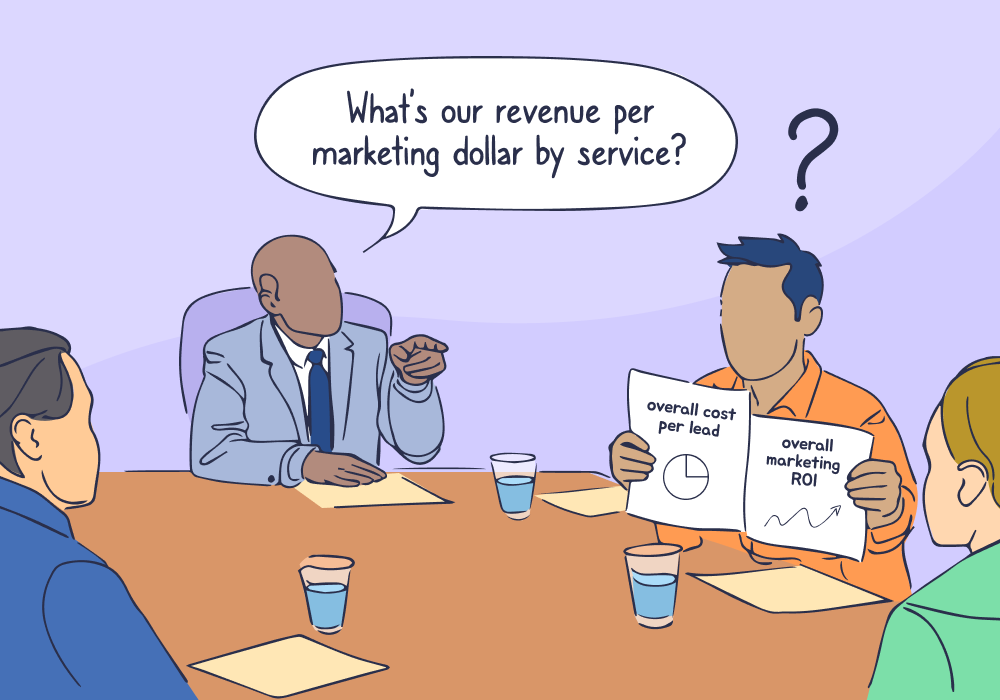
Executives don't ask marketing questions. They ask business questions.
- "What's our revenue per marketing dollar?"
- "Which channels produce leads that close at the highest deal size?"
- "Show me ROI by product category, broken down by campaign type."
These aren't unreasonable requests. They’re the exact questions marketing should be able to answer.
The problem is that standard marketing reports aren’t built to answer them. They’re designed around single metrics—leads, clicks, conversions—while executive decisions depend on combined, cross-dimensional insight.
The good news is that the problem isn’t your data. It’s a reporting problem, and it’s one that’s easily fixed. When you can combine spend, lead source, service category, and revenue into a single view, those executive questions become answerable—without spreadsheets, manual exports, or last-minute analysis.
Note: Not a WhatConverts user yet? Start your free 14-day trial today or book a demo with a product expert to see how we help prove and grow your ROI.
The C-Suite Translation Problem
Marketing dashboards are built to answer marketing questions. Cost per lead, click-through rates, conversion counts. These are the metrics that matter—at least, they matter for campaign optimization.
But executives don't think in campaign metrics. They think in business outcomes.
The CFO wants to know which service lines justify more budget. The COO wants revenue per channel. The CEO wants profit margins on leads from different sources.
This creates a translation problem: leadership asks questions that require combined, cross-dimensional metrics, while standard reports are built to show one dimension at a time.
The data exists, but the insight doesn’t. At least, not yet.
When One Question Needs Three Platforms
Here’s what happens when a client or executive asks a business question. You:
- Open Google Ads to pull spend by campaign.
- Open your lead tracking platform to export leads by source and service type.
- Open the CRM to pull closed deals and revenue.
- Export everything to spreadsheets.
- Manually match campaign names to services.
- Reconcile revenue to leads.
- Double-check the math.
Three hours later, you have a number. The meeting ended two hours ago, and the decision was made without you.
Standard reports weren’t designed to combine spend, lead source, service category, deal size, and close rate in a single view. They assume marketing performance can be understood one slice at a time. Executive decisions don’t work that way.
Why Standard Reports Can’t Combine Dimensions
Most reporting tools give you pre-built views, like leads by campaign, revenue by time period, cost per conversion by channel, or sales by product.
They’re useful, until someone asks a hybrid question:
- "Which sources produce leads with the highest close rate?"
- "What's our average revenue per lead by campaign?"
- "Show me total sales value versus lead volume by channel."
- "Which campaigns generate qualified leads versus tire-kickers?"
Standard reports can't answer these because they're built around single dimensions. They show you campaign performance or revenue by product or cost by channel—but not the intersections executives need.
So teams fall back on one-off analysis, spreadsheet workarounds, and last-minute reporting scrambles that never quite line up the same way twice.
It’s slow, but it works—at least, it worked once, for that one question. Next meeting, you’ll have to do it all over again.
The Real Cost of Manual Reporting
Manual reporting doesn’t just waste time—it changes outcomes.
- Decisions get made without data because answers arrive too late.
- Budget shifts favor whoever sounds most confident, not whoever has proof.
- Marketing gets framed as a cost center instead of a growth lever.
Most agencies and in-house teams aren’t failing to report. They’re failing to report in the language executives use to decide.
The Report That Doesn't Exist—Until You Build It
This is where reporting has to change—not on a report-by-report basis, but structurally.
WhatConverts's Report Builder is designed around executive questions, not platform defaults. While you have the option to choose from pre-built reports, you can also easily create custom calculations that combine the dimensions your business actually cares about.
Want to know which campaigns generate the highest revenue per lead? Combine total sales value and lead count in a single report. The math happens automatically.
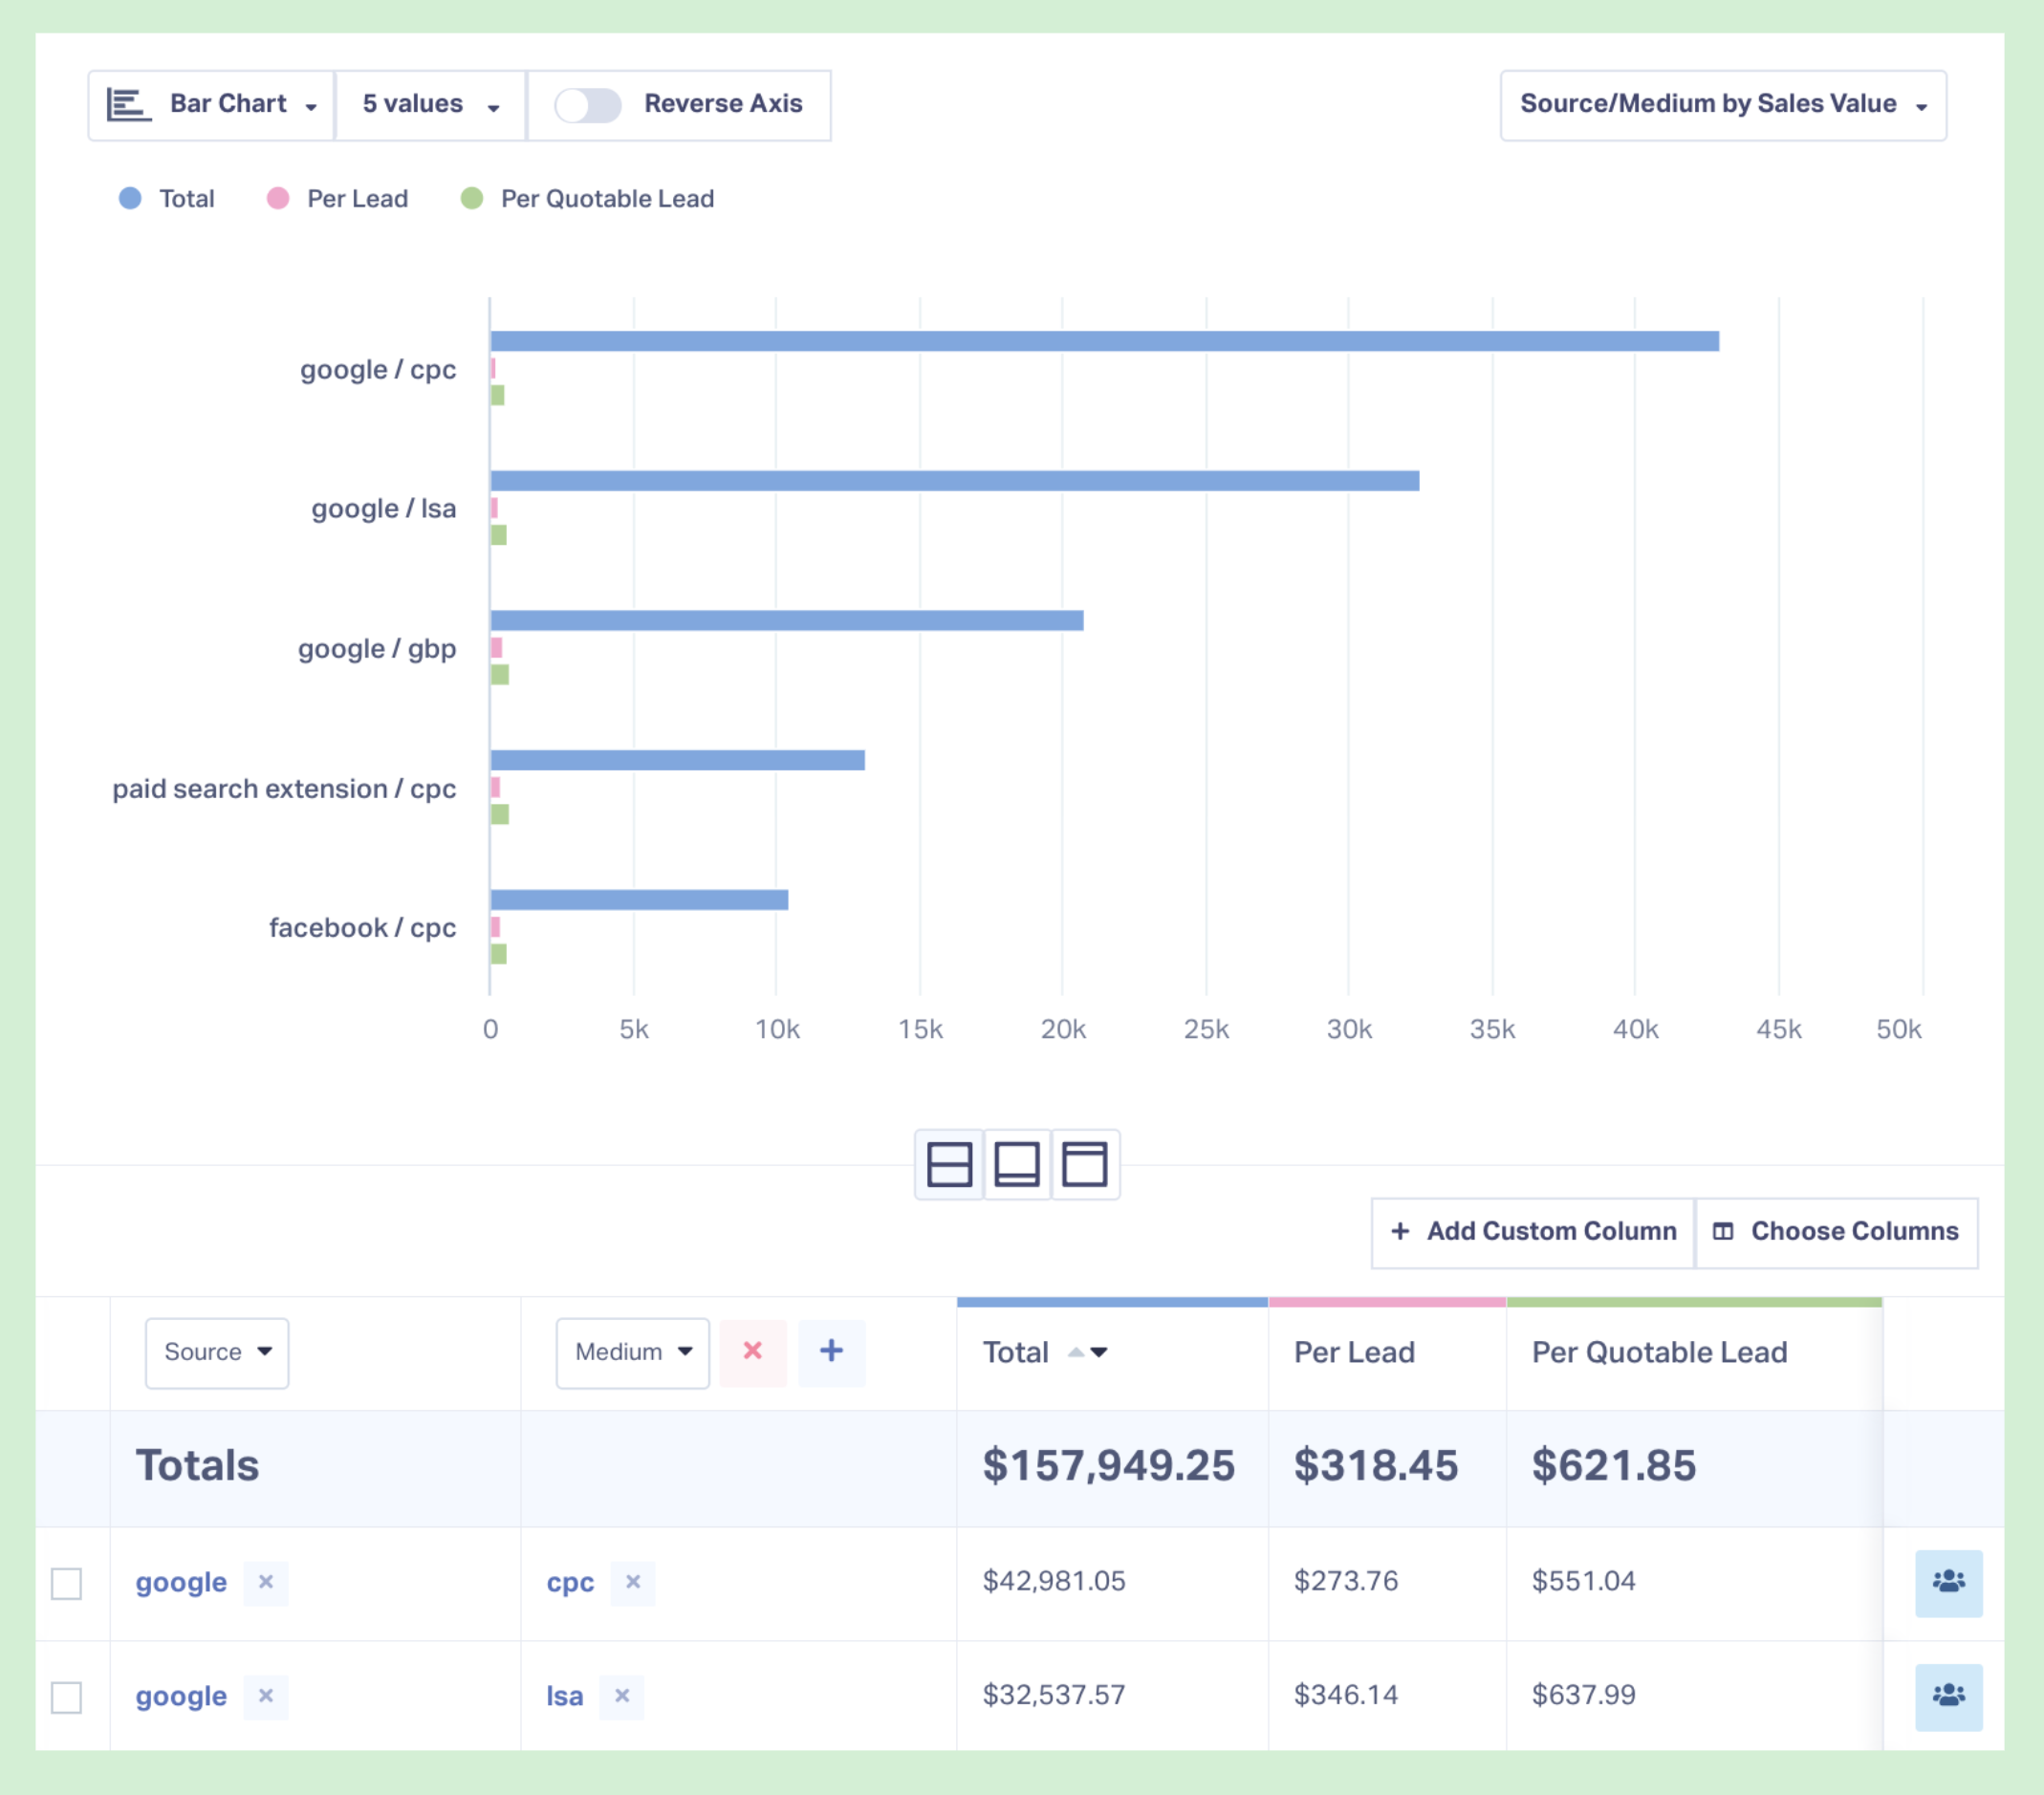
Want to see which channels produce qualified leads versus junk? Filter by lead score, quotable status, or custom qualification criteria alongside source attribution.
Build the report once, save it, and let it update automatically.
The next time leadership asks, “What does this look like by region?” you add a filter, not another spreadsheet.
What This Looks Like in Practice
Digilatics, a performance agency serving home services businesses, ran into the same reporting ceiling most teams hit: plenty of marketing data, but no standard report that could answer executive-level questions without manual work. Using WhatConverts, they built reports that combined spend, lead source, call data, and closed revenue into a single view—so client conversations could focus on business outcomes, not activity metrics.
That shift unlocked measurable results:
- 90% reduction in cost per conversion by cutting waste and reallocating budget
- 22% business growth for the client
- Revenue records broken for the first time in 14 years
Instead of reporting lead volume, Digilatics could show which marketing drove real revenue—and where leadership should invest next. That’s what executive reporting looks like.
Read More: Advanced Reporting and Clear Attribution Powers 22% Growth [Case Study]
From Reporting Bottleneck to Strategic Asset
When leadership can get business-metric answers in real time, marketing stops being a cost center and starts being a growth driver.
The questions shift from "why did this cost so much?" to "where should we invest more?" You stop scrambling to justify performance after decisions are made and start shaping those decisions with data executives actually trust.
Build Reports Executives Can Use
Standard dashboards weren’t built for executive decision-making.
If you’re still translating marketing metrics into business answers by hand, the problem isn’t your analysis—it’s your reporting model.
Ready to build the executive reports that standard dashboards can't?
Start your free 14-day trial of WhatConverts today or book a demo with a product expert to see how we help prove and grow your ROI.
Get a FREE presentation of WhatConverts
One of our marketing experts will give you a full presentation of how WhatConverts can help you grow your business.
Schedule a Demo
Grow your business with WhatConverts


