


A law firm's marketing agency spent five years growing their client's revenue by 300%. Then a consulting group walked in, pointed to the CRM, and credited the results to a website chatbot—not the agency.
They had traffic reports. Engagement metrics. Ad conversion data. None of it was enough.
Because none of it let them open a lead on the spot and say: here's the person, here's the campaign, here's the revenue.
That's a reporting problem. Specifically, a static reporting problem.
Most reports answer one question: how many? Clients make decisions based on how valuable—and when a skeptical client asks to see proof, a dashboard full of totals goes silent.
That silence is what true interactive reporting eliminates. This article defines exactly what that means, and what changes in a client meeting when you have it.
Note: Not a WhatConverts user yet? Start your free 14-day trial today or book a demo with a product expert to see how we help prove and grow your ROI.
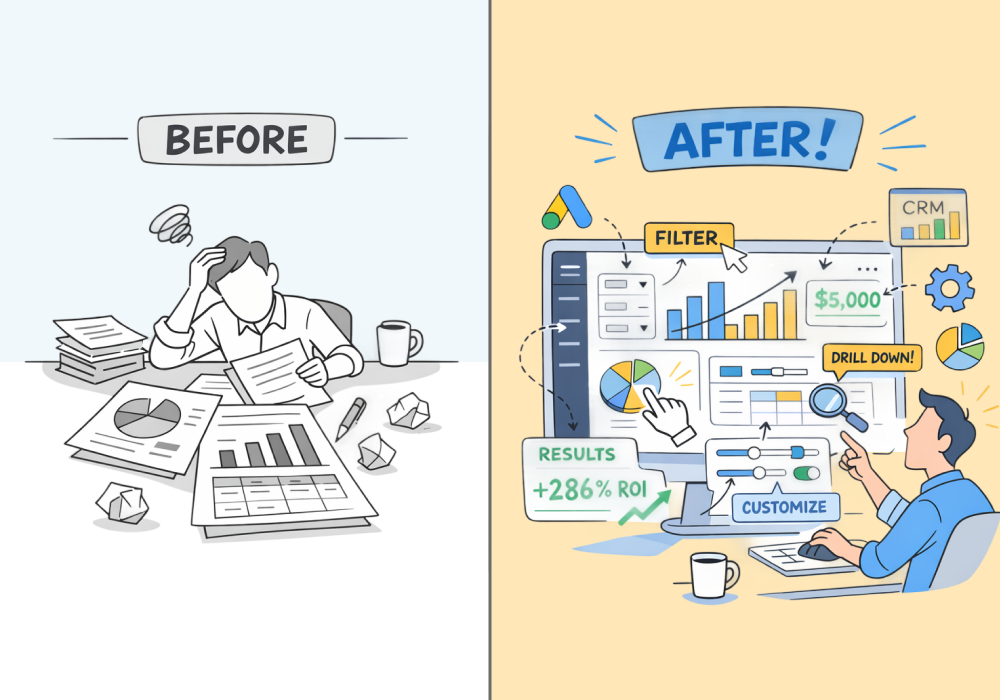
The Problem with Reports That Can't Answer Questions
Static reports summarize performance. They show totals: 80 leads from Google Ads, 40 calls from Local Services Ads, 20 form submissions from SEO.
That’s useful for tracking volume, but it doesn’t answer the questions clients eventually ask. Questions like:
- “Were those calls real prospects?”
- “Which campaigns generated the qualified leads?”
- “What did the calls actually sound like?”
When those questions come up, the report stops helping.
The agency has to leave the dashboard, open other tools, export spreadsheets, or promise to follow up later. But everyone in the room knows what just happened: they didn’t have an answer.
Not all reporting tools are built the same—and the difference matters more than most agencies realize.
For a full breakdown of:
- How the top 9 agency reporting platforms compare
- What separates a data capturer from a data aggregator
- What to look for when choosing a reporting stack that actually proves client ROI
Check out the full guide:
9 Best Marketing Reporting Software for Agencies in 2026
What "Interactive" Actually Means
"Interactive reporting" gets thrown around a lot. Most of the time it means a prettier dashboard with a few dropdown filters.
That's not what we're talking about.
Real interactive reporting means the report is the data. Every number in the summary is a doorway. Click on "87 leads from Google Ads" and you don't get a new tab—you get the actual leads. Who called, when they called, what they said, whether they were qualified, and what they were worth.
The difference looks like this:
- Static report: "We generated 87 leads from Google Ads."
- Interactive report: Click → here are the 87 leads → here's Maria, who called after searching "emergency HVAC repair," lasted 9 minutes on the phone, got quoted $3,400, and hasn't been followed up with.
One is a summary, while the other is evidence.
Why It Changes the Client Meeting
Static reports force agencies into a defensive posture. Clients ask questions, agencies promise to follow up, and the meeting loses momentum before it ever builds trust.
Interactive reports flip that dynamic.
When a client questions the quality of leads from a particular campaign, you don't say "let me get back to you." You click into the report, pull up that campaign's leads on the spot, and walk through them together. The client sees what qualified looks like versus what didn't. They hear the difference between a 90-second misdial and an 8-minute consultation call.
That's not a reporting update. That's a conversation that builds retained budgets.
There's another effect that agencies underestimate: it signals competence before you say a word. Clients notice when an agency can navigate their own data without fumbling. Real-time drill-down says: we know this inside and out.
What Happens When You Build This Manually
Many agencies realize they need this level of visibility, so they try to build it themselves by putting together layered spreadsheets. They’ll have:
- A reporting dashboard for campaign metrics
- Summary tabs linked to raw data tabs
- Multiple browser windows open during calls to toggle between platform analytics
That works, up to a point. But the system is fragile.
Data lives in multiple places. Reports break when sources change. Pulling examples during client meetings requires quick switches between tools that can make you look unprepared.
And the fact remains that some data is still missing: you still can’t show individual lead profiles and prove that each lead generated was valuable.
How WhatConverts Makes Reports Truly Interactive
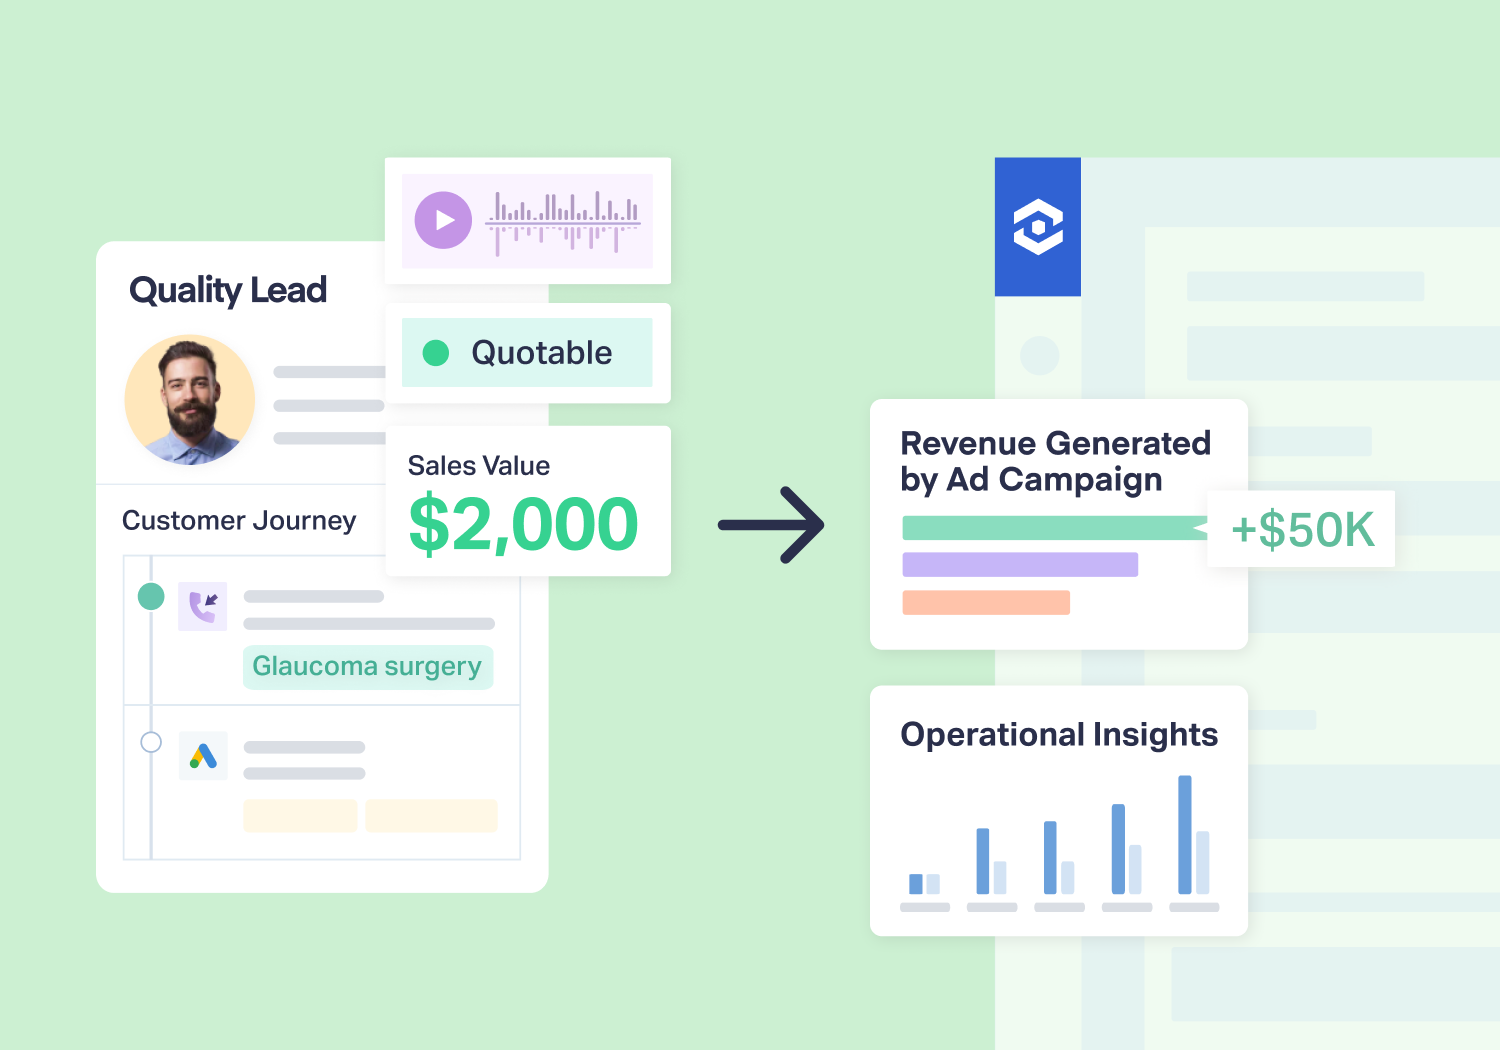
WhatConverts is different from all other reporting tools and systems because it attaches the leads themselves to the report.
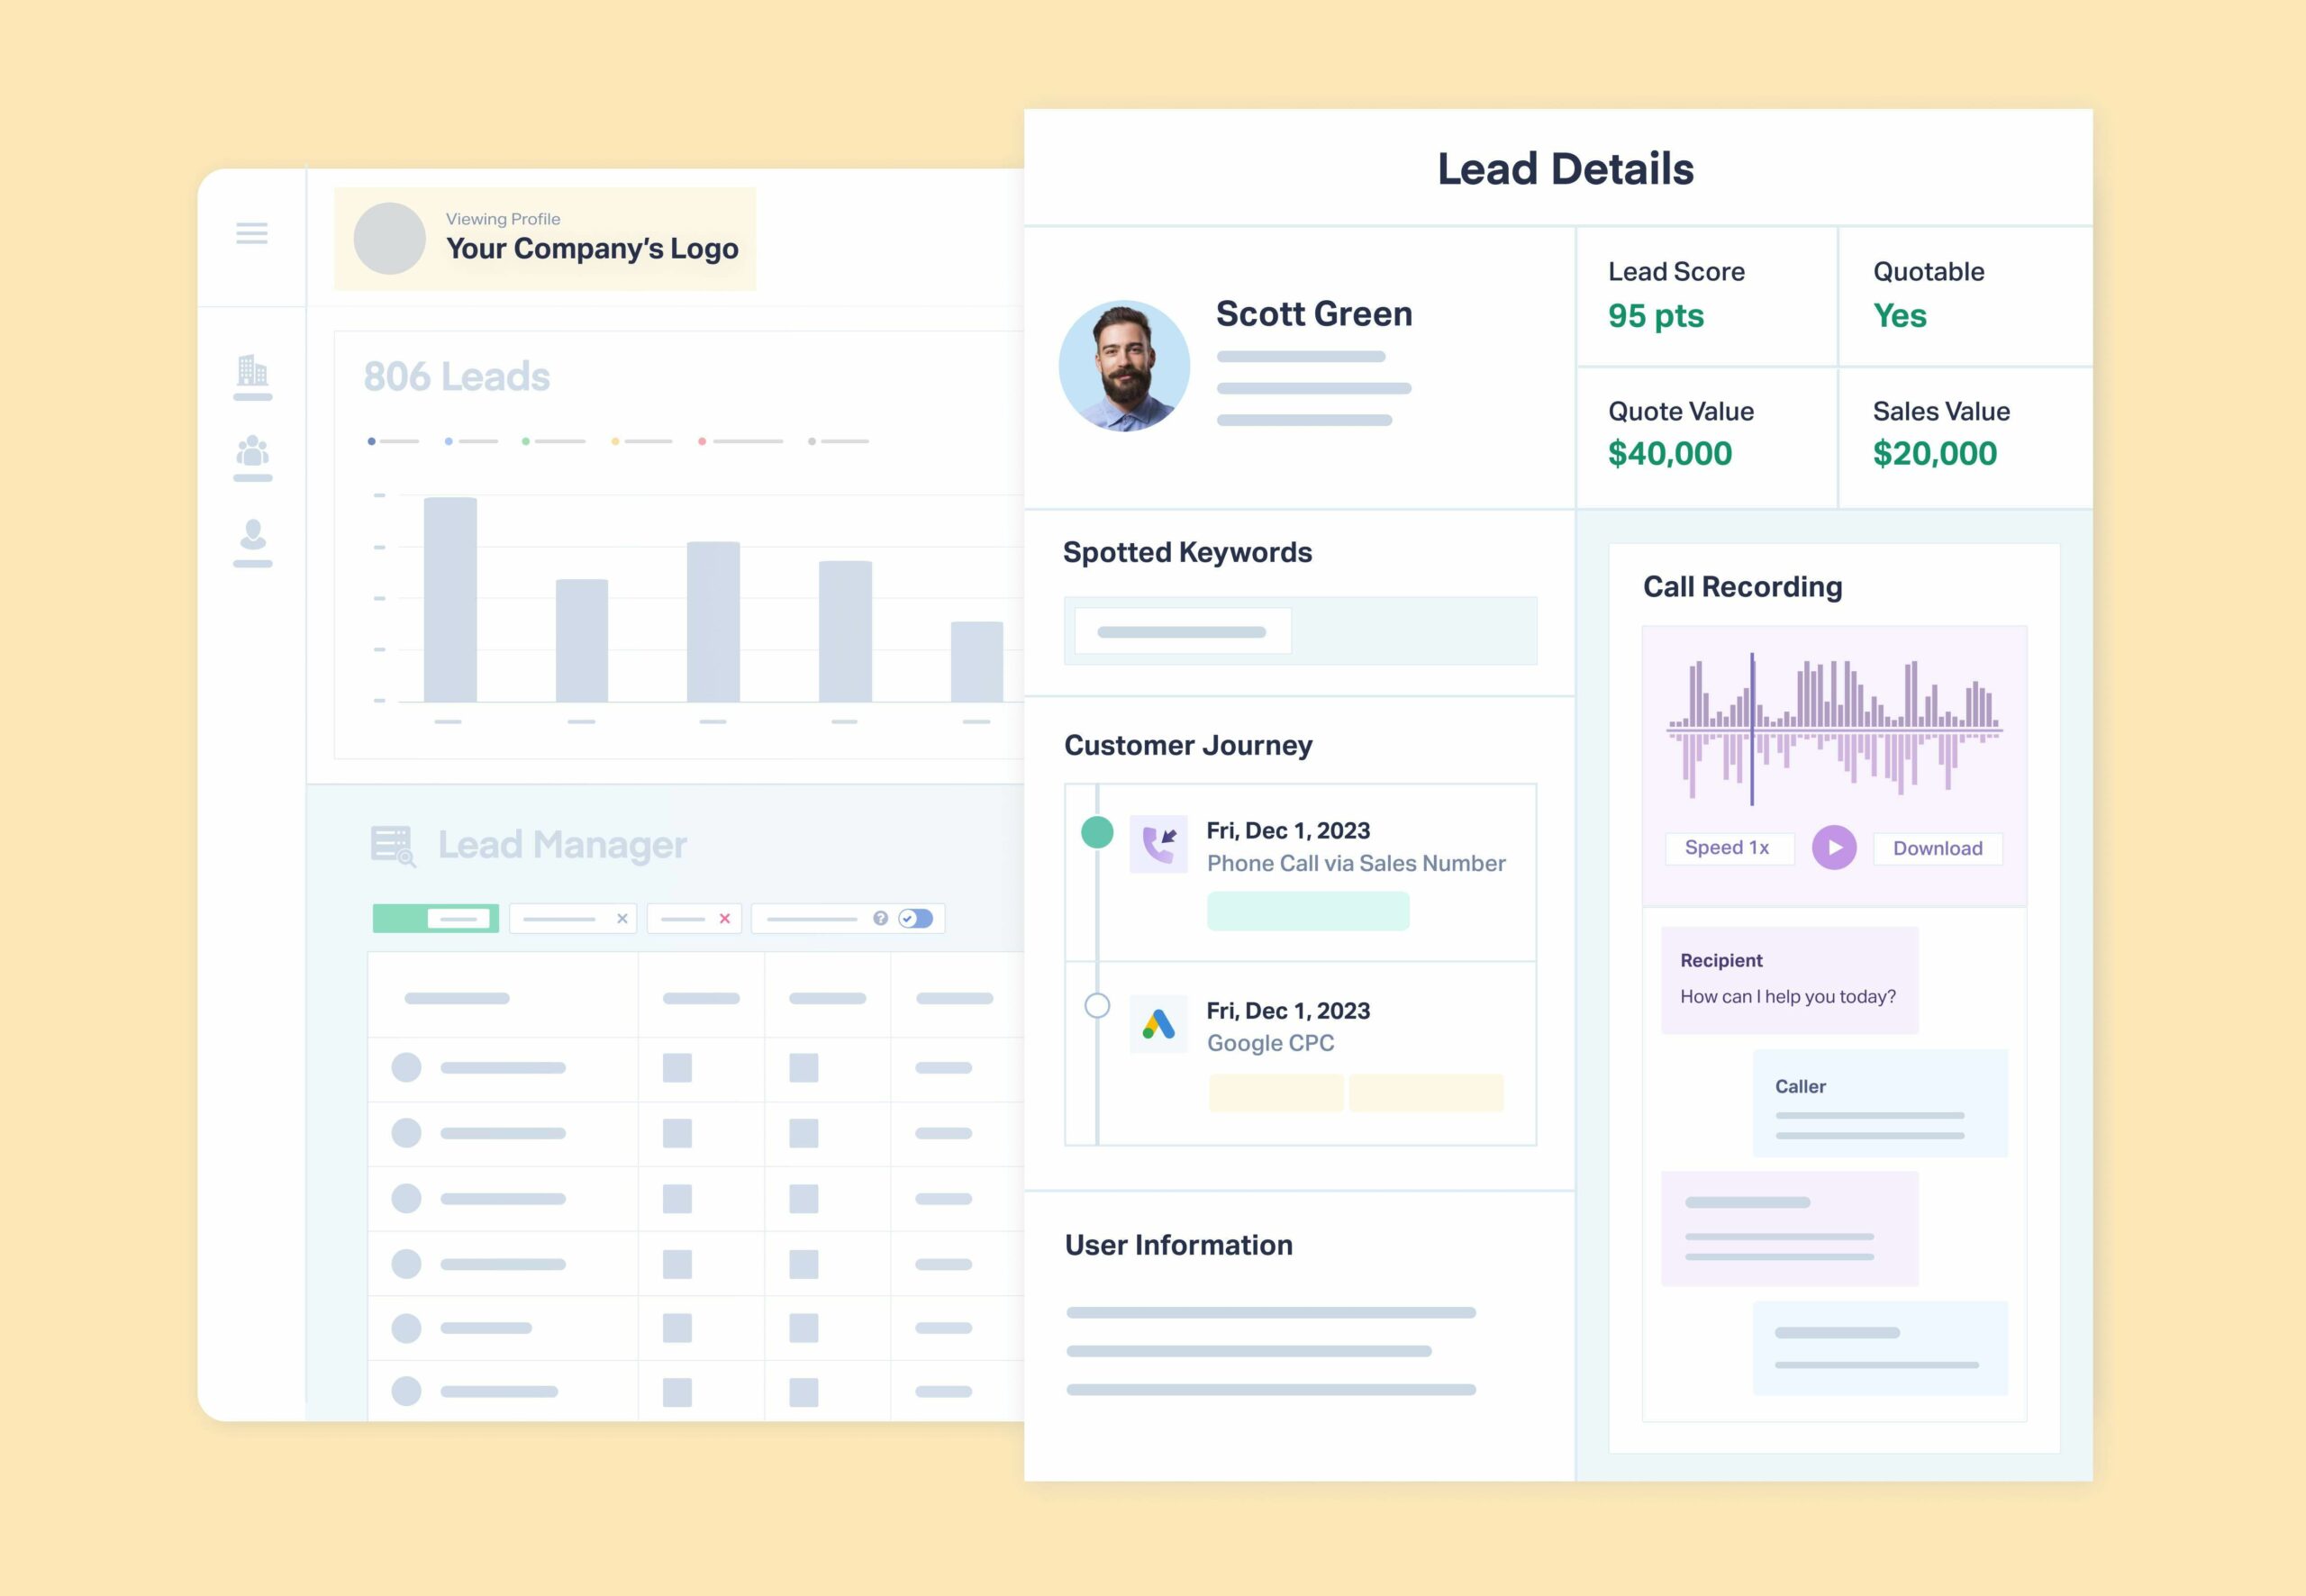
Instead of seeing only totals, agencies can move directly from a metric to the real data behind it. When a client questions whether Google Ads leads are qualified, you:
- Click the campaign inside the report
- Immediately load a list of individual leads with names, details, and marketing attribution
- Open a call recording from a homeowner requesting an estimate
- Read the transcript of a conversation about scheduling a service
- See the marketing source, keyword, and campaign that generated the lead
In a few seconds, the discussion has moved from assumptions to evidence. The report isn’t just summarizing performance anymore: it’s showing exactly what happened.
Proof: How Constellation Marketing Turned a Cancellation into a 150% Budget Increase
"I think of WhatConverts like an insurance policy against client churn. It gives us the ability to prove our value."
— Constellation Marketing
Constellation Marketing had grown a criminal defense law firm's revenue by 300% over five years. Then a consulting group attributed those results to a website chatbot. The account was nearly lost.
The problem wasn't performance—it was proof. Constellation couldn't open a lead in front of the client and show exactly where it came from and what it closed for.
With WhatConverts, they could. Drilling into individual leads directly from their reports, they proved their marketing drove real results:
- $500,000+ in earned revenue—70% of the client's total
- 9x return on investment
- 150% budget increase from a client who almost walked
Read More: 9X ROI Secures Client Retention for Law Firm Marketing Agency [Case Study]
The Real Impact of Interactive Reporting
If interactive reporting is new to you, you're not alone. Most agencies are still working from tools that were built for snapshots, not conversations.
Understanding the mechanism is the first step. The second is knowing which platforms actually deliver it—versus which ones just call a filtered dashboard "interactive."
For a full breakdown of reporting tools and what separates genuinely interactive platforms from static KPI snapshots, see our guide: Best Marketing Agency Reporting Tools.
The Bottom Line
Agency reporting is evolving.
Static dashboards summarize performance; interactive reporting shows the proof behind it.
When every number in a report connects to the leads behind it, client conversations change. Instead of asking whether the results are real, clients can see them.
And when clients can see the real impact of marketing, the conversation stops being about defending spend and starts being about where to invest next.
Ready to make every client conversation count?
Start your free 14-day trial of WhatConverts today or book a demo with a product expert to see how we help prove and grow your ROI.
Get a FREE presentation of WhatConverts
One of our marketing experts will give you a full presentation of how WhatConverts can help you grow your business.
Schedule a Demo
Grow your business with WhatConverts


