


Why do agencies lose clients? Rising costs? Souring relationships? Lack of transparency? Believe it or not, it's none of those. In fact, each reason is actually a symptom of the same problem—an inability to prove your value.
That's where marketing reporting software comes in. With the right reporting tools, agencies can prove their value to clients while also uncovering impactful optimization insights. And in doing so, they can keep clients happy, grow their ROI, and expand their agency.
But the question is, which marketing reporting tool is right for you? Today we’re looking at how to find the best marketing reporting software, breaking down the top nine platforms, and showing who can benefit from each.
G2's Top Marketing Reporting Tools
Before we get into what to look for in a marketing reporting tool, here are the top platforms as rated by 1850+ views from G2—the world's leading software review company.
The scores shown here have been updated to reflect the Winter 2025 G2 reports.
- Meets Requirements9.5
- Ease of Use9.3
- Ease of Setup9.3
- Ease of Admin9.5
- Good Partner9.8
- Product Direction9.7
-
Data Capturer + Aggregator (report on first AND third party data)
-
Interactive Reporting (drill down into individual leads)
-
Numerous Report Templates + Custom Report Builder
-
Lead Capture, Qualification, Valuing, & Reporting (all in one)
-
Lead Tracking & Reporting Software for Agencies – Best Tool for Proving & Growing Your Marketing Value


Other tools worth exploring:
- ReportGarden: Plenty of White Label Features (Including Client Proposals)
- Whatagraph: Good for Agencies w/ 40+ Data Sources
- Reportz: Useful for Freelancers & Small-Scale Agencies
- DashClicks: Reporting + Marketing Fulfillment Software
Before we get into ranking each tool, we are going to cover what to look for in a marketing reporting software.
What to Look for with Marketing Reporting Software
Marketing reporting communicates the performance of your marketing channels and allows you to optimize your campaigns based on data. For example, one agency achieved 38% annual growth for the last 8 years because they used marketing report data to optimize based on which channels were performing.
Read More: Case Study: 27X ROI & 38% Yearly Growth Using WhatConverts
That said, great marketing reporting can mean different things for clients and for marketers. Let's take a closer look at those differences.
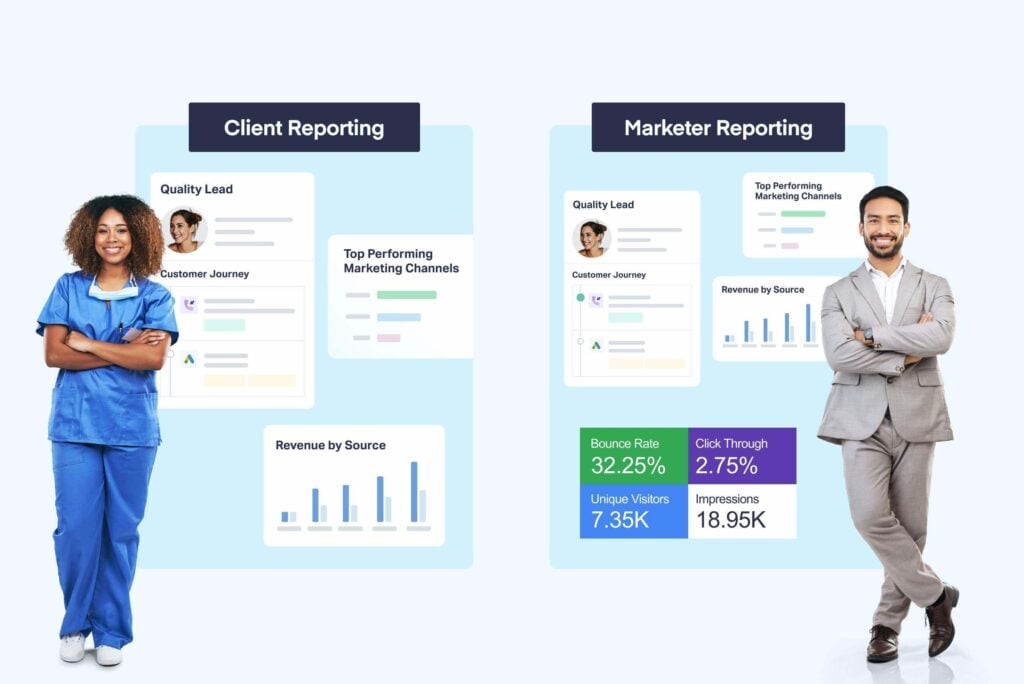
Great Marketing Reporting for Clients
On the client side, reporting needs to communicate the value of your client’s investment using the language they speak. Presenting your results in this context means more to your clients than simply showing total leads generated.
For example, if you’re doing marketing for:
- A dentist, report on the value of your marketing by procedure (“crown,” “veneer,” “cleaning”)
- A plumber, show it by the service or type of repair (“water heater repair,” “sewer line installation,” “drainage services”)
Client reporting also needs to be able to answer questions your clients may have, like which products are doing well, which are new or existing customers, and why did ad spend increase but results didn't improve?
Finally, client reporting needs to be easily digestible (not cluttered with unneeded metrics).
Great Marketing Agency Reporting for Marketers
Marketing professionals need more robust data to optimize their campaigns.
They need reporting that lets them:
- Speak Their Client’s Language
- Understand Performance at Every Stage of the Buyer’s Journey
- Interrogate Their Data
1. Speak Their Client’s Language
One of the most valuable conversations you can have with a client is the “needs discovery” talk. What’s important to them? What are the success metrics they’re judging your marketing by? What are the success metrics they’re being judged by?
When you understand what’s important to each client, you can build informative reporting that matters to them. The trick is having the right tools to capture those important metrics so you can include them in your reporting.
Below are some examples to illustrate how reporting tools and KPIs may differ across clients.
| Client Type | How to Speak Their Language | Tools Needed |
| The Bottom Liner – Only cares about earnings vs. costs | Focus on revenue. Start with a broad ROI metric, then break it down by revenue earned per channel + other cost-centreed metrics (CPL, CPA, LCV, etc.) | Lead tracking tools (for connecting leads to value) |
| The Corporate Ladder Climber – Focused on KPIs to please higher-ups | Include all KPIs discussed during discovery (even if they aren't actually important) – clicks, impressions, traffic, etc. But also include value-based KPIs like SQLs, ROI, etc. | Data reporting tools like Agency Analytics, Lead tracking tools for adding value-based metrics |
| The Ruthless Competitor – Results-oriented, but also want to crush the competition | Lead metrics (SQLs, lead quality, etc.), search engine rankings (new keywords, ranking changes), and competition comparisons (shared keywords, impression share) | Lead tracking combined with reporting tools and competitive analysis tools like Semrush and Ahrefs |
2. Understand Performance at Each Stage of the Buyer’s Journey
What’s considered a good performance metric depends on which stage of the buyer’s journey you’re reporting on. Marketers need access to the right data at each stage before they can understand what’s working and how to improve results.
For most marketers, you'll only be focused on three stages of the buyer's journey: Stranger to Visitor, Visitor to Conversion, and Lead Stage. Below are recommendations on when to use metrics from which stage as well as which data sources to use to get those metrics.
| Stage | Reporting Metrics | When to Use | Data Sources Needed |
| Stranger to Visitor – At this stage (before a user makes a conversion action), you can get optimization insights from engagement metrics. | - Unique visitors - Time on page - Bounce rate - Pages per session - Scrolldown events - Clickthrough rate | Before campaigns have started producing conversions | Google Analytics, Google Ads, Bing Ads, Facebook Ads |
| Visitor to Conversion – Once a visitor takes a conversion action on your pages, you need to be able to capture that conversion data. | - Number of conversions - Types of conversions - Conversions per page - Conversions per campaign | Once campaigns have started producing conversions | Google Analytics, Google Ads, Bing Ads, Facebook Ads, and lead tracking software (like WhatConverts) |
| Lead Stage (Lead Qualification & Valuing) – After a visitor takes a conversion action, they become a lead. But you still need metrics to know if that lead is actually valuable. | - MQLs - SQLs - Quote value - Sales value - ROI | When you’re determining the value your marketing generates | Lead tracking software (like WhatConverts) |
Read More: How Does Customer Journey Marketing Work?
3. Interrogate Their Data
Clients will inevitably have questions about the quality of your leads.
Questions like:
- Are these leads spam?
- Are they actually part of our target audience?
- What was the value these leads generated for my business?
Reporting that’s interactive rather than static lets you interrogate your data (drill down into individual leads to prove each is qualified) right from your reports and answer client questions on the spot. Being able to interrogate your data also means you can prove your data is correct before making decisions based on it.
Say you’re evaluating campaign performance across three different platforms: Google Analytics, Google Ads, and your form builder. In Google Analytics, you see your campaign brought in 250 conversions last month. In Google Ads, it shows 235. And in your form builder, 275. Which is the right number?
Without the ability to interrogate your data and see individual leads, you can’t verify which is correct. And that means you can’t optimize confidently based on it.
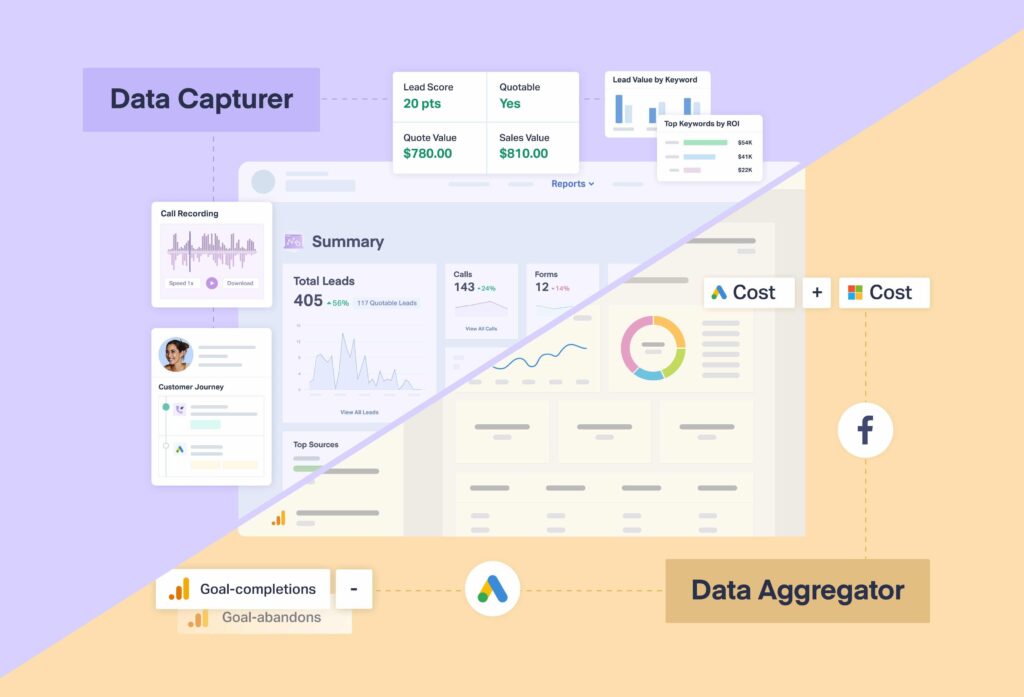
Two Types of Marketing Reporting Platforms: Data Aggregators & Data Capturers
There are two types of marketing reporting platforms:
Data Aggregators
These tools collect 3rd party data from many sources and provide the tools needed to report on all that combined data. They’ll typically show daily, weekly, monthly, or quarterly KPI changes (think of it like a KPI “snapshot”). They’re also designed to quickly create visually appealing, easy-to-understand reports (great for client reporting). However, since aggregators are not the data source, it makes it difficult to drill down into the data.
| Data Source | Third party (other data sources) |
| Example Tool | AgencyAnalytics - Great Data Aggregator that easily creates beautiful reporting from 75+ data sources |
| Example Data Sources | - Google Ads - Bing Ads - Lead Tracking Data from WhatConverts |
Data Capturers
These tools collect the data (contact info, lead data, marketing data, etc.). Some even let you report on it within the software itself. Since capturers are the source of that data, you can drill down into the details from your reporting. However, how far you can drill down depends on the platform (e.g., WhatConverts lets you see and manipulate individual lead data while Google Ads doesn’t).
| Data Source | First Party (collect data themselves) |
| Example Tool | WhatConverts – Great Data Capturer because it directly captures contact, marketing, and lead data from any lead type (calls, forms, chats, etc.) |
| Example Data Types | - Customer journey - Call transcripts/recordings + form data - Lead quality data - Source/Medium data - Campaign/Keyword data |
Remember: Data Aggregators and Data Capturers can be used together to create visually appealing client reporting that still speaks the language of your client. For instance, you can use AgencyAnalytics to combine WhatConverts lead data, traffic KPIs from Google Analytics, and ad spend KPIs from Google Ads into a single, beautiful client report.
When To Use Data Aggregators & Data Capturers
To help you decide which marketing reporting tool (or tool combination) is right for you, think about what your goal is when using these platforms.
| Goal | Recommendation |
| Take X number of data sources and report it to your clients. | Use a Data Aggregator suggested below. |
| Understand lead quality and prove the numerical value of your marketing. | Use a Data Capturer that lets you capture lead data and qualify/enrich leads with sales or quote value (WhatConverts does this). |
| Create monthly KPI snapshot reporting. | Use a Data Aggregator suggested below. |
| Create interactive reporting that lets you drill down into the data and answer tough client questions. | Use a Data Capturer with interactive reporting (WhatConverts does this). |
| Create reporting from multiple data sources while still being able to see lead quality and marketing value (quote and sales value). | Use a Data Aggregator combined with a Data Capturer like WhatConverts that tracks leads. |
Want to see how WhatConverts and other marketing tools stack up against an all-in-one marketing platform? Check out our article on the 7 Best GoHighLevel Alternatives for Growing Businesses.
9 Best Marketing Reporting Software for Agencies in 2026
Now that we understand the what, why, and how of marketing reporting, let’s look at the top recommendations for marketing agency reporting software.
Each reporting tool will also have a score provided by G2, one of the most widely used software review platforms.
- WhatConverts: Lead Tracking & Reporting Software for Agencies – Best Tool for Proving & Growing Your Marketing Value
- AgencyAnalytics: Automated Dashboard Reporting Tool Specifically for Agencies (w/ Reporting Templates)
- Looker Studio (Google Data Studio): Google Reporting Great for Combining Google Ads, Analytics, & WhatConverts Data
- DashThis: User-Friendly Dashboard Reporting + Custom Designed Reports (w/ Reporting Templates)
- TapClicks: Enterprise-Level Marketing Operations Platform with Reporting
- ReportGarden: Plenty of White Label Features (Including Client Proposals)
- Whatagraph: Good for Agencies w/ 40+ Data Sources
- Reportz: Useful for Freelancers & Small-Scale Agencies
- DashClicks: Reporting + Marketing Fulfillment Software
1. WhatConverts (9.8/10)
Lead Tracking & Reporting Software for Agencies – Best Tool for Proving & Growing Your Marketing Value
- Marketing Reporting Software: Data Capturer & Aggregator
- Reporting Type: Interactive Reporting
WhatConverts Overview
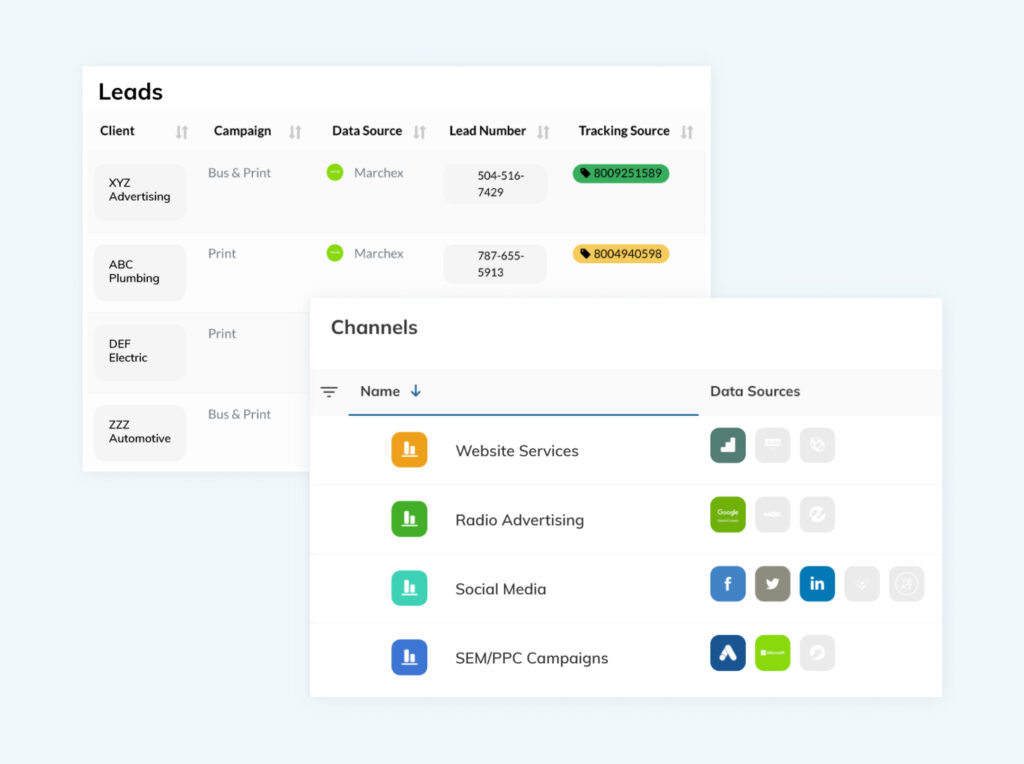
WhatConverts is a powerful lead tracking, management, and reporting tool. Some core differences between WhatConverts and other marketing reporting tools are:
| Differentiator | What It Is | Why It's Important |
| Lead Capture | Fills in the data gaps that other sources miss by collecting high-quality lead data on an individual level | With it, you can enrich (qualify, value) and interrogate your data while also being able to create interactive, insightful reports without switching to another tool |
| Lead Qualification & Valuing | WhatConverts Lead Manager lets you qualify and attach a value (quote or sales) to individual leads based on the captured lead data | You can put a number on the revenue generated by each of your marketing efforts |
| Lead Intelligence | Lead Intelligence from WhatConverts automatically scores, qualifies, and actions your leads for you | You can do what used to take hours (qualify hundreds of leads, compile their information, send the data to sales, etc.) in literal seconds |
| Robust Reporting | From pre-built marketing reporting templates to the customizable Report Builder, WhatConverts lets you report on 70+ data points collected for each individual lead | You can focus on the reporting metrics that matter |
| Powerful Integrations | With 1,000+ integrations, WhatConverts is able to connect with tons of major data sources (Google Analytics, Bing, Shopify, Instapage, Wix). It’s especially great with Google Ads, making it ideal for PPC marketers | You can automatically optimize your Google Ads to attract higher-quality and higher-value leads |
For these reasons (and more), WhatConverts is a top choice for marketers who want to prove and grow their ROI, especially if they're using Google Ads.
WhatConverts Marketing Reporting
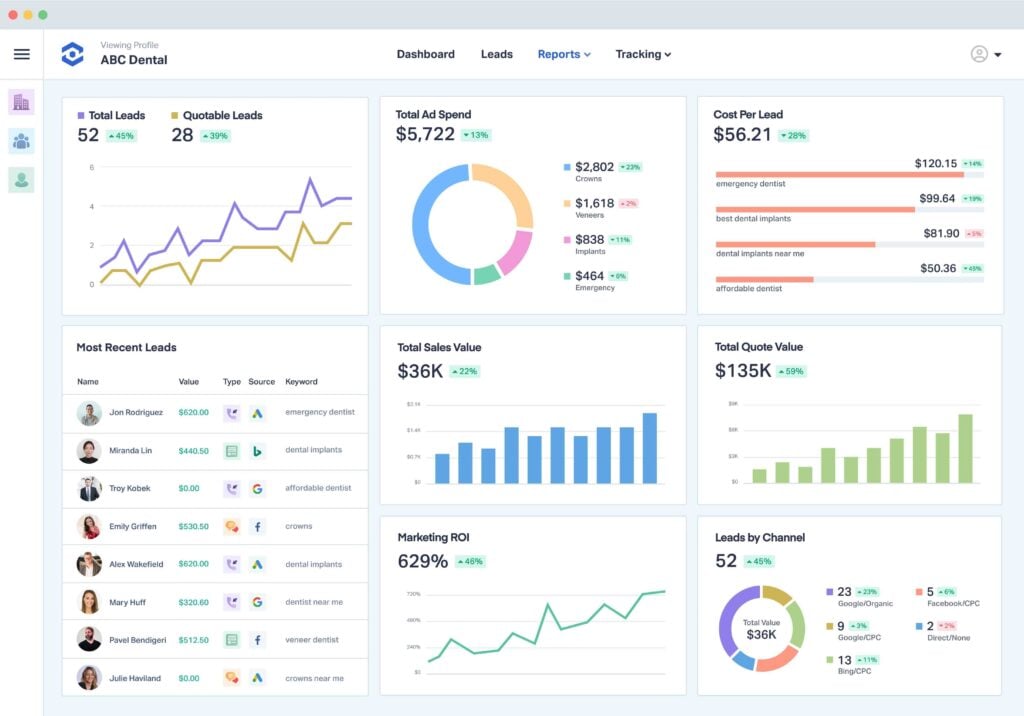
WhatConverts is able to produce clear, concise reports on which marketing campaigns are generating leads (and how many) due to the quality of the data captured.
Instead of just pulling basic ad campaign stats from Google Ads or Facebook, WhatConverts captures user behavior on your site, namely: calls, form fills, and what marketing activities brought them to the site. This creates a rich dataset around leads that your website is generating, including data like:
- Number and type of leads
- Number of times they visited the site
- Which pages they converted on and what marketing brought them in
- Sales and Quote Value
With this data, you can build beautiful reports that are easy to read, communicate the most important marketing metrics (leads and value generated), and can be customized and scheduled to fit your needs.
To help you understand the benefits, let’s look at 3 types of reports that you can send to clients using WhatConverts.
- Monthly Summary Marketing Report: With just a quick 30-second scan, you and clients can see the total number of leads for the month and where they’re coming from.
- Lead-Driven Report Templates: i.e., Leads by Keyword, Leads by Source & Medium, Leads by Landing Page, Leads by Requested Service, and so on.
- Custom Reports: Create reports using custom data points that are most relevant to each client’s business.
Monthly Summary Marketing Report
As we touched on earlier, the majority of marketing agency reporting has two key problems:
- They are based around marketing KPIs that aren’t as important to clients as leads and value, such as traffic, bounce rates, click-through rates, conversion rates, and so on.
- They are unnecessarily long and complex, making it a hassle for clients to go through.
One of the best ways agencies can prove the value of their marketing strategy and impress clients is with our Summary Marketing Report. It solves the problems listed above by being (1) fully based around leads as the KPI and (2) digestible and easy to understand.
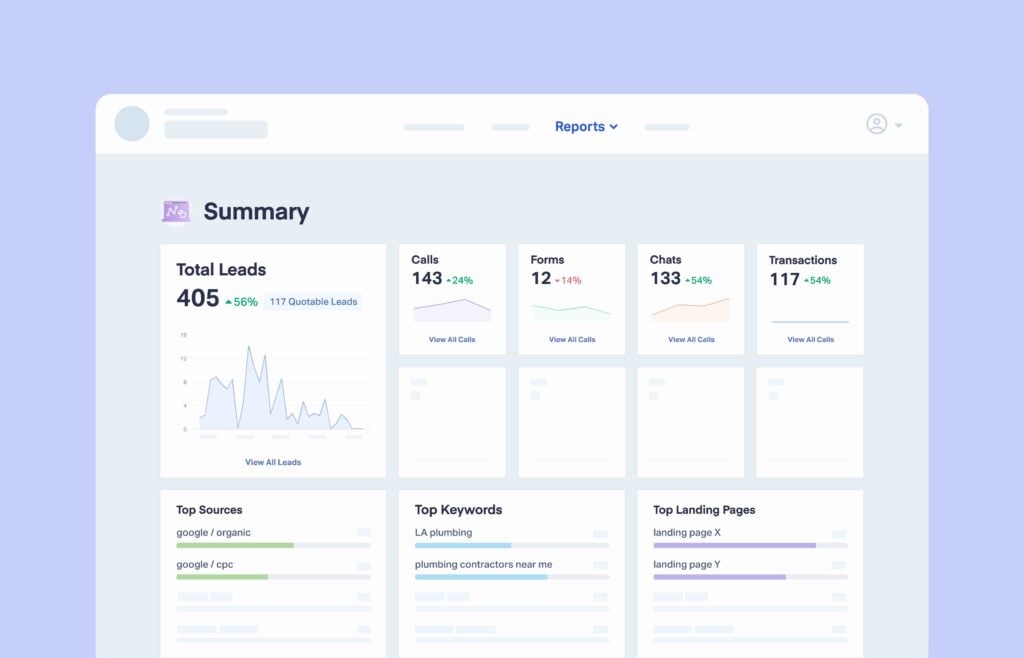
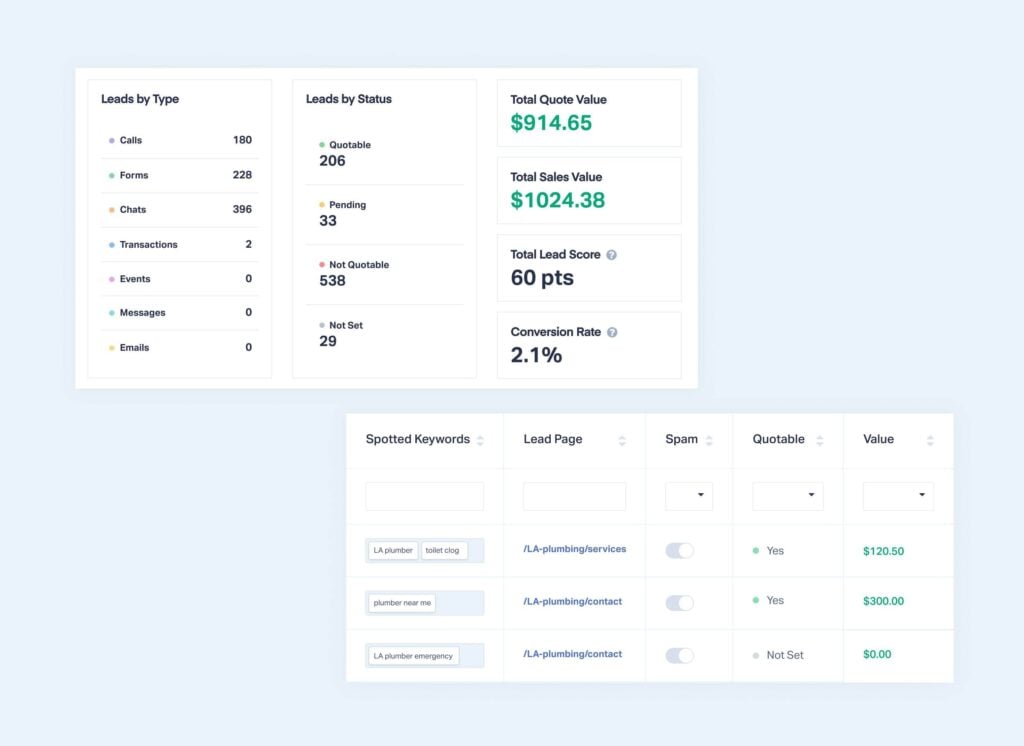
With this report (shown above), you can quickly show where leads are coming from, which marketing is performing well, and what the problem areas are. It includes several sections:
- Total leads for the month (405 leads)
- Number of leads compared to the previous month (56% increase from 260)
- Number of quotable leads for the month (117 quotable leads)
- Number of leads by conversion type (143 leads from calls, 12 leads from forms, 133 leads from chats, and 117 leads from transactions)
- The top 5 Sources and Mediums that contributed to the most leads (174 leads from Google/organic, 138 leads from Google/CPC, and so on)
- The top 5 keywords that contributed to the most leads (52 leads from Google/organic for the keyword “LA plumbing”, 78 leads from Google/CPC for the keyword “plumbing contractors near me”, and so on)
- The top 5 landing pages that contributed to the most conversions (84 leads converted on landing page “X”, 46 leads converted on landing page “Y”, and so on)
Let’s look at each part of the summary report in detail.
Lead Count Compared to Previous Month (and Quotable vs. Non-Quotable Leads)
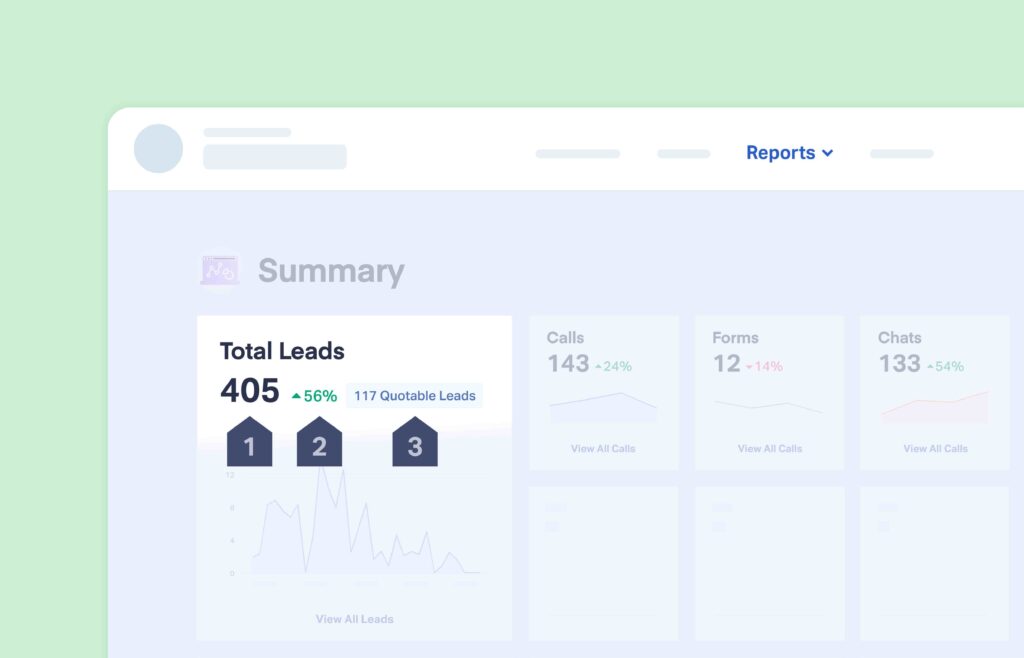
The part of this report that catches the eye most is the main summary. Here, clients can easily see how many leads your digital marketing campaigns generated, which is the main KPI clients care about. In this example, it’s 405 total leads for the month.
Per #2 in the screenshot above, you can easily see the growth in leads compared to the previous month. In this example, it was a 56% increase from 260.
Per #3, you can also see the number of quotable (a.k.a. qualified) leads for the month. In this example, it was 117 quotable leads — a 39% increase. Going the extra mile and showing clients their highest-value leads is a differentiator in itself, and can be a selling point for your agency.
Note: Click here for information on how you (or your clients) can qualify leads and then pull that data into WhatConverts. You can also use Lead Intelligence to automatically qualify leads. For more on this powerful feature, take a look at this guide.
Client Reporting Tips: Click “View All Leads”
Most marketing agencies have been asked, “How do I know these are actually good leads?”
WhatConverts makes it easy to drill down into the specifics of each lead generated, right from your reports (a.k.a. Interactive Reporting). Then you can quickly see if leads are new or repeat, spam, have a high intent to buy, and more—all in a few clicks.
That way, you can answer client questions and prove lead quality without having to say, “I’ll get back to you.”
Number of Leads by Conversion Type
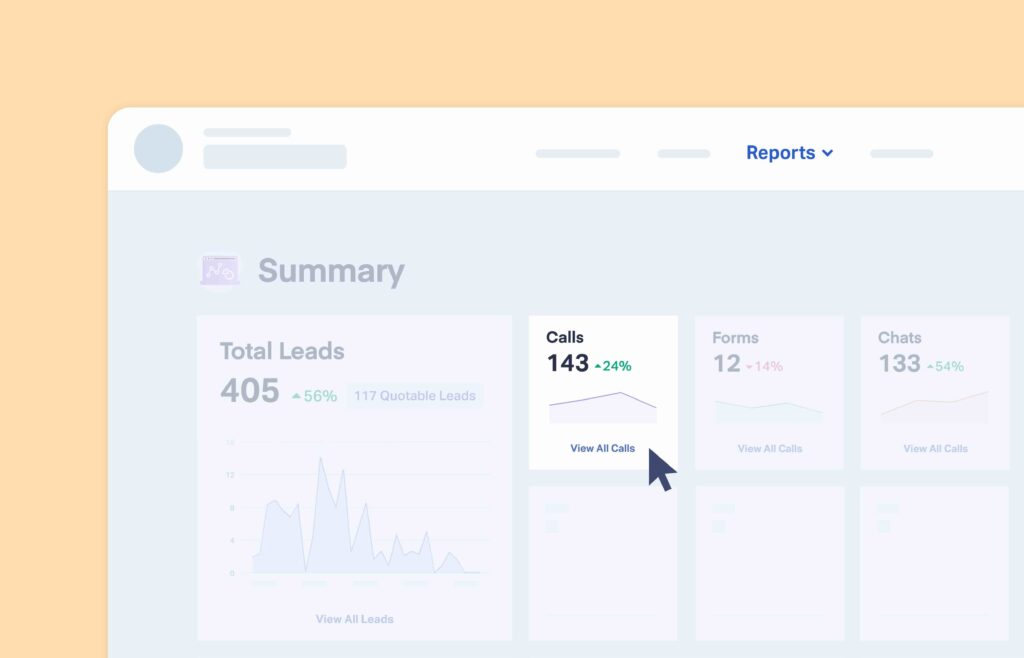
The next part of the report shows the number of leads by conversion type.
In this example, there were 405 total leads, and at a glance, your clients can see how many of them came from calls vs. forms vs. transactions vs. chats.
In addition, this section of the report shows if there was an increase or decrease in leads by conversion type compared to the previous month. This is valuable because if, for example, the number of form conversions dropped drastically compared to the previous month (e.g., 120 form conversions down to 10 form conversions), there may be a technical issue with your form setup, so it gives you a chance to identify and troubleshoot the problem.
Note: Beyond reporting, WhatConverts lets agencies capture and track each lead that comes in from forms, calls, chat, or transaction. This article is focused on reporting, but you can read more about our lead tracking features here.
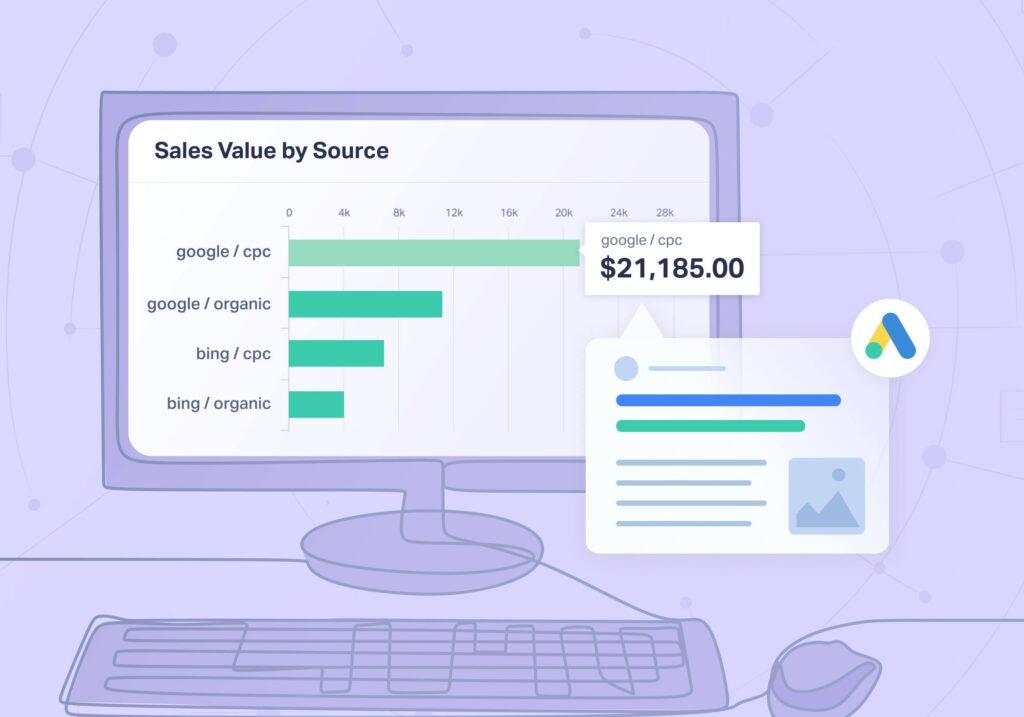
Number of Leads by Source and Medium
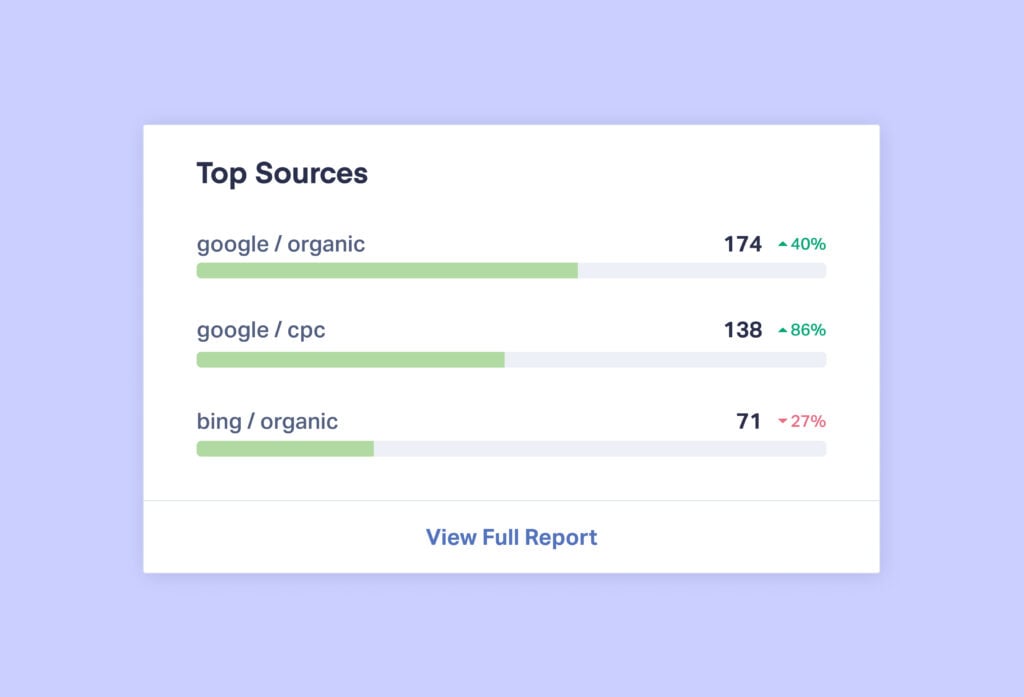
In the next section of the report, you can see the Source and Medium that contributed to the most leads. In this example, out of the 405 total leads for the month, 174 leads came from Google/organic, 138 leads from Google/CPC, 71 leads came from direct, and so on. In addition, you can see whether a particular Source/Medium had an increase or drop in total leads compared to the previous month.
So, as an example, if your client is paying you to run Google and Facebook Ads, and you see a decline in total leads from Facebook, it could be because the CPC for Facebook Ads was higher than the previous month. If that’s indeed the case, and the higher CPC on Facebook now makes that marketing channel less profitable, then perhaps it’s worth shifting more spend towards Google Ads.
This is all viewable instantly in our report — without the need to export data from Facebook and Google Ads separately and spend hours consolidating it to the same format and typing it up into a PowerPoint presentation (as many agencies do every month).
Number of Leads by Keyword
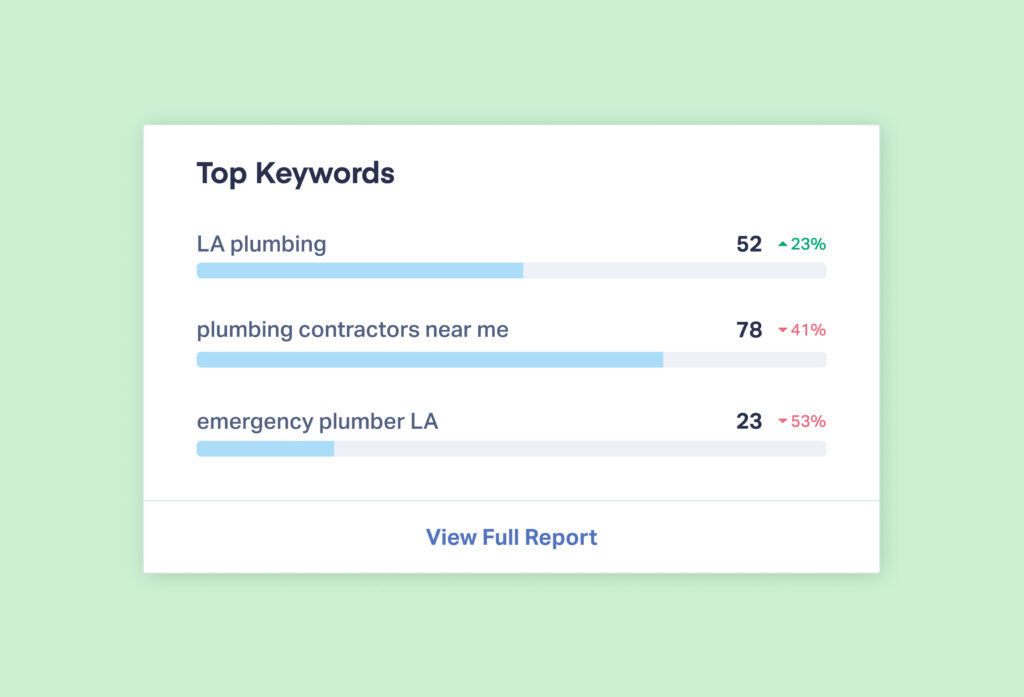
In the next section of the report, you can see the keywords that contributed to the most leads.
For example, in the above screenshot, 52 leads originated from keyword “LA plumbing”, 78 leads came from keyword “plumbing contractors near me”, and so on. In addition, you can see whether leads from a certain keyword increased or decreased compared to the previous month, and get ahead of any potential problems.
Again, to present this data to clients, most agencies have to download keyword lists from Google Ads and Search Console for SEO, and manually assemble them into tables, spreadsheets, or Google Data Studio.
Client Reporting Tip: SEO/PPC Gap Analysis Strategy
If you discover high ROI keywords from Google Ads, you can approach your client with the idea of targeting those same keywords via SEO. They’d be likely to agree since it would lower their customer acquisition cost, and it could be an additional source of revenue for your agency.
WhatConverts makes it easy to spot these opportunities right within your reporting. To learn more about how to do it, check out The SEO vs. PPC Gap Analysis Playbook.
Number of Leads by Landing Page
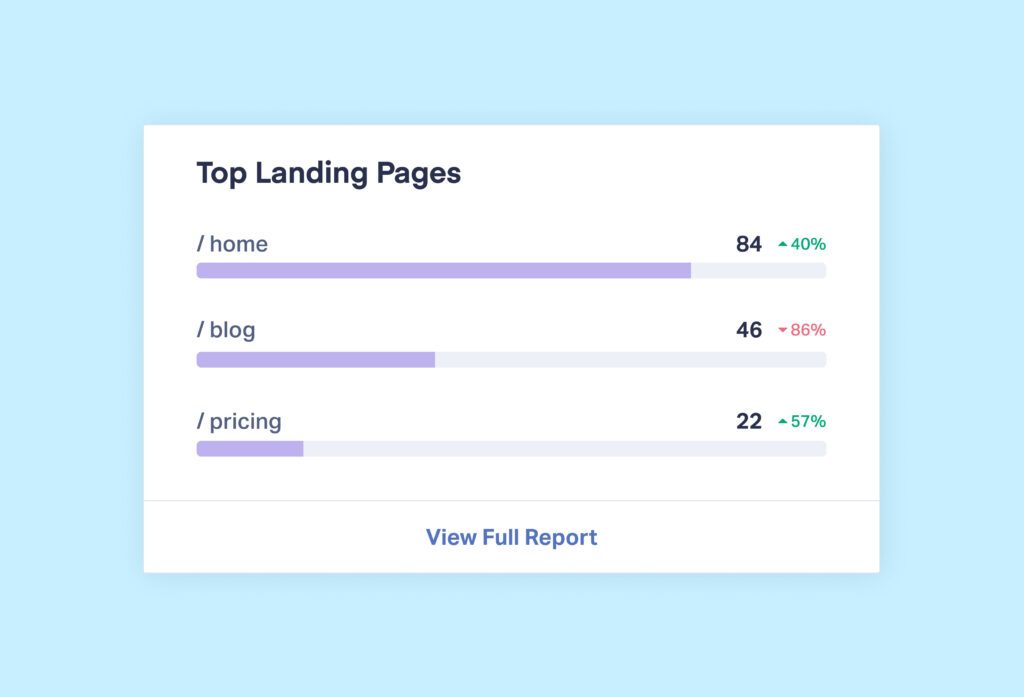
The final part of the report shows you the landing pages (URLs) that contributed to the most conversions.
In the example above, 84 leads converted on one URL, 46 leads converted on another, and so on.
Again, you can see an increase/decrease in total leads month-to-month, and build trust with clients by communicating potential issues ahead of time (and how you plan to solve them).
Note: Seeing leads by landing page is especially valuable for agencies who do SEO, since you can use blog page URLs as an indicator of what organic keywords resulted in conversions (measuring conversions and ROI from Google/organic is notoriously challenging).
Lead-Driven Report Templates
As we’ve discussed, most clients want an easy-to-scan report on the leads you generate for them, and that’s exactly what the Monthly Summary Marketing Report displays.
Because of that, it’s the most useful reporting feature that WhatConverts offers (and we hear that feedback time and time again from agencies).
That being said, depending on your agency’s workings, you could also send clients some of our lead-driven report templates below:
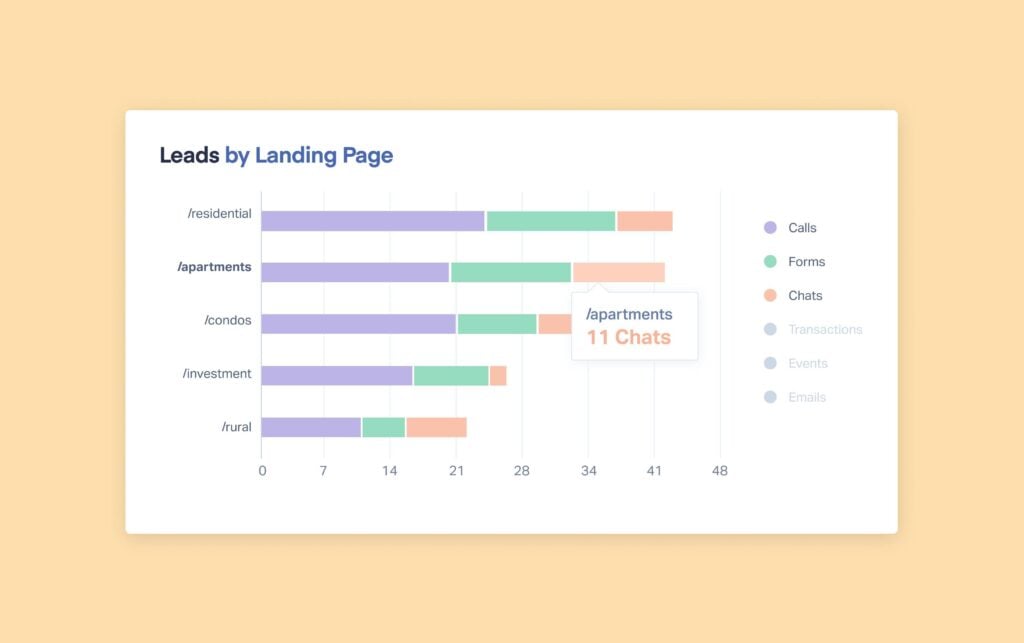
Leads by Landing Page (see more details about this report)
Leads by Keyword (see more details about this report)
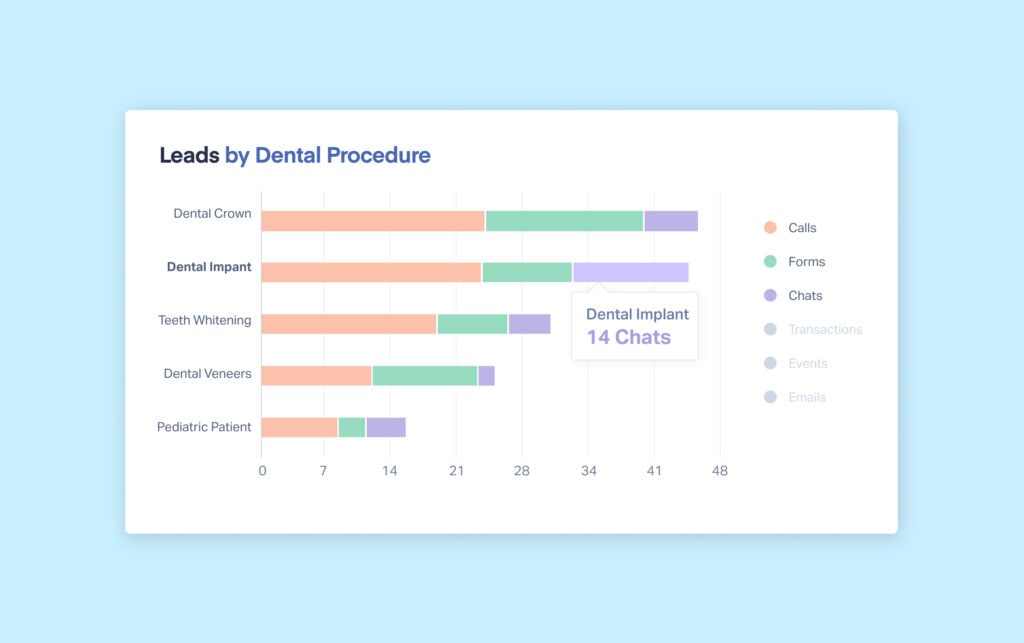
Leads by Requested Service (see more details about this report)
Leads by Brand/Product (see more details about this report)
Leads by Location (see more details about this report)
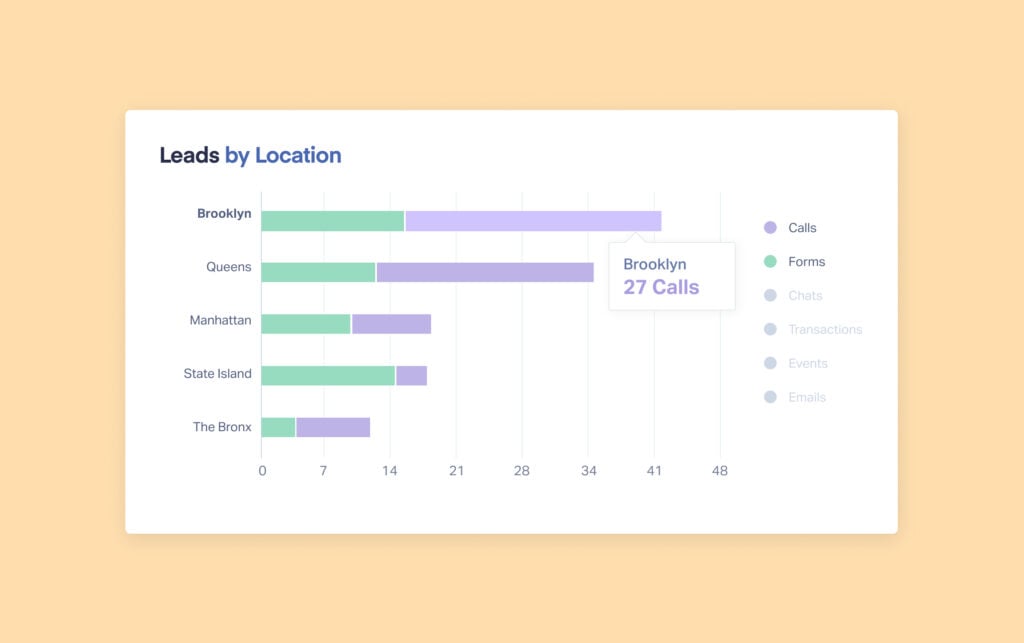
Note: These are just a few of our lead-driven report templates that you can send to clients. Click here to see a more expansive list, as well as get more info on the reports mentioned above.
Custom Reports
As we touched on earlier, unlike other marketing reporting tools on this list, WhatConverts does more than just reporting. It also captures and tracks each lead that comes in from forms, calls, chat, or transactions, along with relevant marketing details such as:
- Which pages, keywords, or ads they converted from
- Which marketing campaigns/sources they came from
- Whether they’re qualified or not
- Their quote/sales value
- And the list goes on. We capture over 70 different data points about each lead, and you can also add your own custom fields
You can then use our Report Builder to create custom reports — using a combination of up to 5 data points that are most relevant to your client(s).
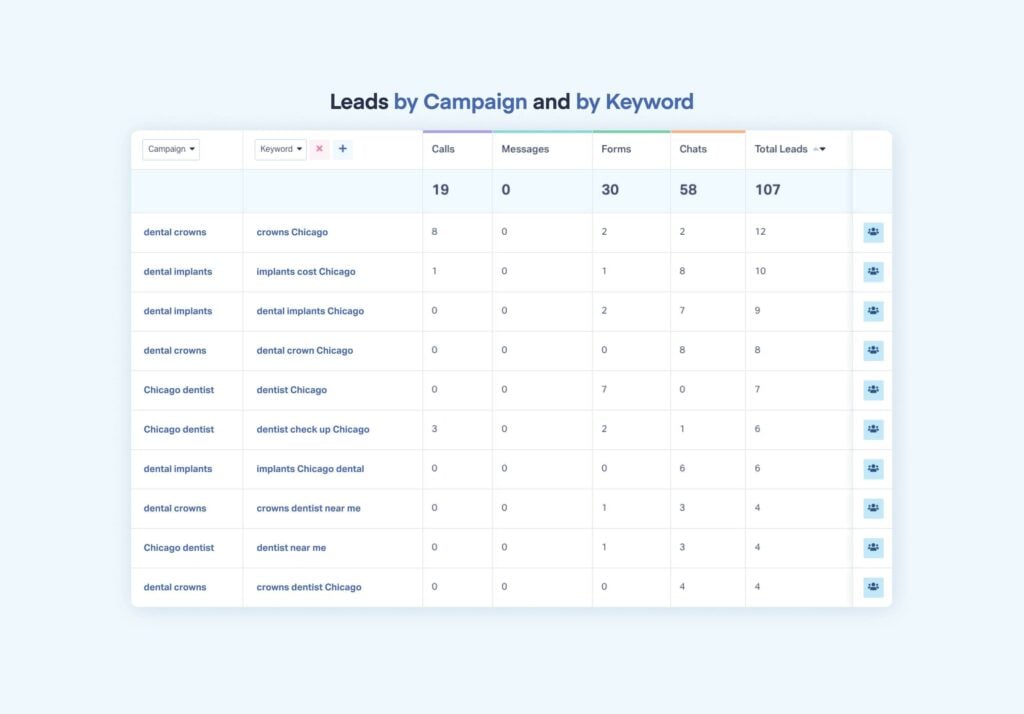
For example, say you have a client who is a Chicago area dental office and they want to know which ads, keywords, and landing page combinations are working well. In WhatConverts, you could generate a report to show leads from the top ad/keyword/landing page combinations in seconds, with just a few clicks:
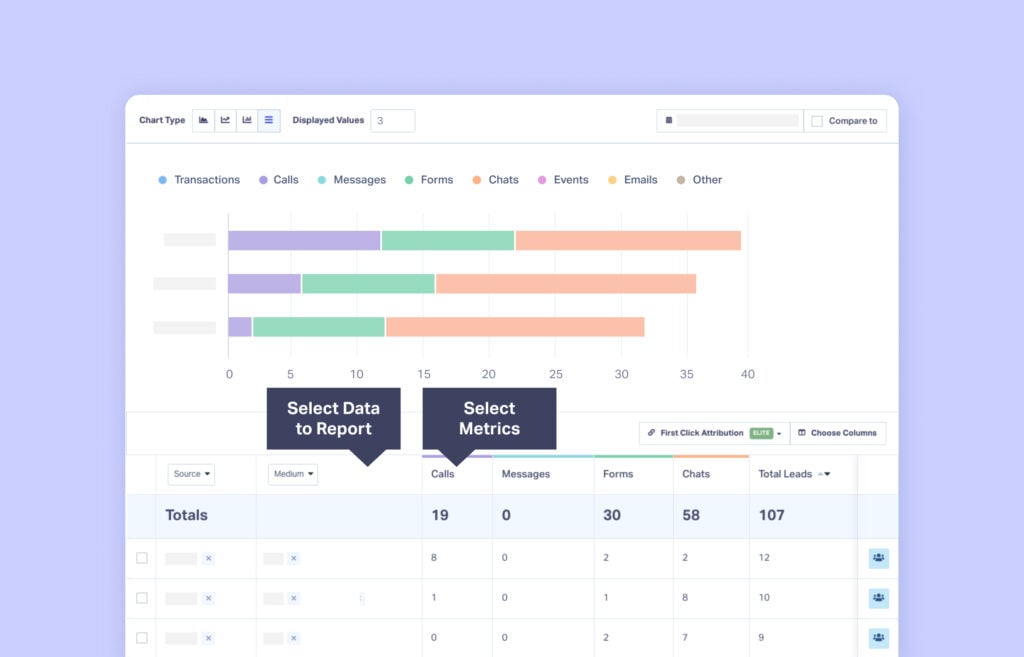
Start by selecting three data points:
- Keyword
- Ad
- Landing Page
Once you select those data points, the report is instantly built, showing you (and clients) the combination of Keyword + Ad + Landing Page that drives the most leads.
Per the screenshot below, you can even add another dimension to the report: Quote Value. This allows you to see the Keyword + Ad + Landing Page combination that drove the most revenue (which is a more accurate indicator of success than number of leads).
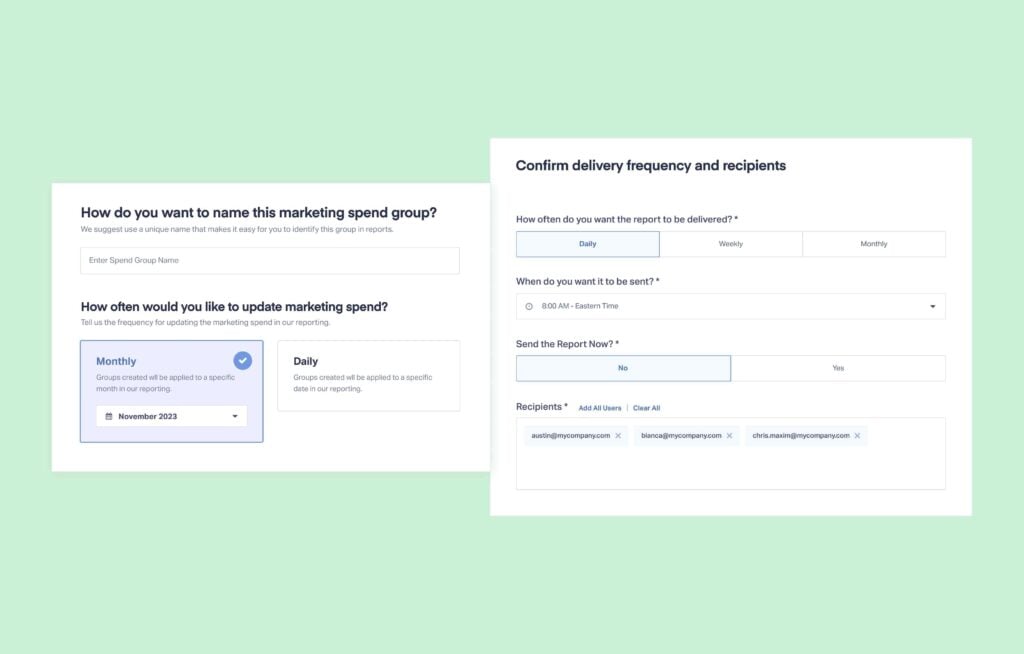
These are just two examples. You can create as many custom reports as you’d like using the relevant data points for each client, save them, and then schedule them to be sent via email. Your clients can also log in and view the reports via our dashboard.
Notably, these custom reports require no coding, no database queries, no hours spent reading help files or watching videos. They are all a few intuitive clicks away from our default reports and built so marketers can easily generate them on their own.
In addition, if you white label WhatConverts, you can create a custom domain name for your clients to view the marketing results, and your branded logo will be included in the (1) dashboard and (2) all reporting emails.
Client Reporting Tip: Use Dimension Grouping
One of the best ways to keep your clients happy is by putting your reporting into terms they will understand. Dimension Grouping in WhatConverts lets you do just that.
For example, say you’re running marketing for a dentist and you want clients to easily spot which product landing pages are working best. You can use Dimension Grouping to group any landing page with a URL containing “implant” into a “Dental Implant” landing page group.
So rather than seeing results for 15 different implant URLs, your clients will see the total results for all those pages in one group.
WhatConverts Reviews
Agencies love doing their client reporting and lead capturing with WhatConverts. It’s why 36,000+ marketers use it every day.
But don’t just take our word for it. Below are a few WhatConverts reviews from the top third-party software review site, G2. (see more G2 reviews here)
WhatConverts Pricing
Free Trial Available: YES
WhatConverts pricing packages are divided into two groups: one for individual businesses and one for marketing agencies.
| Individual Businesses | Marketing Agencies |
| Call Tracking – $30/mo – Everything you need to effectively track, manage, and gather insights from your calls (includes $30 free usage credit). | N/A |
| Plus – $60/mo – Everything in Call Tracking plus the ability to track any lead type, integrate with top marketing platforms, and run even more robust reporting (includes $30 free usage credit). | Plus – $500/mo – Everything in Call Tracking plus the ability to track any lead type, integrate with top marketing platforms, and run even more robust reporting (includes $250 free usage credit). |
| Pro – $100/mo – Everything in Plus as well as Call Flows, custom reporting with Report Builder, Scheduled Reporting, API Access, and more (includes $30 free usage credit). | Pro – $800/mo – Everything in Plus as well as Call Flows, custom reporting with Report Builder, Scheduled Reporting, API Access, and more (includes $300 free usage credit). |
| Elite – $160/mo – Everything in Pro along with Lead Intelligence, full Customer Journey tracking, Multi-Click Marketing Attribution, and more (includes $30 free usage credit). | Elite – $1250/mo – Everything in Pro along with Lead Intelligence, full Customer Journey tracking, Multi-Click Marketing Attribution, and more (includes $400 free usage credit). |
There are plenty of other features not listed here, too. So check out the WhatConverts pricing page below to learn more about each package. Be sure to try out the on-page pricing calculator to get a package perfectly tailored to your needs.
Want to Try WhatConverts for Yourself?
Start your free 14-day trial or see WhatConverts in action via a live demo. We’ll answer questions and guide you through how to best leverage our tool to create lead-driven, easy-to-understand reports that your clients appreciate.
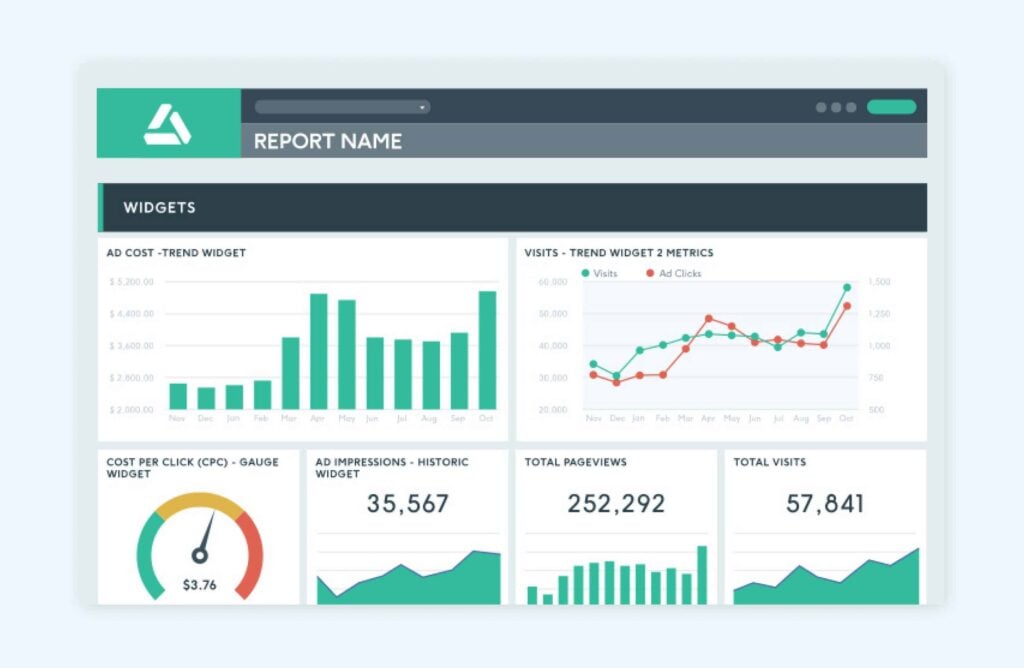
2. AgencyAnalytics (9.4/10)
Automated Dashboard Reporting Tool Specifically for Agencies (w/ Report Templates)
- Marketing Reporting Software: Data Aggregator
- Reporting Type: KPI Snapshot (static)
AgencyAnalytics Overview
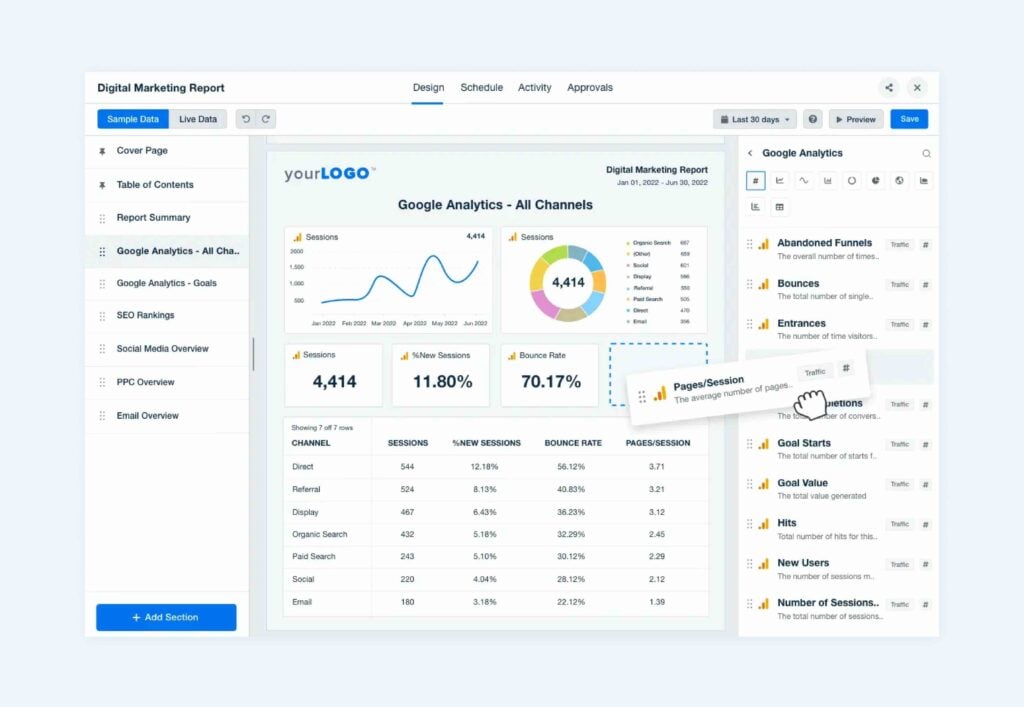
As a data aggregator, AgencyAnalytics doesn't track marketing data on its own. However, it can pull in data from platforms like WhatConverts to create beautiful, customizable reports that show lead, quote, and sales value of your marketing.
Using it is as easy as dragging and dropping data source widgets onto a blank digital marketing reporting dashboard.
It offers plenty of customization options for client reporting, including:
- Custom logos
- Custom color schemes
- Custom domain (on higher plans)
- Custom email (on higher plans)
- Campaign white labeling (on higher plans)
AgencyAnalytics Marketing Report Templates
Beyond from-scratch reporting, you can also create a new reporting dashboard using their preset client reports templates, some of which include:
Unique AgencyAnalytics Features
What makes AgencyAnalytics unique from other third-party reporting software is that it has features that larger marketing agencies may find useful.
Features like:
- Ability to export reports as both PDFs and XLS file types
- Rank tracking
- Site auditing
- PPC markup
- Goal pacing
It also offers 75+ integrations for every plan, including the most basic.
AgencyAnalytics Integration in WhatConverts
AgencyAnalytics also integrates with WhatConverts, so that clients can get more enhanced data on their lead generation campaigns (i.e., total number of leads by phone/form/chat, repeat and unique leads, and so on).
Get more detail on the AgencyAnalytics integration here.
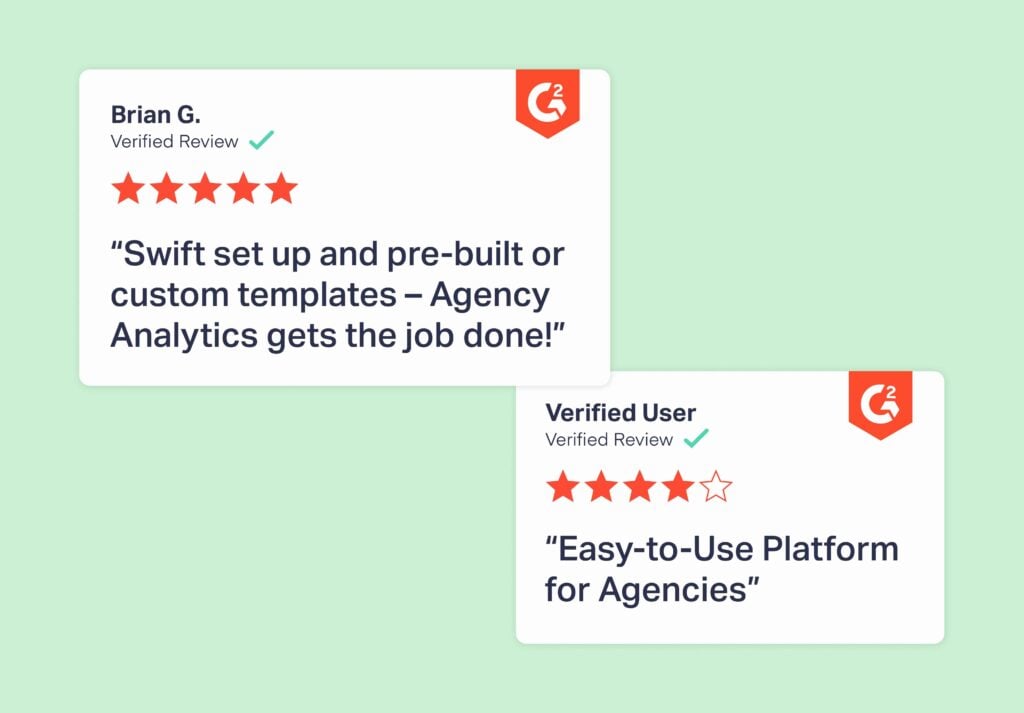
AgencyAnalytics Reviews
Below are a few AgencyAnalytics reviews from the top third-party software review site, G2. (see more G2 reviews here)
AgencyAnalytics Pricing
Free Trial: YES
AgencyAnalytics has three plans to choose from.
| Plan | Price |
| Launch – (Freelancers + Small Agencies) Includes unlimited reports, report scheduling, 80+ data integrations, client access portal, basic branding | $59/mo – Includes 5 client campaigns, $10/mo per additional campaign |
| Grow – (Growing Agencies) Includes AI features, metric alerts, goal & budget tracking, ad spend markup, full branding | $179/mo – Includes 10 client campaigns, $15/mo per additional campaign |
| Perform – (Medium to Large Agencies) Includes benchmark comparisons, trend forecasting, anomaly detection, data aggregation, priority support & training | $349/mo – Includes 15 client campaigns, $20/mo per additional campaign |
If you want to learn more about AgencyAnalytics pricing, check out their pricing page below.
3. Looker Studio/Google Data Studio (8.8/10)
Google Reporting Great for Combining Google Ads, Analytics, & WhatConverts Data
- Marketing Reporting Software: Data Aggregator
- Reporting Type: KPI Snapshot (static)
Features Overview
Formerly Google Data Studio, Looker Studio is Google’s own marketing reporting platform.
Since it was developed by Google, Looker Studio has powerful integrations with other Google products (Google Ads, Google Analytics, etc.).
Looker Studio offers plenty of white label options to remove references to Looker in your reporting, like:
- Custom logos
- Removal of Looker Logo and Links in Alerts
- Email subscription options
- Download PDFs and embed without logo
However, you’ll need to unlock Private Label (must contact sales for pricing).
Looker Studio Marketing Report Templates
With Looker Studio, you can choose to start from scratch with a blank report or select from their library of marketing report templates.
The library contains marketing report templates like:
Unique Looker Studio Features
Looker Studio is unique in that it is reporting software that’s owned and developed by Google.
As a result, it offers strong integrations with Google platforms like Google Ads, Google Analytics, and Google Search Console.
Other native Google data sources include:
- YouTube
- Google Sheets
- BigQuery
- Amazon Redshift
- Cloud Spanner
Looker Studio also integrates with other products using 850+ different connectors, including WhatConverts.
As a result, it’s one of the best marketing reporting tools for combining Google Ads, Google Analytics, and WhatConverts data.
Looker Studio Integration in WhatConverts
Looker Studio does integrate with WhatConverts via a connector. As a result, you can combine metrics from Google Ads and Analytics with lead tracking data from WhatConverts (qualified leads, qualified leads by campaign, lead value, sales value, etc.) in your Looker Studio reporting.
Get more detail on the Looker Studio integration here.
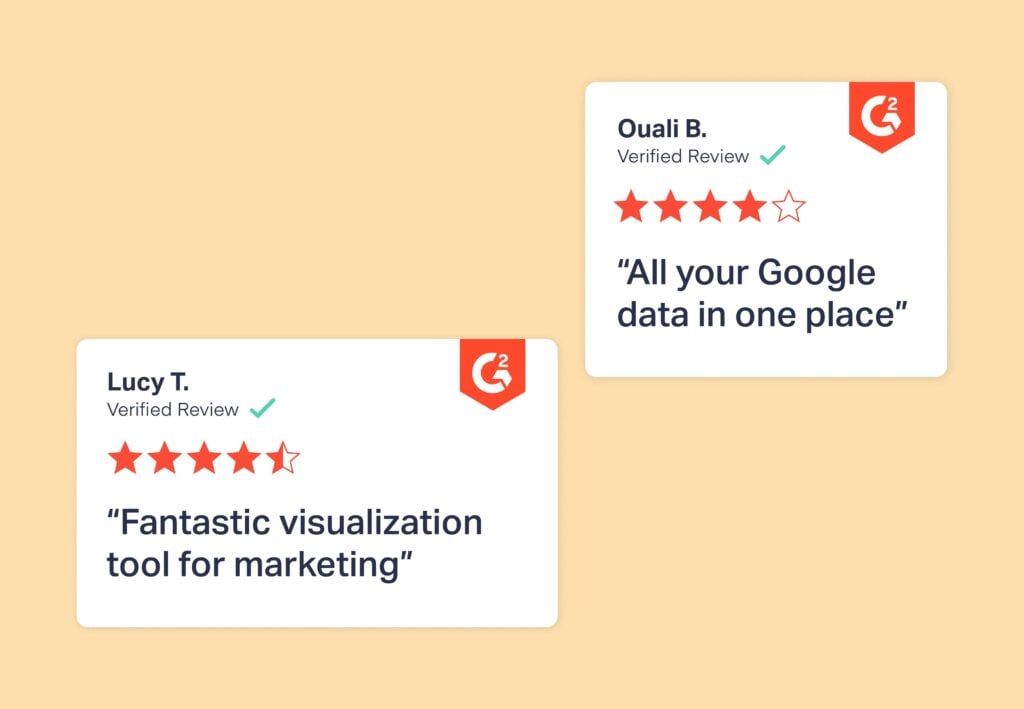
Looker Studio Reviews
Below are a few Looker Studio reviews from the top third-party software review site, G2. (see more G2 reviews here)
Looker Studio Pricing
Free Trial: N/A (free to use)
Looker Studio is completely free to use and view reports from. All you need is:
To Create Reports:
- Have and are signed into a Google Account
- Are located in a supported country
- Accept the Looker Studio Terms of Service and Policies
To View Reports:
- A browser and internet connection
Looker Studio Pro is the paid version, which offers enterprise features like access management tools and additional scheduled reporting. To learn more about Looker Studio Pro pricing, contact Google Sales below.
4. DashThis (9.4/10)
User-Friendly Dashboard Reporting + Custom Designed Reports (w/ Report Templates)
- Marketing Reporting Software: Data Aggregator
- Reporting Type: KPI Snapshot (static)
DashThis Overview
With DashThis, instead of analyzing the results from all your marketing platforms separately, you can gather them into the same report/dashboard, similar to AgencyAnalytics.
DashThis has several white-label options for client reporting, including:
- Custom logo
- Preset color themes
- Custom color themes (on higher plans)
- Custom domain (on higher plans)
- Custom email (on higher plans)
- White-labeled dashboards (on higher plans)
DashThis Marketing Report Templates
DashThis also lets you choose among dozens of preset marketing report templates rather than starting from scratch. These reports make it easy to quickly organize your digital marketing reporting dashboards for clients.
DashThis marketing report templates include:
Unique DashThis Features
DashThis has designers who can create custom-designed reports that match your brand.
Their interface is also a bit easier to navigate and use than other options, making it a good choice for smaller agencies. It also doesn’t require a lot of technical expertise in order to create great-looking reports.
DashThis Integration in WhatConverts
There is no native DashThis integration with WhatConverts. However, WhatConverts is able to integrate with many tools using Zapier.
If you’d like to see if DashThis can integrate with WhatConverts in this way, please reach out to our dedicated support team.
DashThis Reviews
Below are a few DashThis reviews from the top third-party software review site, G2. (see more G2 reviews)
DashThis Pricing
Free Trial: YES
DashThis has four plans to choose from.
| Plan | Price |
| Individual – 3 Dashboards Included – Unlimited users, integrations, and data sources. Does not include certain white label features and customer support tiers. | $42/mo |
| Professional – 10 Dashboards Included – Unlimited users, integrations, and data sources. Includes higher support tiers. Does not include certain white label features. | $127/mo |
| Business – 25 Dashboards Included – Unlimited users, integrations, and data sources. Includes higher support tiers and white label features | $246/mo |
| Standard – 50+ Dashboards Included – Unlimited users, integrations, and data sources. Includes higher support tiers and white label features | $382/mo |
If you want to learn more about DashThis pricing, check out their pricing page below.
5. TapClicks (8.6/10)
Enterprise-Level Marketing Operations Platform with Reporting
- Marketing Reporting Software: Data Aggregator
- Reporting Type: KPI Snapshot (static)
TapClicks Overview
TapClicks lets you create custom, branded reports for your agency (which you can then schedule for automatic delivery to clients).
One of TapClicks’ strengths is its easy-to-build widgets, which help provide insights on the key metrics that are most important to your clients.
For example, you could use “Facebook” as the data source, and the metrics you can select are “Engaged Users”, “Likes”, “Unlikes”, “Total Likes”, and “Total Reach”.
They also offer client report white labeling features like:
- Custom logos
- Custom color themes
Unique TapClicks Features
TapClicks includes a lot more than just marketing reporting.
It also offers features like:
- Site auditing
- Backlink building
- Keyword research
- Rank tracking
- Task management
For some agencies, these features might be more than what’s needed, making onboarding and setup more complicated than expected.
TapClicks Integration in WhatConverts
WhatConverts does have a native integration with TapClicks. With it, you can enhance your reporting with much more detail on which of your marketing is generating valuable leads.
You can get more detail on the TapClicks integration with WhatConverts here.
TapClicks Reviews
Below are a few TapClicks reviews from the top third-party software review site, G2. (see more G2 reviews here)
TapClicks Pricing
Free Trial: YES
TapClicks has three plans to choose from.
| Plan | Price |
| TapDataLite – (Small Companies & Marketers) Includes 64 Connectors and SmartConnector Basic. | Starting at $99/mo |
| TapData+ – (Growing Teams) 250+ Connectors and SmartConnector Plus. | Starting at $349/mo |
| TapData Max – 250+ Connectors and basic SmartConnector | Starting at $649/mo |
If you want to learn more about TapClicks pricing, check out their pricing page below.
6. ReportGarden (9.0/10)
Plenty of White Label Features (Including Client Proposals)
- Marketing Reporting Software: Data Aggregator
- Reporting Type: KPI Snapshot (static)
ReportGarden Overview
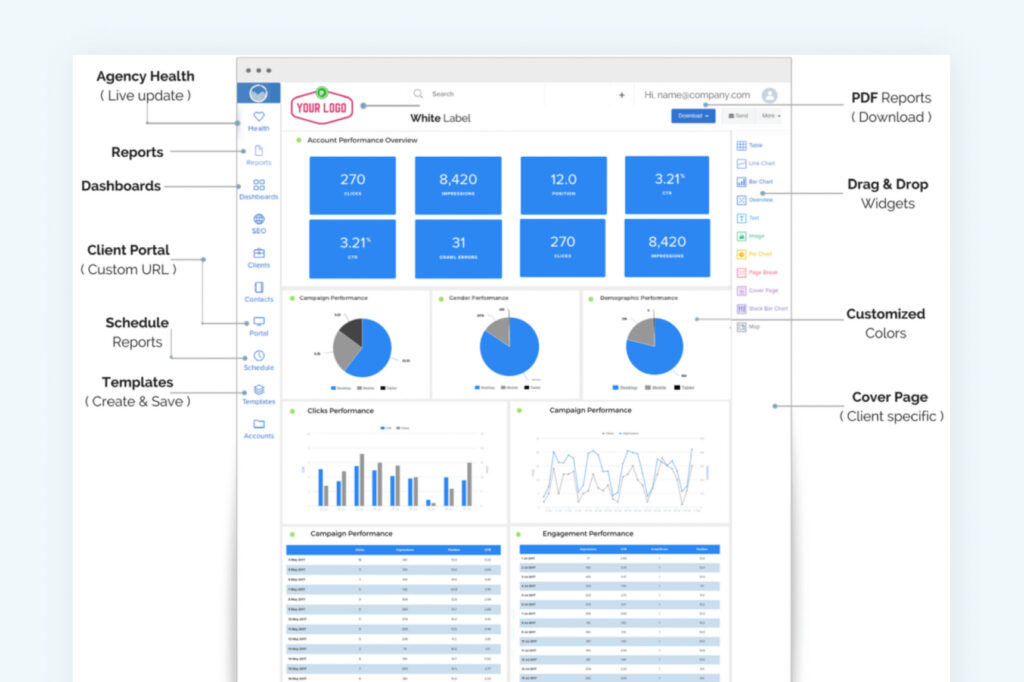
ReportGarden is a sophisticated platform that allows you to automate your PPC reports, social media reports, and SEO reports. They offer multi-channel reporting with a wide range of widgets and templates for you to choose from.
In addition, ReportGarden lets you manage client PPC budgets across all platforms, audit your client’s keywords, backlinks, and on-page SEO — all in one place.
They also include white-label features for branded client reporting, including:
- Custom logos
- Custom color themes
- Customized cover pages
- Custom email branding
- Custom client portal branding
Unique ReportGarden Features
Something that’s unique about ReportGarden is that you can create custom client proposals using pre-made marketing templates (i.e., SEO proposal, social media proposal, etc.) within their platform.
They also have a client portal where clients can log in and see their campaign performance on their own (similar to WhatConverts).
ReportGarden Integration in WhatConverts
WhatConverts does have a native integration with ReportGarden. With it, you can enhance your reporting with much more detail on which of your marketing is generating valuable leads.
You can get more detail on the ReportGarden integration with WhatConverts here.
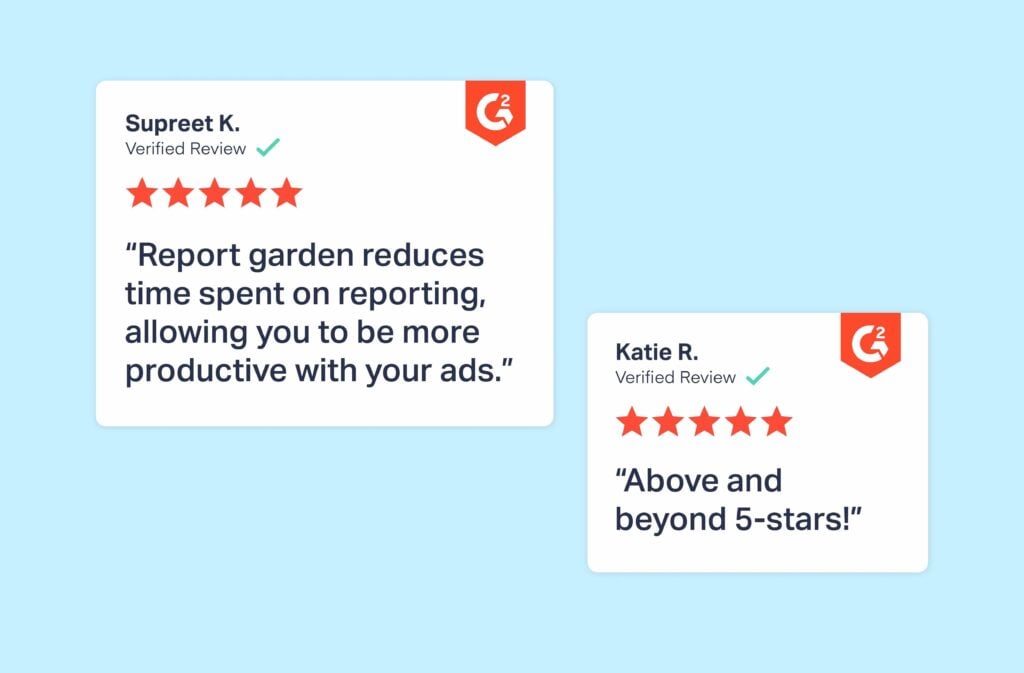
ReportGarden Reviews
Below are a few ReportGarden reviews from the top third-party software review site, G2. (see more G2 reviews here)
ReportGarden Pricing
Free Trial: YES
ReportGarden has four plans to choose from.
| Plan | Price |
| Basic – Includes up to 10 data sources, up to 5 users, and integrations with Analytics, Google Ads, Search Console, and more. | $74/mo |
| Standard – Includes up to 30 data sources, up to 20 users, a custom domain, and integrations with Facebook and Bing. | $124/mo |
| Professional –Includes up to 70 data sources, free onboarding, and role based user access. | $249/mo |
| Enterprise –Unlimited users, custom quotes for integrations, monthly team training, whiteglove services. | Contact Sales |
If you want to learn more about ReportGarden pricing, check out their pricing page below.
7. Whatagraph (9.0/10)
Good for Agencies w/ At Least 40+ Data Sources
- Marketing Reporting Software: Data Aggregator
- Reporting Type: KPI Snapshot (static)
Whatagraph Overview
Whatagraph is a marketing reporting tool that can help marketers create compelling reports in minutes rather than hours. Built by marketers for marketers, you can use it to connect 40+ data sources and have the data go straight to your reports, with no extra work.
Whatagraph also offers white-label client reporting features like:
- Custom branding (for a fee)
- Custom domain (for a fee)
However, some users report a lack of customization with white-label features in Whatagraph.
Unique Whatagraph Features
One of Whatagraph’s main differentiators is that it’s designed to make it easy to incorporate data from a lot of sources right off the bat.
For example, its starter plan lets you connect 25-50 sources to your reporting (most other tools start with 10 sources). However, this comes with a pricing tradeoff as basic plans start at $223/mo.
Whatagraph also doesn’t use connectors. That means it gets its data directly from your sources, ensuring the best data integrity possible.
Whatagraph Integration in WhatConverts
There is no native Whatagraph integration with WhatConverts. However, WhatConverts is able to integrate with many tools using Zapier.
If you’d like to see if Whatagraph can integrate with WhatConverts in this way, please reach out to our dedicated support team.
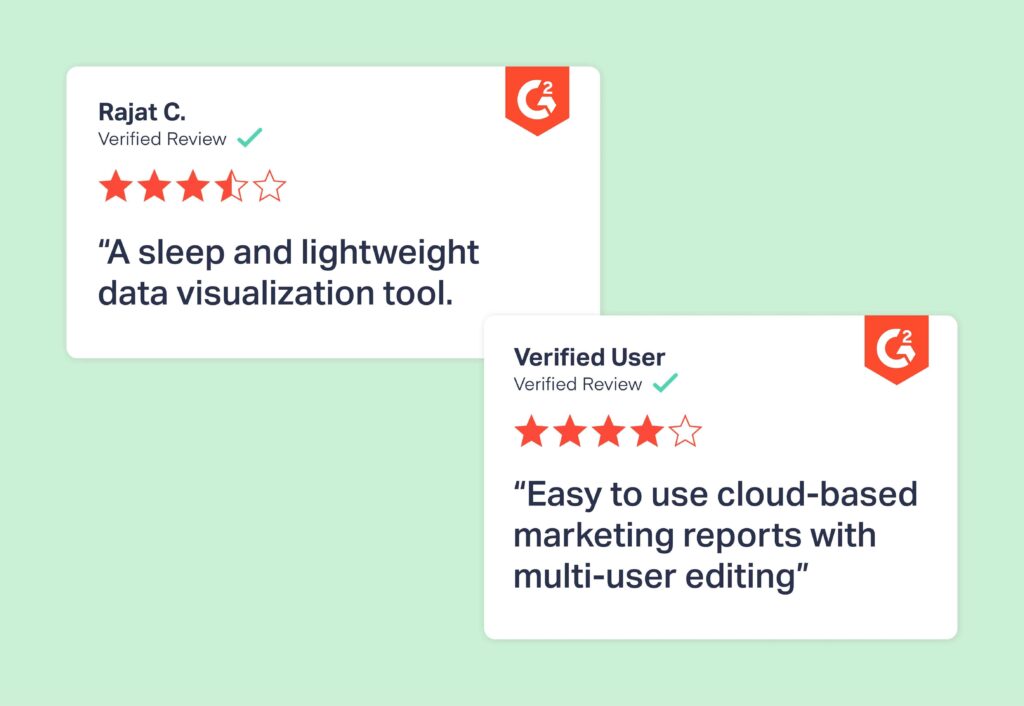
Whatagraph Reviews
Below are a few Whatagraph reviews from the top third-party software review site, G2. (see more G2 reviews here)
Whatagraph Pricing
Free Trial: YES
Whatagraph no longer has public pricing information. If you want to learn more about Whatagraph pricing, check out their pricing page below.
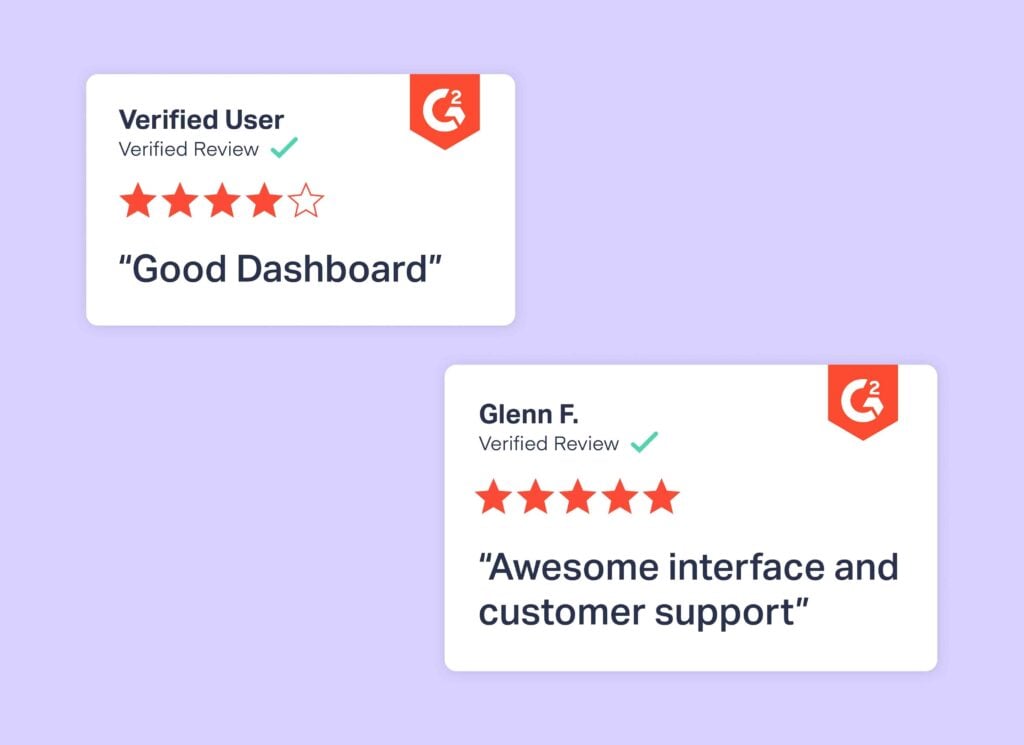
8. Reportz (9.6/10)
Useful for Freelancers & Small-Scale Agencies
- Marketing Reporting Software: Data Aggregator
- Reporting Type: KPI Snapshot (static)
Reportz Overview
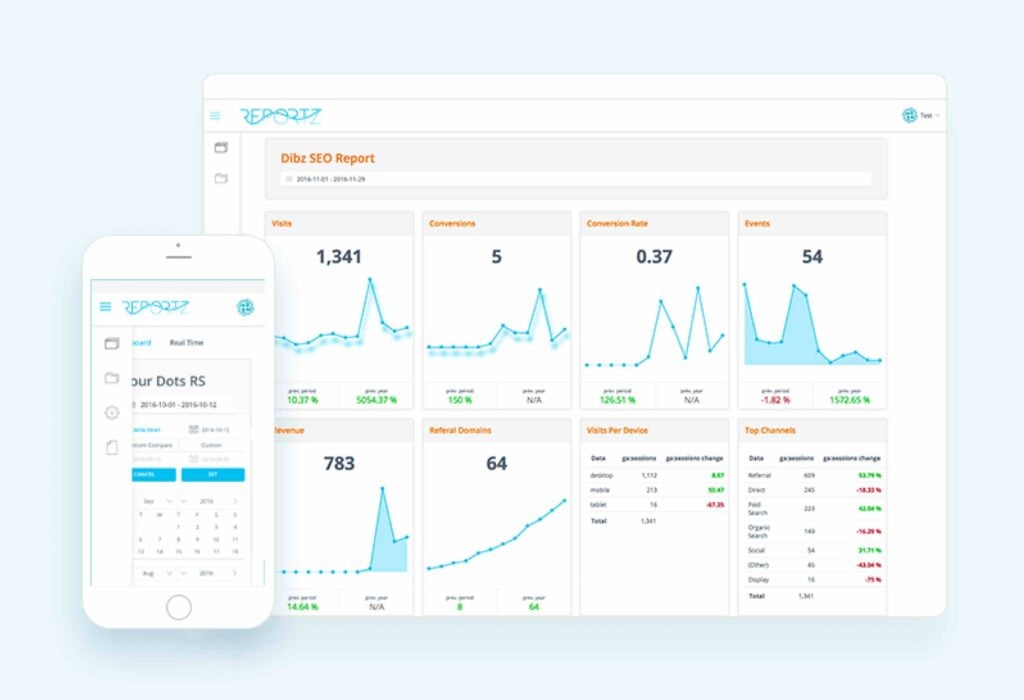
Reportz lets you build clean, concise reports whenever you need them, without having to put information together manually. In just a few minutes, you can see whatever you need across your paid campaigns, SEO KPIs, social media, link building, and so on.
It integrates with many popular platforms like Google Analytics, Ahrefs, Google Ads, Rank Ranger, and more.
In addition, Reportz is available as a white-label solution for client reporting.
It offers:
- Custom logo
- Custom domain
- Custom site name
Unique Reportz Features
Reportz is a solid option for freelancers and small agencies because of its custom pricing model.
Rather than force users to pay for more digital marketing reporting dashboards than they need, Reportz lets you select how many dashboards you want and only pay for what you use.
The reports you can build with this tool are also highly customizable since there’s no limit to the number of widgets you can use.
Reportz Integration in WhatConverts
There is no native Reportz integration with WhatConverts. However, WhatConverts is able to integrate with many tools using Zapier.
If you’d like to see if Reportz can integrate with WhatConverts in this way, please reach out to our dedicated support team.
Reportz Reviews
Below are a few Reportz reviews from the top third-party software review site, G2. (see more G2 reviews here)
Reportz Pricing
Free Trial: YES
Reportz has four plans to choose from.
| Plan | Price |
| Consultant – Includes 5 dashboards at $9.90 per dashboard. | $49.50/mo |
| Agency – Includes 20 dashboards at $9.60 per dashboard. | $192/mo |
| Enterprise – Includes 70 dashboards at $8.60 per dashboard. | $602/mo |
| Custom – Custom number of dashboards up to 75 at $8.50 per dashboard. | Use Price Estimator |
If you want to learn more about Reportz pricing, check out their pricing page below.
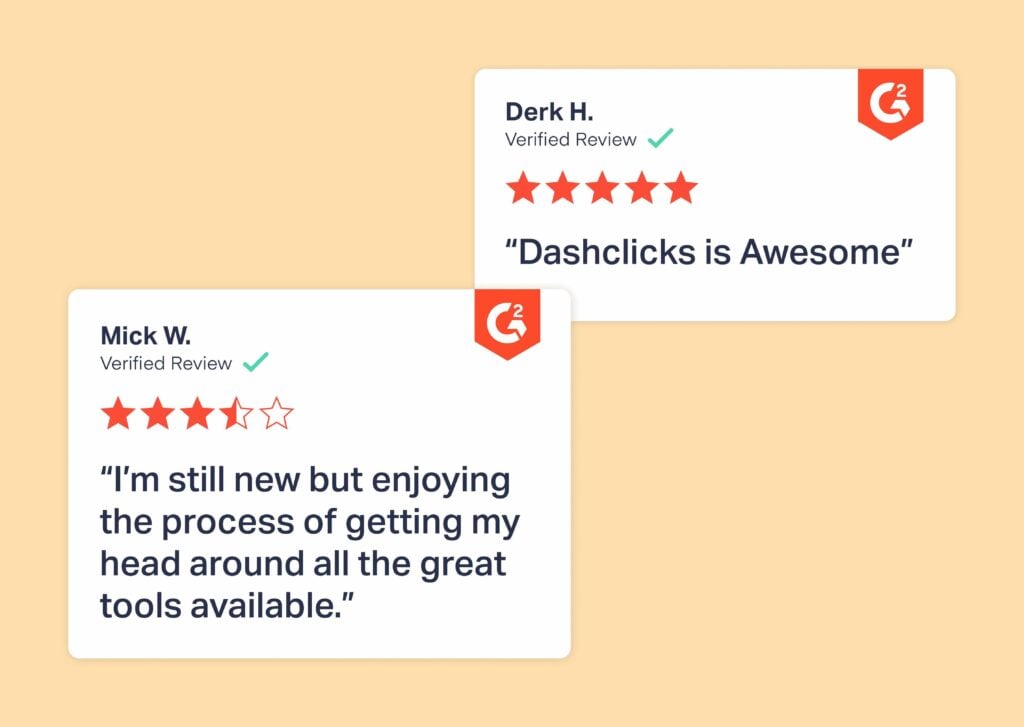
9. DashClicks (9.4/10)
Reporting + Marketing Fulfillment Software
- Marketing Reporting Software: Data Aggregator
- Reporting Type: KPI Snapshot (static)
DashClicks Overview
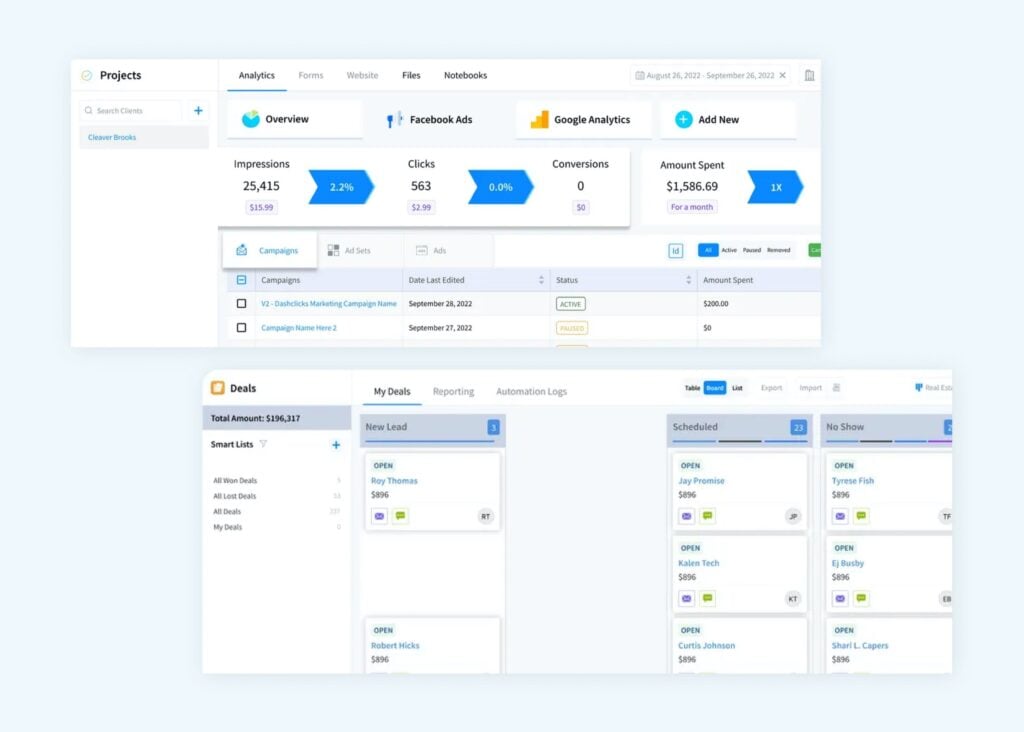
DashClicks’ Marketing Analytics Software helps you monitor and report on all of your digital marketing campaigns in a single place. The best thing about the software is you can view granular data insights fetched from various metrics. This helps you make smarter, well-informed decisions and drive better conversions.
DashClicks also makes white labeling your reporting simple.
Unique DashClicks Features
One thing that’s unique about DashClicks is that it comes with a lot of other features that some agencies may find useful. Features like:
- Marketing funnel builder
- Website builder
- Inbound lead distribution
- Reputation management
- Billing system
- Contact management
However, these features come pre-built into the only plan the tool offers. You can’t pick and choose which features your agency wants to lower the plan price. On top of that, the many tools can make the platform hard to navigate. Plus, reviews on the usefulness of these extra features are mixed.
DashClicks Integration in WhatConverts
There is no native DashClicks integration with WhatConverts. However, WhatConverts is able to integrate with many tools using Zapier. If you’d like to see if DashClicks can integrate with WhatConverts in this way, please reach out to our dedicated support team.
DashClicks Reviews
Below are a few DashClicks reviews from the top third-party software review site, G2. (see more G2 reviews here)
DashClicks Pricing
Free Trial: YES
DashClicks has just one plan to choose from.
- DashClicks Pro – $199/mo
If you want to learn more about DashClicks pricing, check out their pricing page below.
Wrapping Up
Marketing reporting lets agencies spot optimization insights and show clients the value of their marketing efforts. And with the right tool, you can both prove and grow your marketing ROI.
The only question is, which marketing reporting software is right for you?
- WhatConverts: Lead Tracking & Reporting Software for Agencies – Best Tool for Proving & Growing Your Marketing Value
- AgencyAnalytics: Automated Dashboard Reporting Tool Specifically for Agencies (w/Reporting Templates)
- Looker Studio (Google Data Studio): Google Reporting Great for Combining Google Ads, Analytics, & WhatConverts Data
- DashThis: User-Friendly Dashboard Reporting + Custom Designed Reports (w/Reporting Templates)
- TapClicks: Enterprise-Level Marketing Operations Platform with Reporting
- ReportGarden: Plenty of White Label Features (Including Client Proposals)
- Whatagraph: Good for Agencies w/ At Least 40+ Data Sources
- Reportz: Useful for Freelancers & Small-Scale Agencies
- DashClicks: Reporting + Marketing Fulfillment Software
Start your free 14-day trial of WhatConverts today or book a demo with a product expert to see how we help prove and grow your ROI.
Get a FREE presentation of WhatConverts
One of our marketing experts will give you a full presentation of how WhatConverts can help you grow your business.
Schedule a Demo
Grow your business with WhatConverts


