


 Amanda Pell
The "manufacturing" in "manufacturing benchmark" is doing a lot of heavy lifting.
B2B manufacturing's "average" CPL of $377 includes aerospace contractors selling jet components on 365-day cycles with automotive parts suppliers closing in two days. It combines $9.12 construction CPCs with $1.17 automotive CPCs and 22.5% gross margins with 35% margins.
Mid-market industrial manufacturers (building systems, specialty components, industrial equipment) get handed this number as if it's an accurate benchmark for their market. It doesn't. It barely describes a coherent industry.
This article explains why combined manufacturing benchmarks fail mid-market industrial firms and how to build an internal benchmark that actually reflects your buyers, deal sizes, and sales cycles.
Note: Not a WhatConverts user yet? Start your free 14-day trial of WhatConverts today or book a demo with a product expert to see how we help prove and grow your ROI.
The "Manufacturing" Benchmark Is Five Sub-Industries in a Trenchcoat
Look at what's actually inside the WebFX manufacturing CPL average:
| Sub-sector | B2B CPL | Sales Cycle | CPC |
| Aerospace | $103 | 365 days | $5.10 |
| Automotive | $294 | 2 days | $1.17 |
| Construction | $779 | 134 days | $9.12 |
| Industrial | $333 | 130 days | $5.26 |
| "Average" | $377 | 158 days | $5.16 |
These aren't variations of the same business. Aerospace runs on multi-year procurement contracts with defense-grade compliance. Automotive parts move like e-commerce. Construction sells to general contractors negotiating against quotes. Industrial sells to plant managers with capex committees.
Same industry, but five different buyers, five different deal sizes, and five different timelines.
When a building systems manufacturer hits a $500 CPL, the $377 "manufacturing average" tells them they're overpaying. But that average was dragged down by $103 aerospace leads, and aerospace leads are from an industry that uses paid search to capture awareness for $2M contracts, not direct quote requests.
Even Sub-Industry Benchmarks Don't Always Help
In reality, building systems manufacturing sits at the intersection of two sub-industries: construction and industrial.
- Construction manufacturing has a $779 CPL, which makes a $500 CPL look like a steal.
- Industrial manufacturing has a $333 CPL, which makes $500 CPL look expensive.
The benchmarks are all over the map, which makes it impossible for many manufacturing marketers who don't fit neatly into a specific sub-industry to accurately evaluate the success of their campaigns.
Why This Especially Fails Mid-Market Industrial Manufacturers
Most manufacturing clients aren't aerospace primes or automotive Tier 1 suppliers. They're mid-market industrial: HVAC equipment makers, specialty component manufacturers, industrial pump and valve companies, building product fabricators.
These businesses share traits that the benchmark obscures:
- Mid-length sales cycles (90–180 days), not 2 days or 365 days
- Mid-five-figure to low-six-figure deal sizes, not $500 parts orders or $5M jet engines
- Technical buying committees of 3–5 people, not solo purchasers or procurement boards
- Hybrid B2B/distributor channels that complicate attribution
WebFX itself recommends a $200–$500 CPL target for "mid-market manufacturing" with 3–6 month nurture cycles. But that recommendation lives buried under the same $377 headline number that gets quoted everywhere else.
So mid-market industrial marketers end up benchmarked against a blended industry average that includes businesses with nothing in common with theirs.
What Happens When You Optimize Against the Wrong Benchmark
Three things, all of them expensive:
You cut campaigns that are working. A $500 CPL on a campaign generating $80k HVAC system inquiries looks like below-average performance when compared to a $377 average benchmark. Cut it, and you've killed your highest-ROI channel.
You scale campaigns that aren't. A campaign that’s just generating distributor reps doing price comparisons isn’t bringing in leads, but its $200 CPL looks like above-average performance. Scale it, and you've doubled spend on leads that never close.
You can't defend the budget. When leadership asks why CPL is higher than industry average, a generic benchmark gives you no answer. An internal benchmark tied to your actual deal sizes does.
The benchmark isn't just imprecise. It's measuring a different industry.
Related Reading: Send Quote Value with Google Ad Conversions
The Fix: Stop Looking Outward and Build Your Own Benchmark.
The only meaningful benchmark for a mid-market industrial manufacturer is the one built from their own historical lead data.
That requires three things most manufacturers don't have today:
- Every lead captured in one place: calls, forms, chats, distributor inquiries
- Every lead tagged with value and qualification: real deal size, real outcome
- Enough lead history: usually 6–12 months, to establish your own CPL, CVR, and close-rate baselines
WhatConverts handles all three. Here's how it works:
Capture Every Lead, Regardless of Channel
Industrial manufacturers generate leads through forms, but the high-value ones come through phone calls and distributor referrals. WhatConverts attributes every call, form, and chat back to the campaign, source, and keyword that drove it, including offline and direct sources that typically vanish into "(direct)/(none)."
Attach Value and Qualification to Every Lead
Every lead captured can be marked qualified or unqualified, and tagged with quote value and sales value. That data feeds your reporting, which means your CPL stops being a vanity number and starts being a CPL-per-qualified-lead, broken out by product line and deal size.
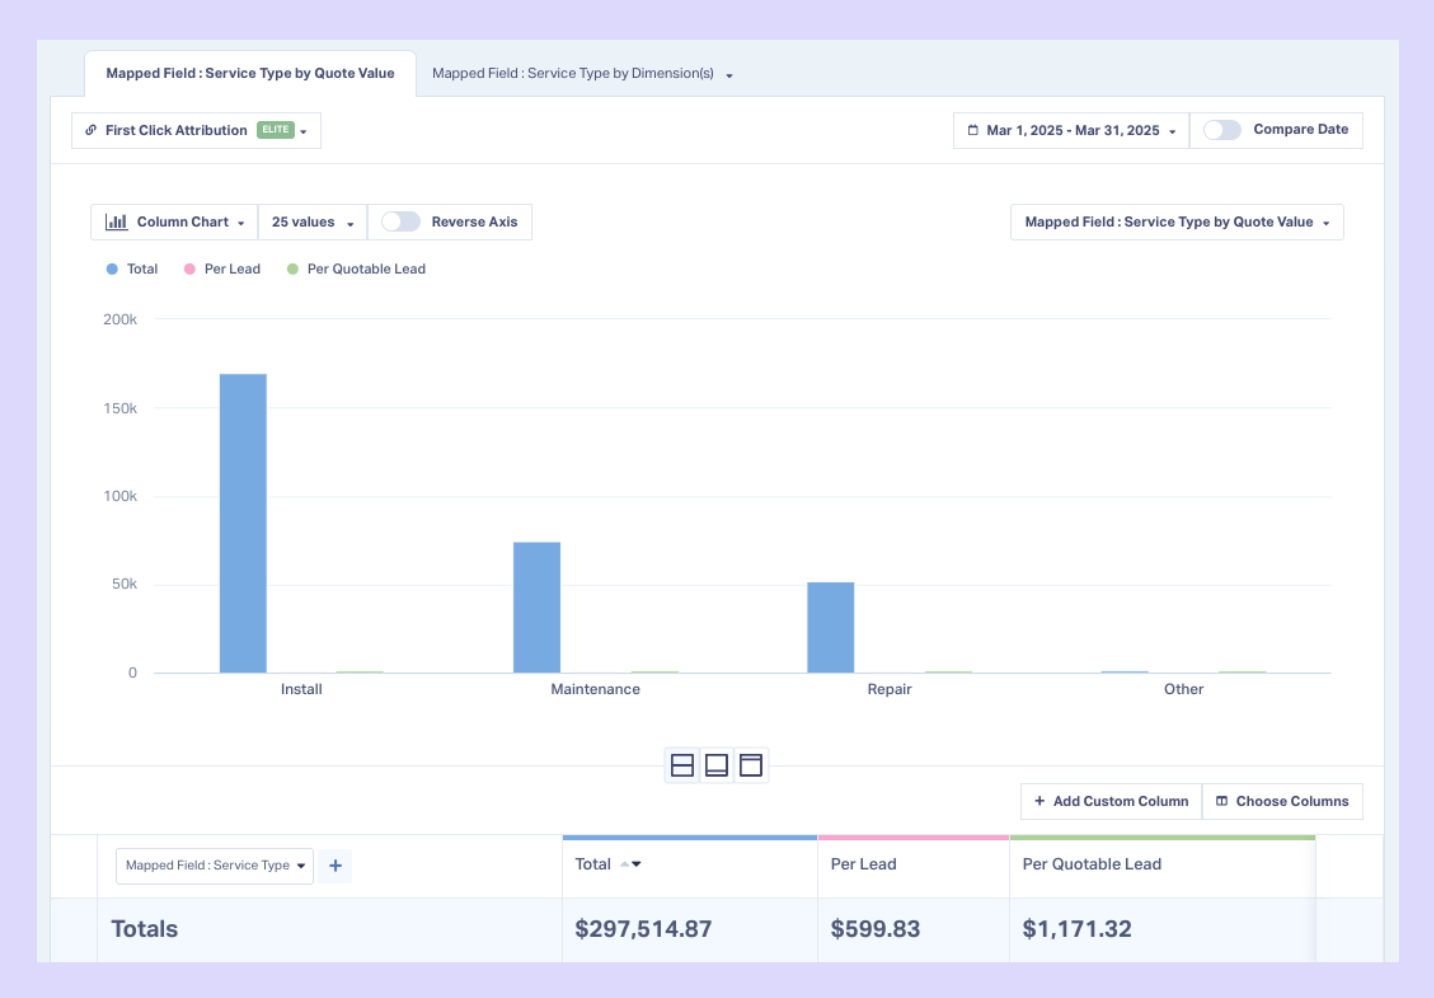
Benchmark Against Your Own Prior Performance
After a few months of clean lead data, your reports show what your business actually looks like:
- Your average CPL for replacement equipment inquiries
- Your average close rate for distributor leads vs. direct buyer leads
- Your average sales cycle by product line
- Your CPL ceiling for a campaign to still be ROI-positive
That's a benchmark you can defend, and a benchmark that reflects your actual buyers.
What Internal Benchmarking Looks Like in Practice
A specialty industrial component manufacturer running three Google Ads campaigns might see this on a generic benchmark report:
| Campaign | CPL | vs. $377 Avg |
| Campaign A: Replacement Parts | $185 | ✓ Strong |
| Campaign B: New System Quotes | $620 | ✗ Weak |
| Campaign C: Distributor Inquiries | $310 | ✓ Average |
Cut Campaign B. Scale Campaign A. Standard playbook.
But once they tag value and outcome data on each lead in WhatConverts, the same campaigns look entirely different:
| Campaign | CPL | Avg Deal Size | Close Rate | ROAS |
| Campaign A: Replacement Parts | $185 | $1,200 | 18% | 1.2x |
| Campaign B: New System Quotes | $620 | $48,000 | 22% | 17.0x |
| Campaign C: Distributor Inquiries | $310 | $0 (catalog) | 4% | 0.6x |
Campaign B (the one the generic benchmark told them to cut) is the entire business. Campaign C, which looked fine, is burning budget on price hunters.
That clarity doesn't come from any external report. It comes from tagging leads with your own value data and reporting against your own history.
The Only Manufacturing Benchmark Worth Trusting
Industry-wide manufacturing benchmarks have value as a broad sanity check. They have almost no value as an optimization target, because they describe an industry that doesn't exist as a coherent market.
For mid-market industrial manufacturers, the benchmark that matters is built from your own lead data:
- Track every call, form, chat, and offline lead back to source
- Tag every lead with qualification status and quote value
- Sync that value data to Google Ads to feed Smart Bidding real signal
- Report performance by campaign, product line, and deal size
- Set CPL, CVR, and ROAS targets against your own historical performance
The only manufacturing benchmark worth trusting is the one you build yourself.
Ready to stop optimizing against an industry that isn't yours?
Start your free 14-day trial of WhatConverts today or book a demo with a product expert to see how we help prove and grow your ROI.
Get a FREE presentation of WhatConverts
One of our marketing experts will give you a full presentation of how WhatConverts can help you grow your business.
Schedule a DemoGrow your business with WhatConverts