


One of the marketing “levers” you can pull is Time. When is your best audience most likely to convert? What months, days, or even hours are your customers buying? And most importantly, when does it make the most sense to ramp up your ad spend?
When you understand your peak lead times, you can make more effective use of the budget you’ve got.
Luckily, WhatConverts makes it exceptionally easy to see peak lead times. Best of all, you can see peak times in terms of lead quantity, quotable lead quantity, requested service, sales value, or any other metric you measure. With WhatConverts, getting these insights takes just a few clicks.
Why Find Your Peak Conversion Times?
Let’s say you’re running marketing for a dentist's office. You’re trying to be strategic with your ad spend on Google, so you’d like to display ads only when your ideal customers are booking appointments for your services.
Now, you could check out peak search times for various keywords using Google Trends. For instance, you could compare search volume across “crown dentist,” “crown dental,” and “crown tooth.” Here, you can see weekends aren’t great for crown leads. 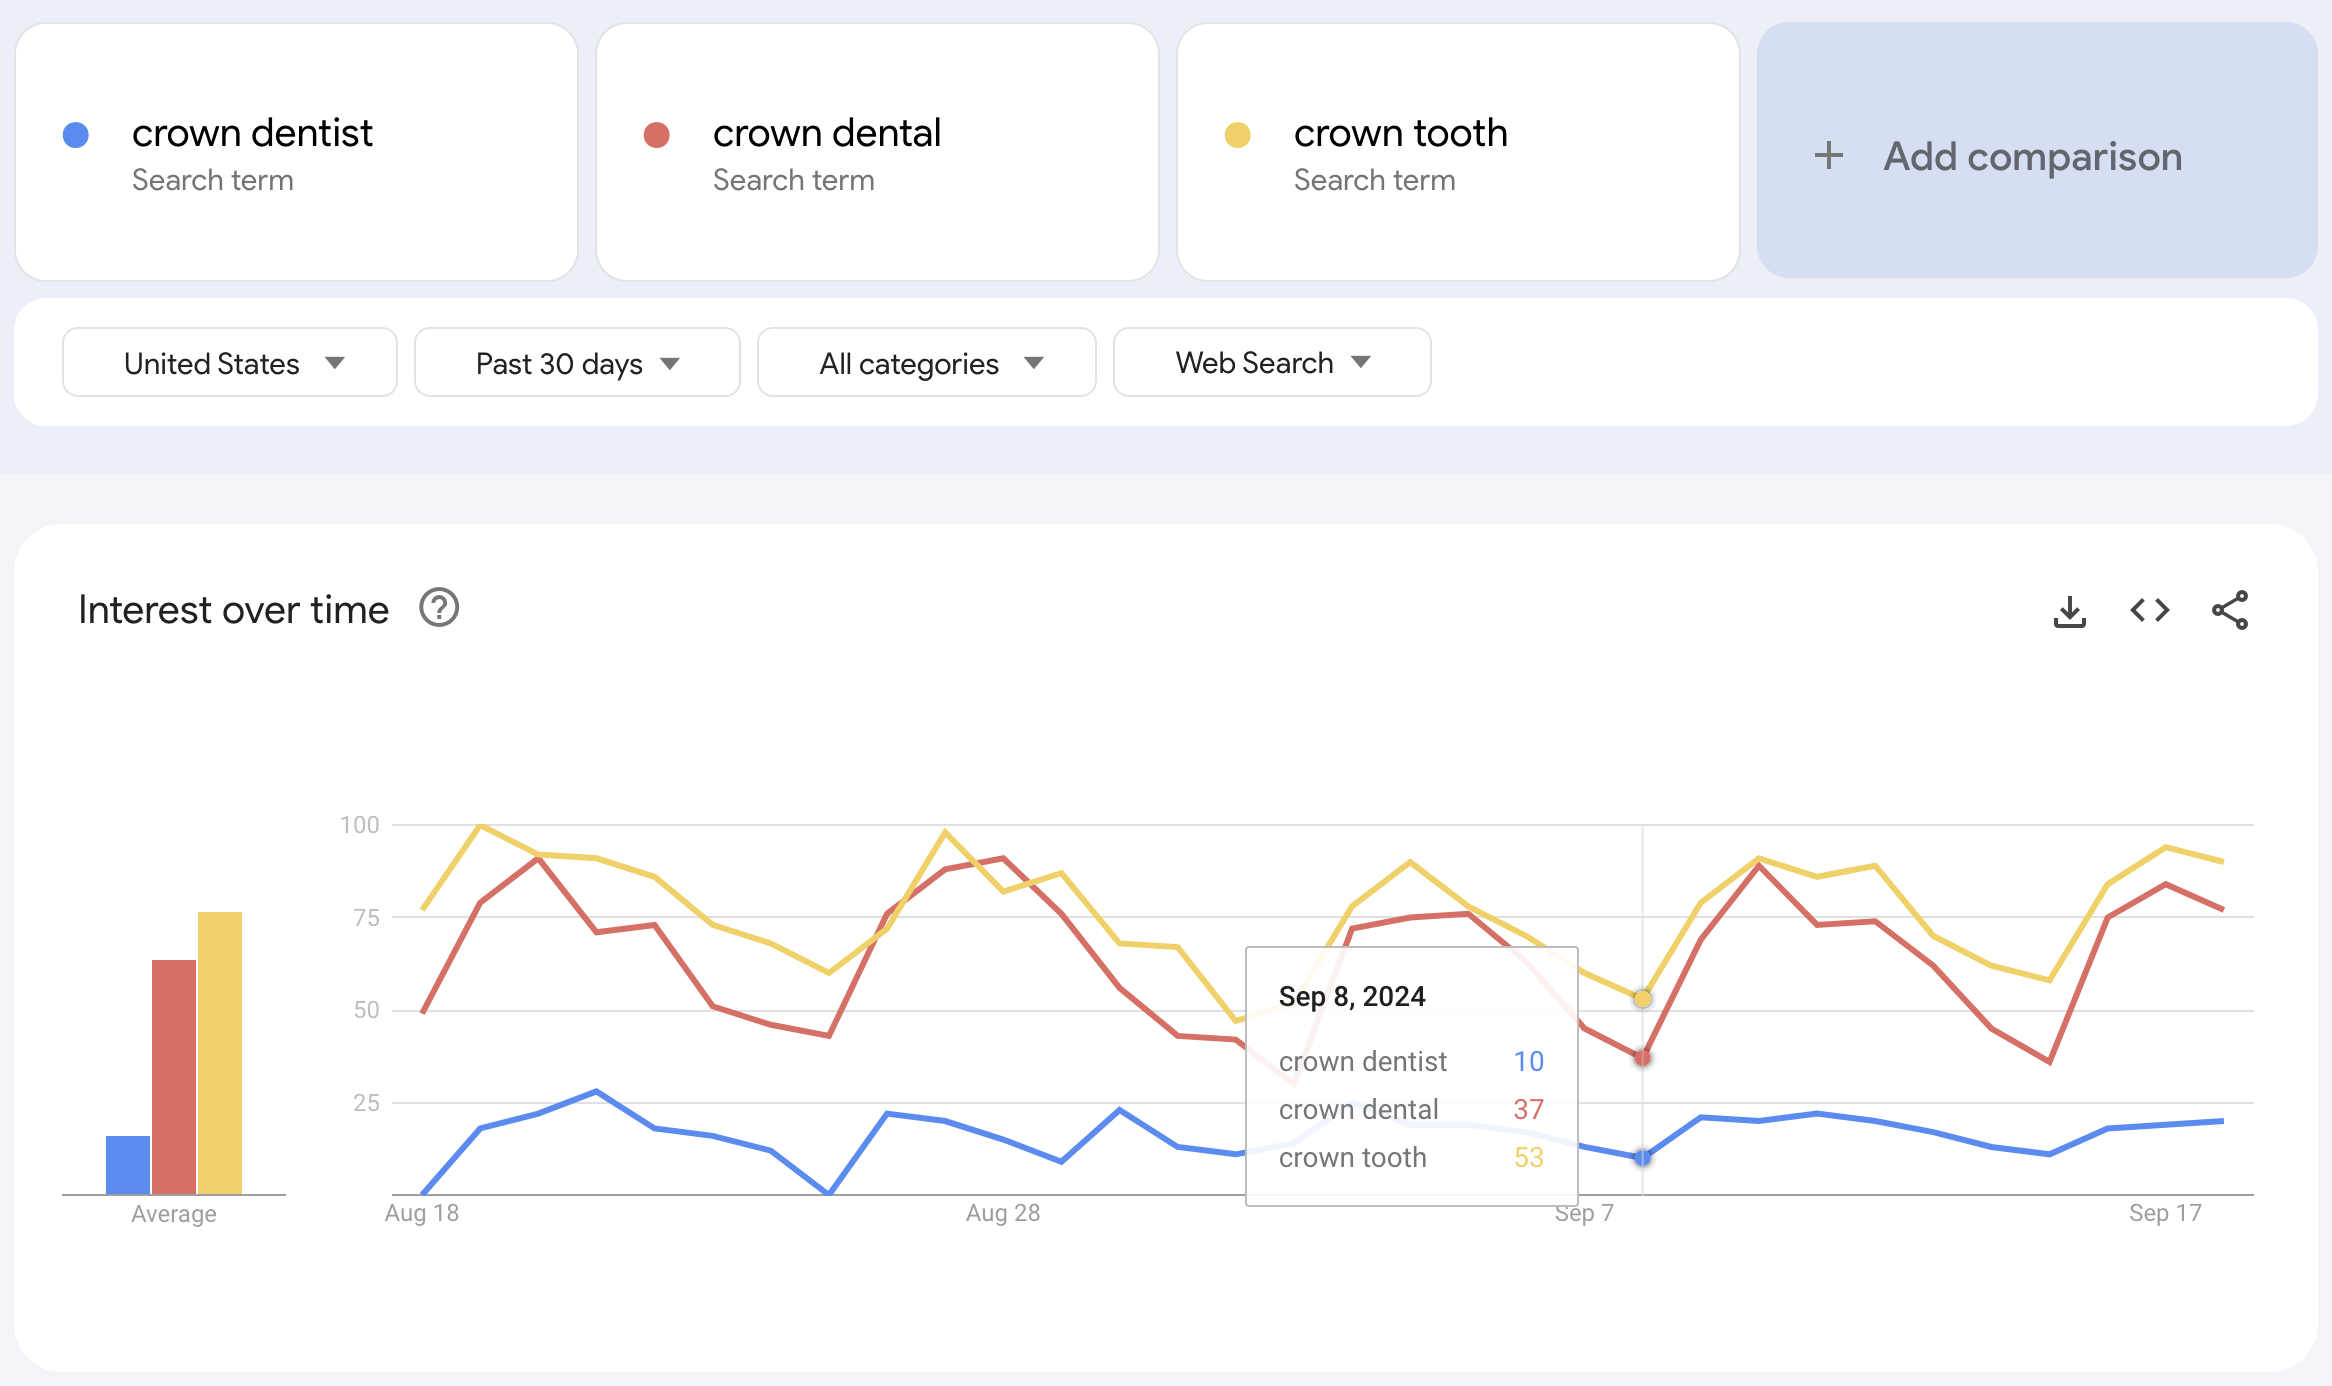
But what about peak times for leads that actually convert? That’s where WhatConverts comes in. With it, you can see conversion trends across hours, days, weeks, and months. And despite what Google Trends shows, crown leads are still pretty prevalent on the weekends, especially on Fridays and Saturdays. 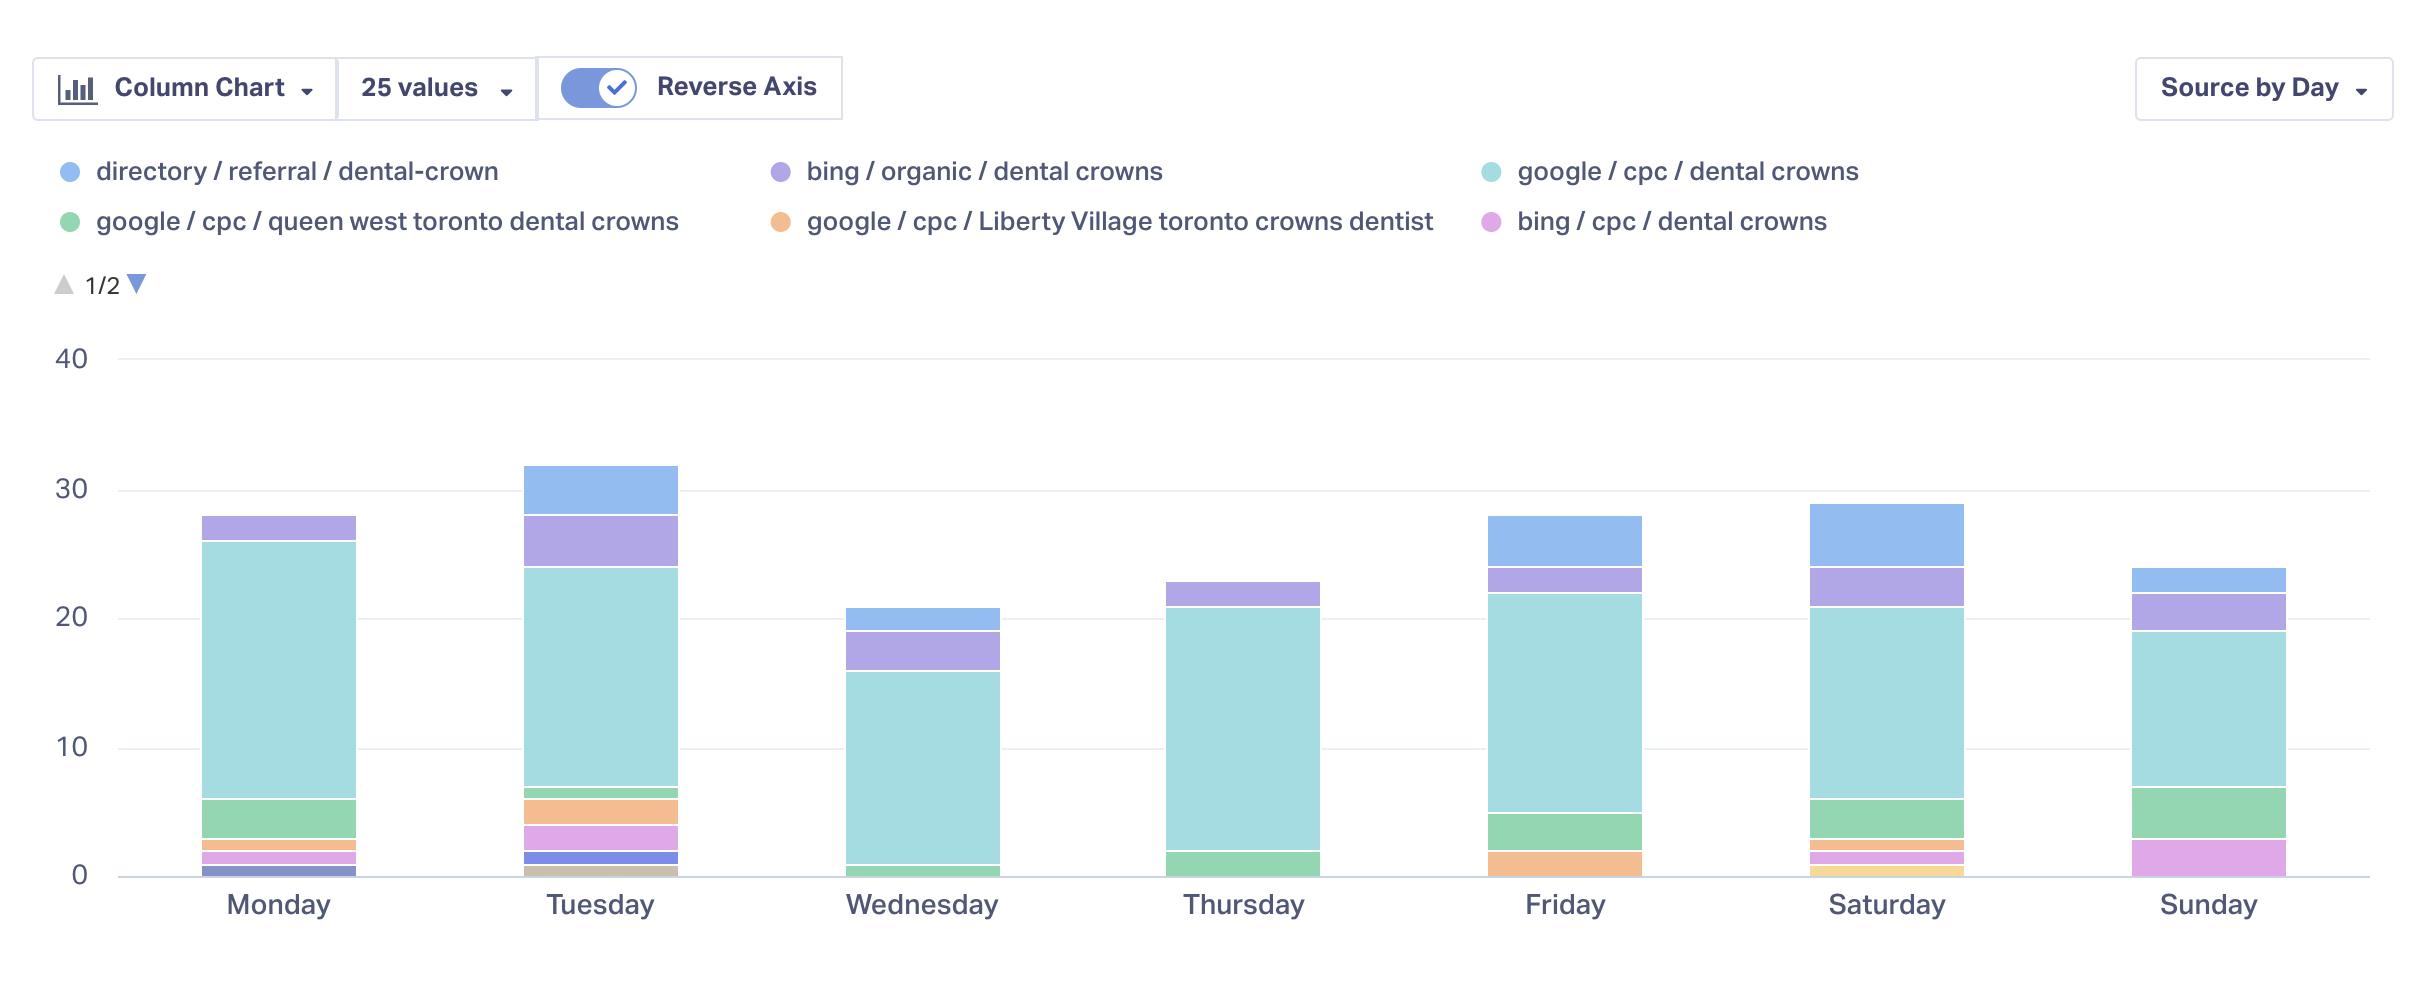
Even better, you can show results by quotable lead count: 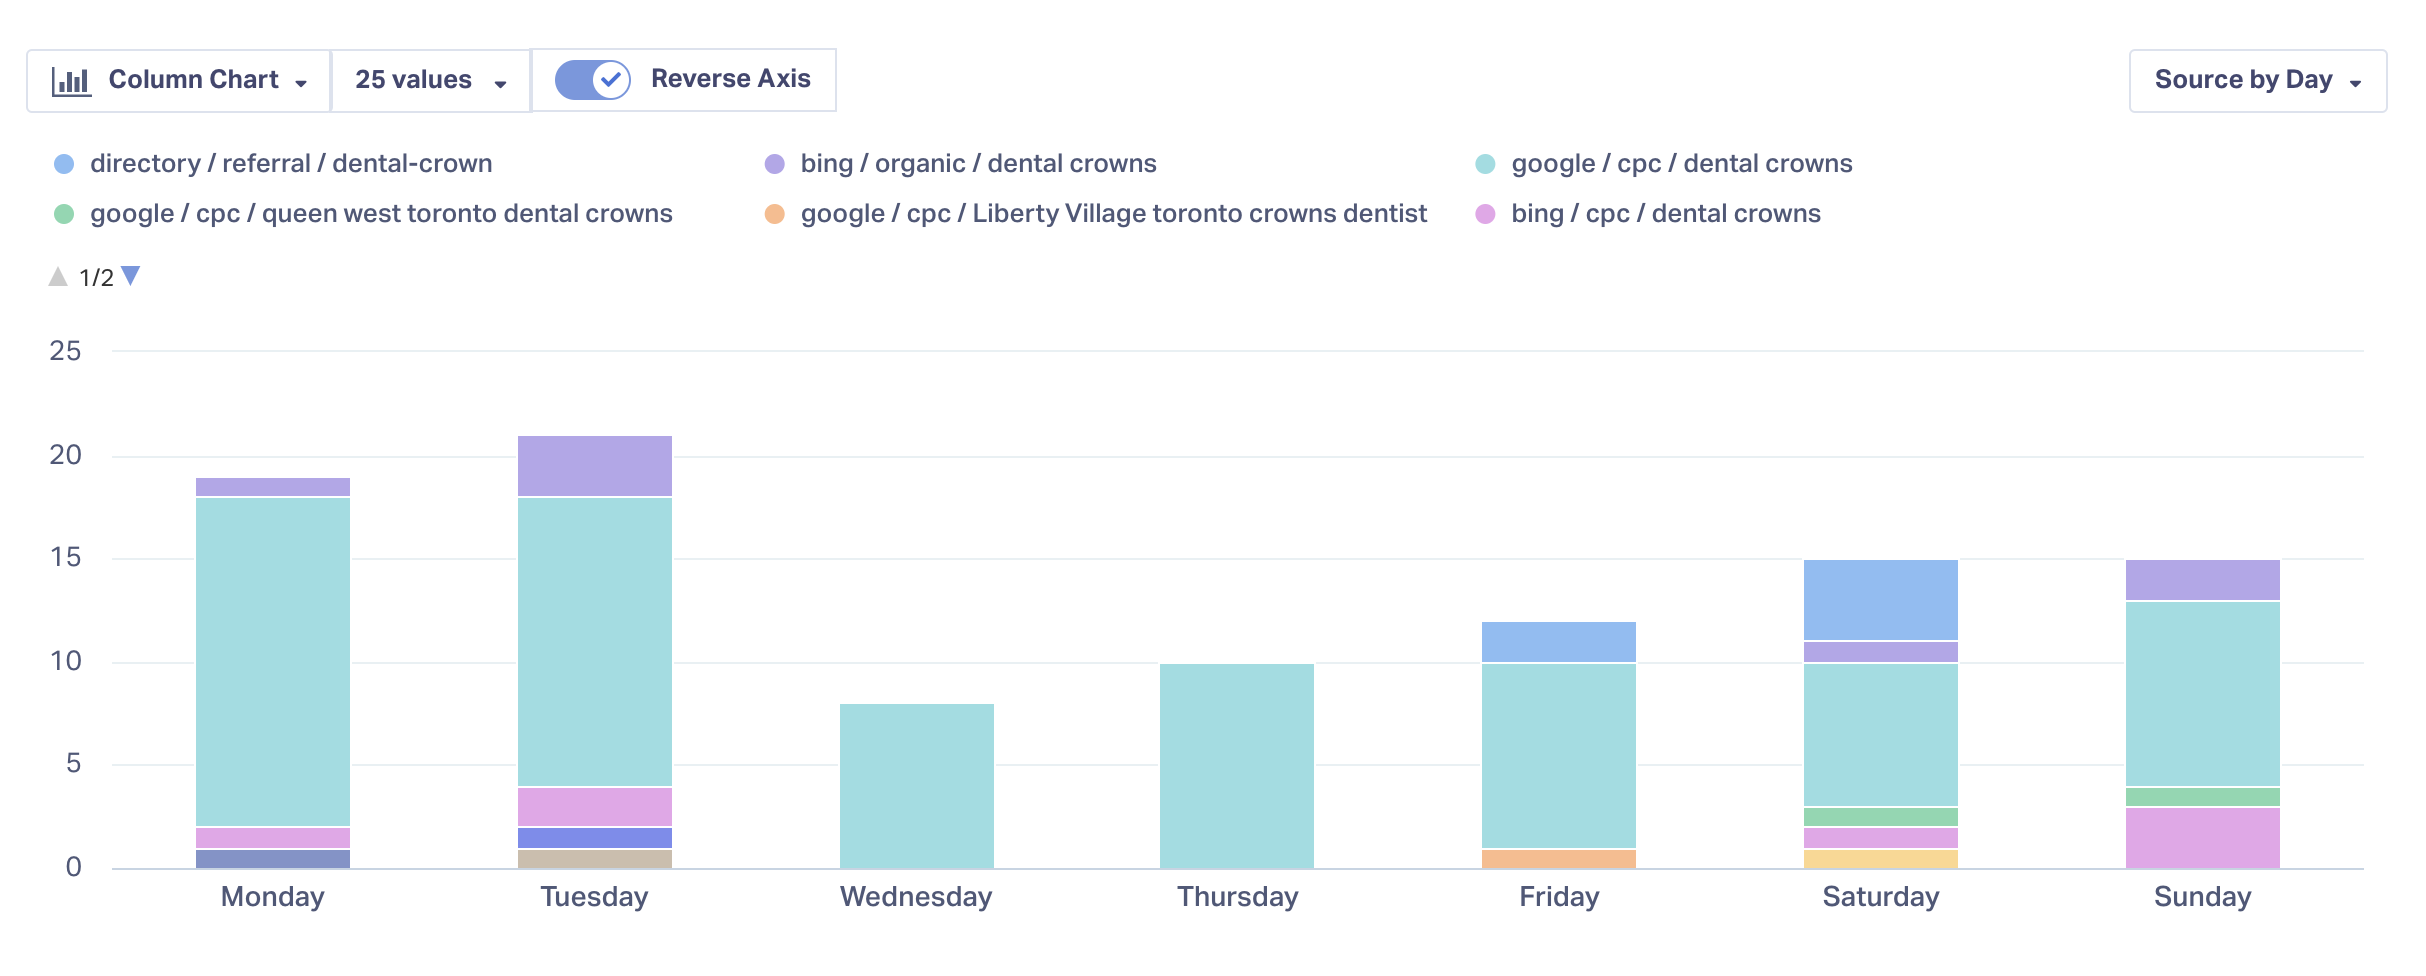
And sales/quote value: 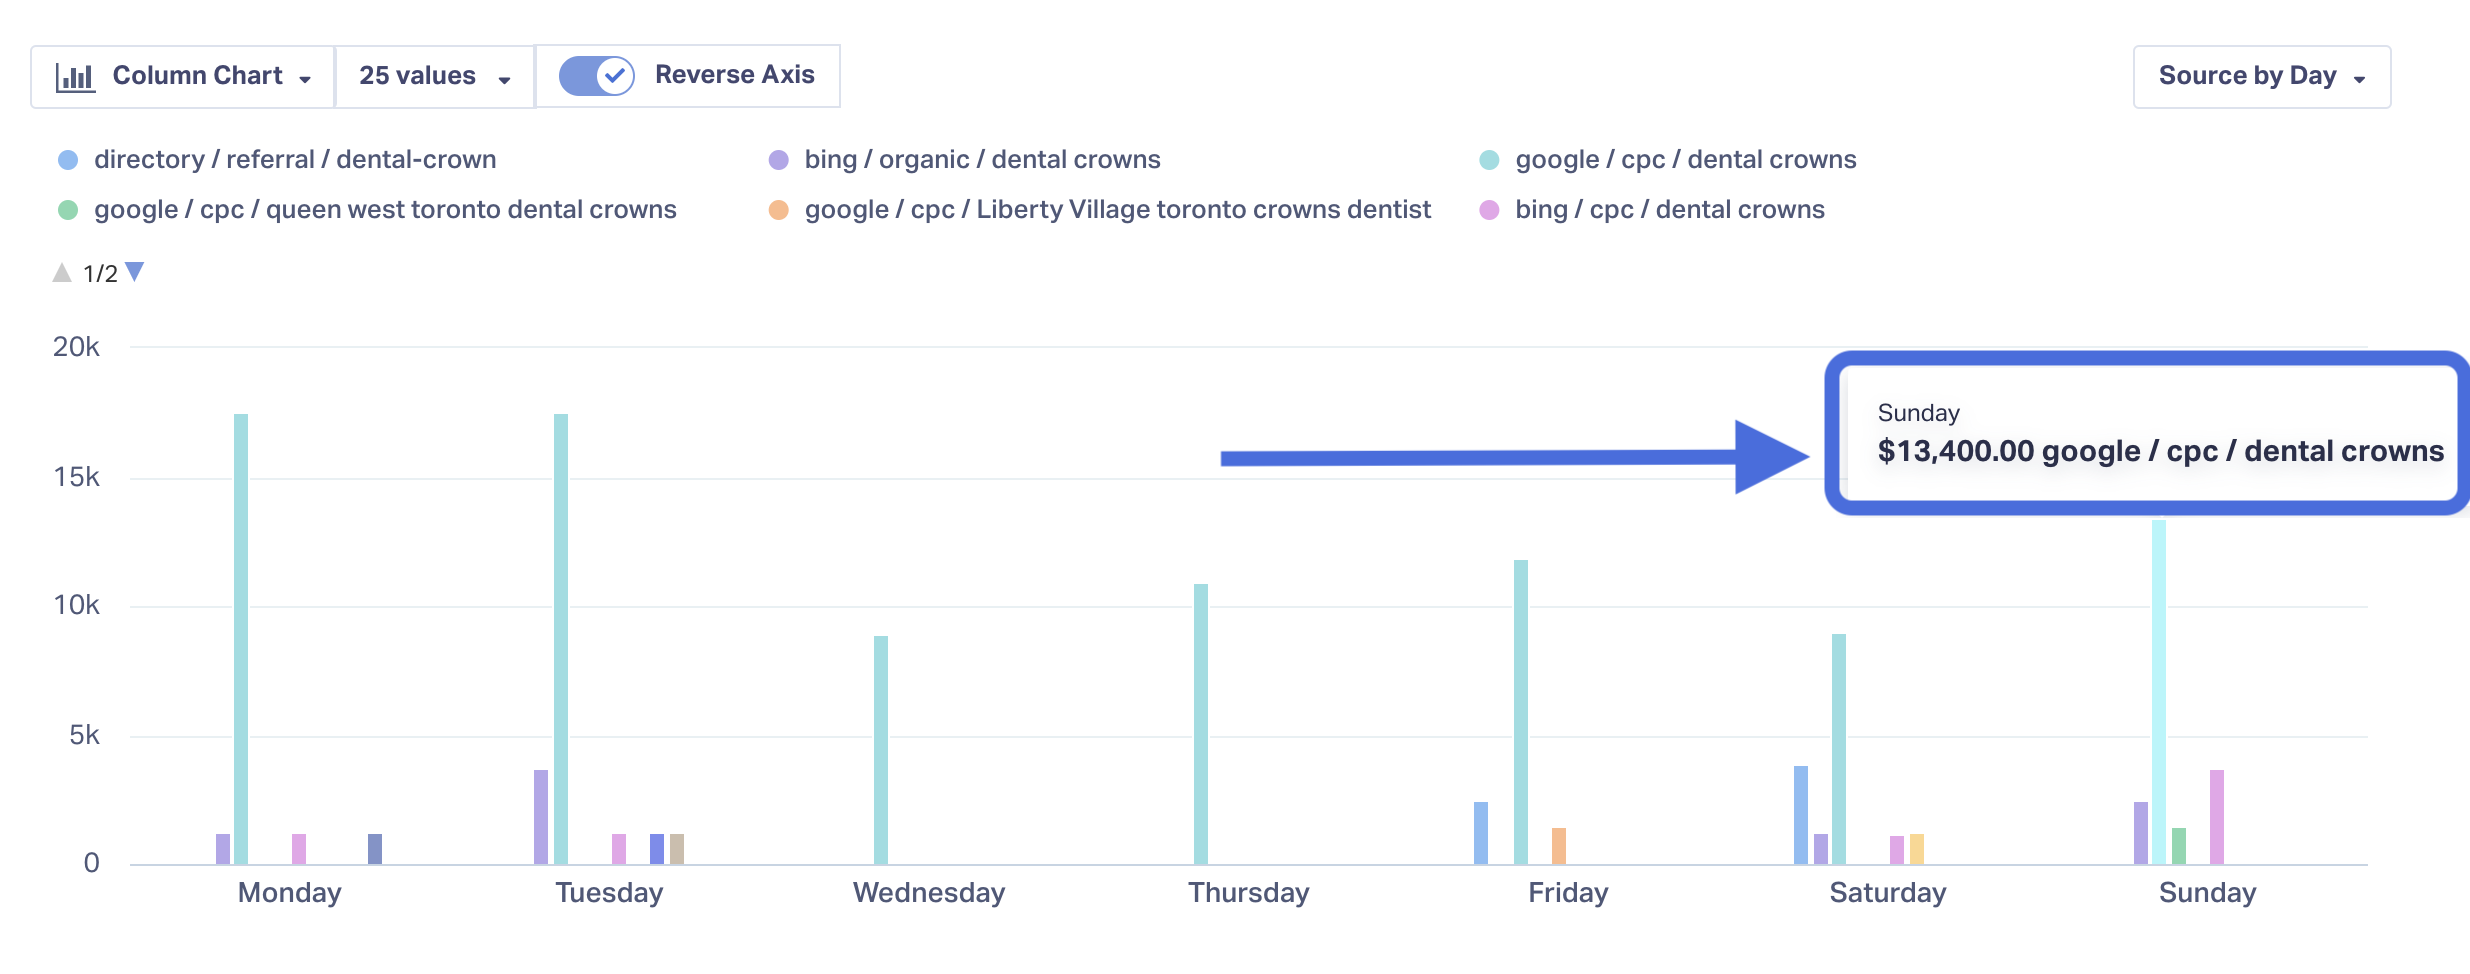
With these insights, you can make decisions based on real results, not just search volume.
How to Find Peak Conversion Times
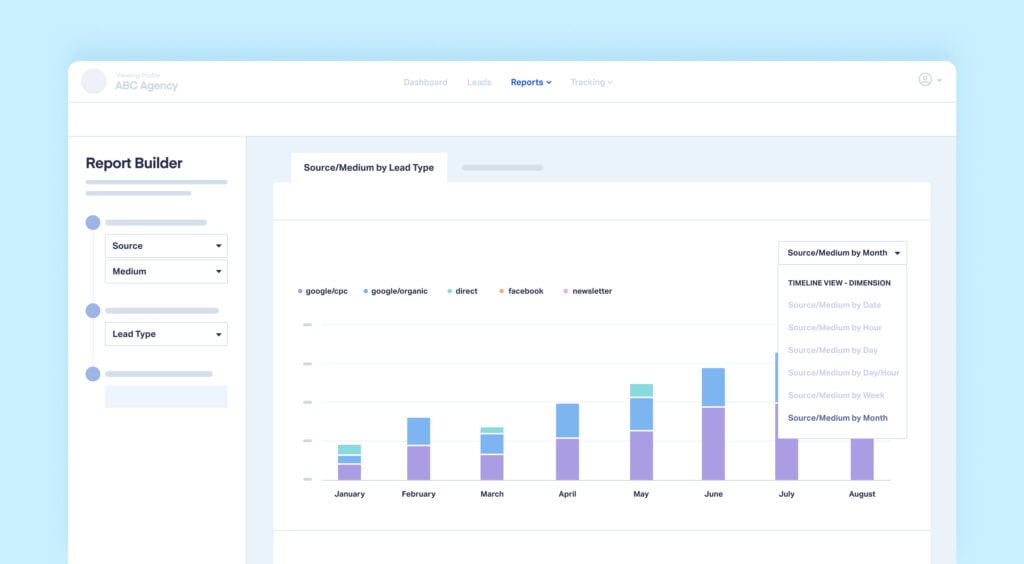
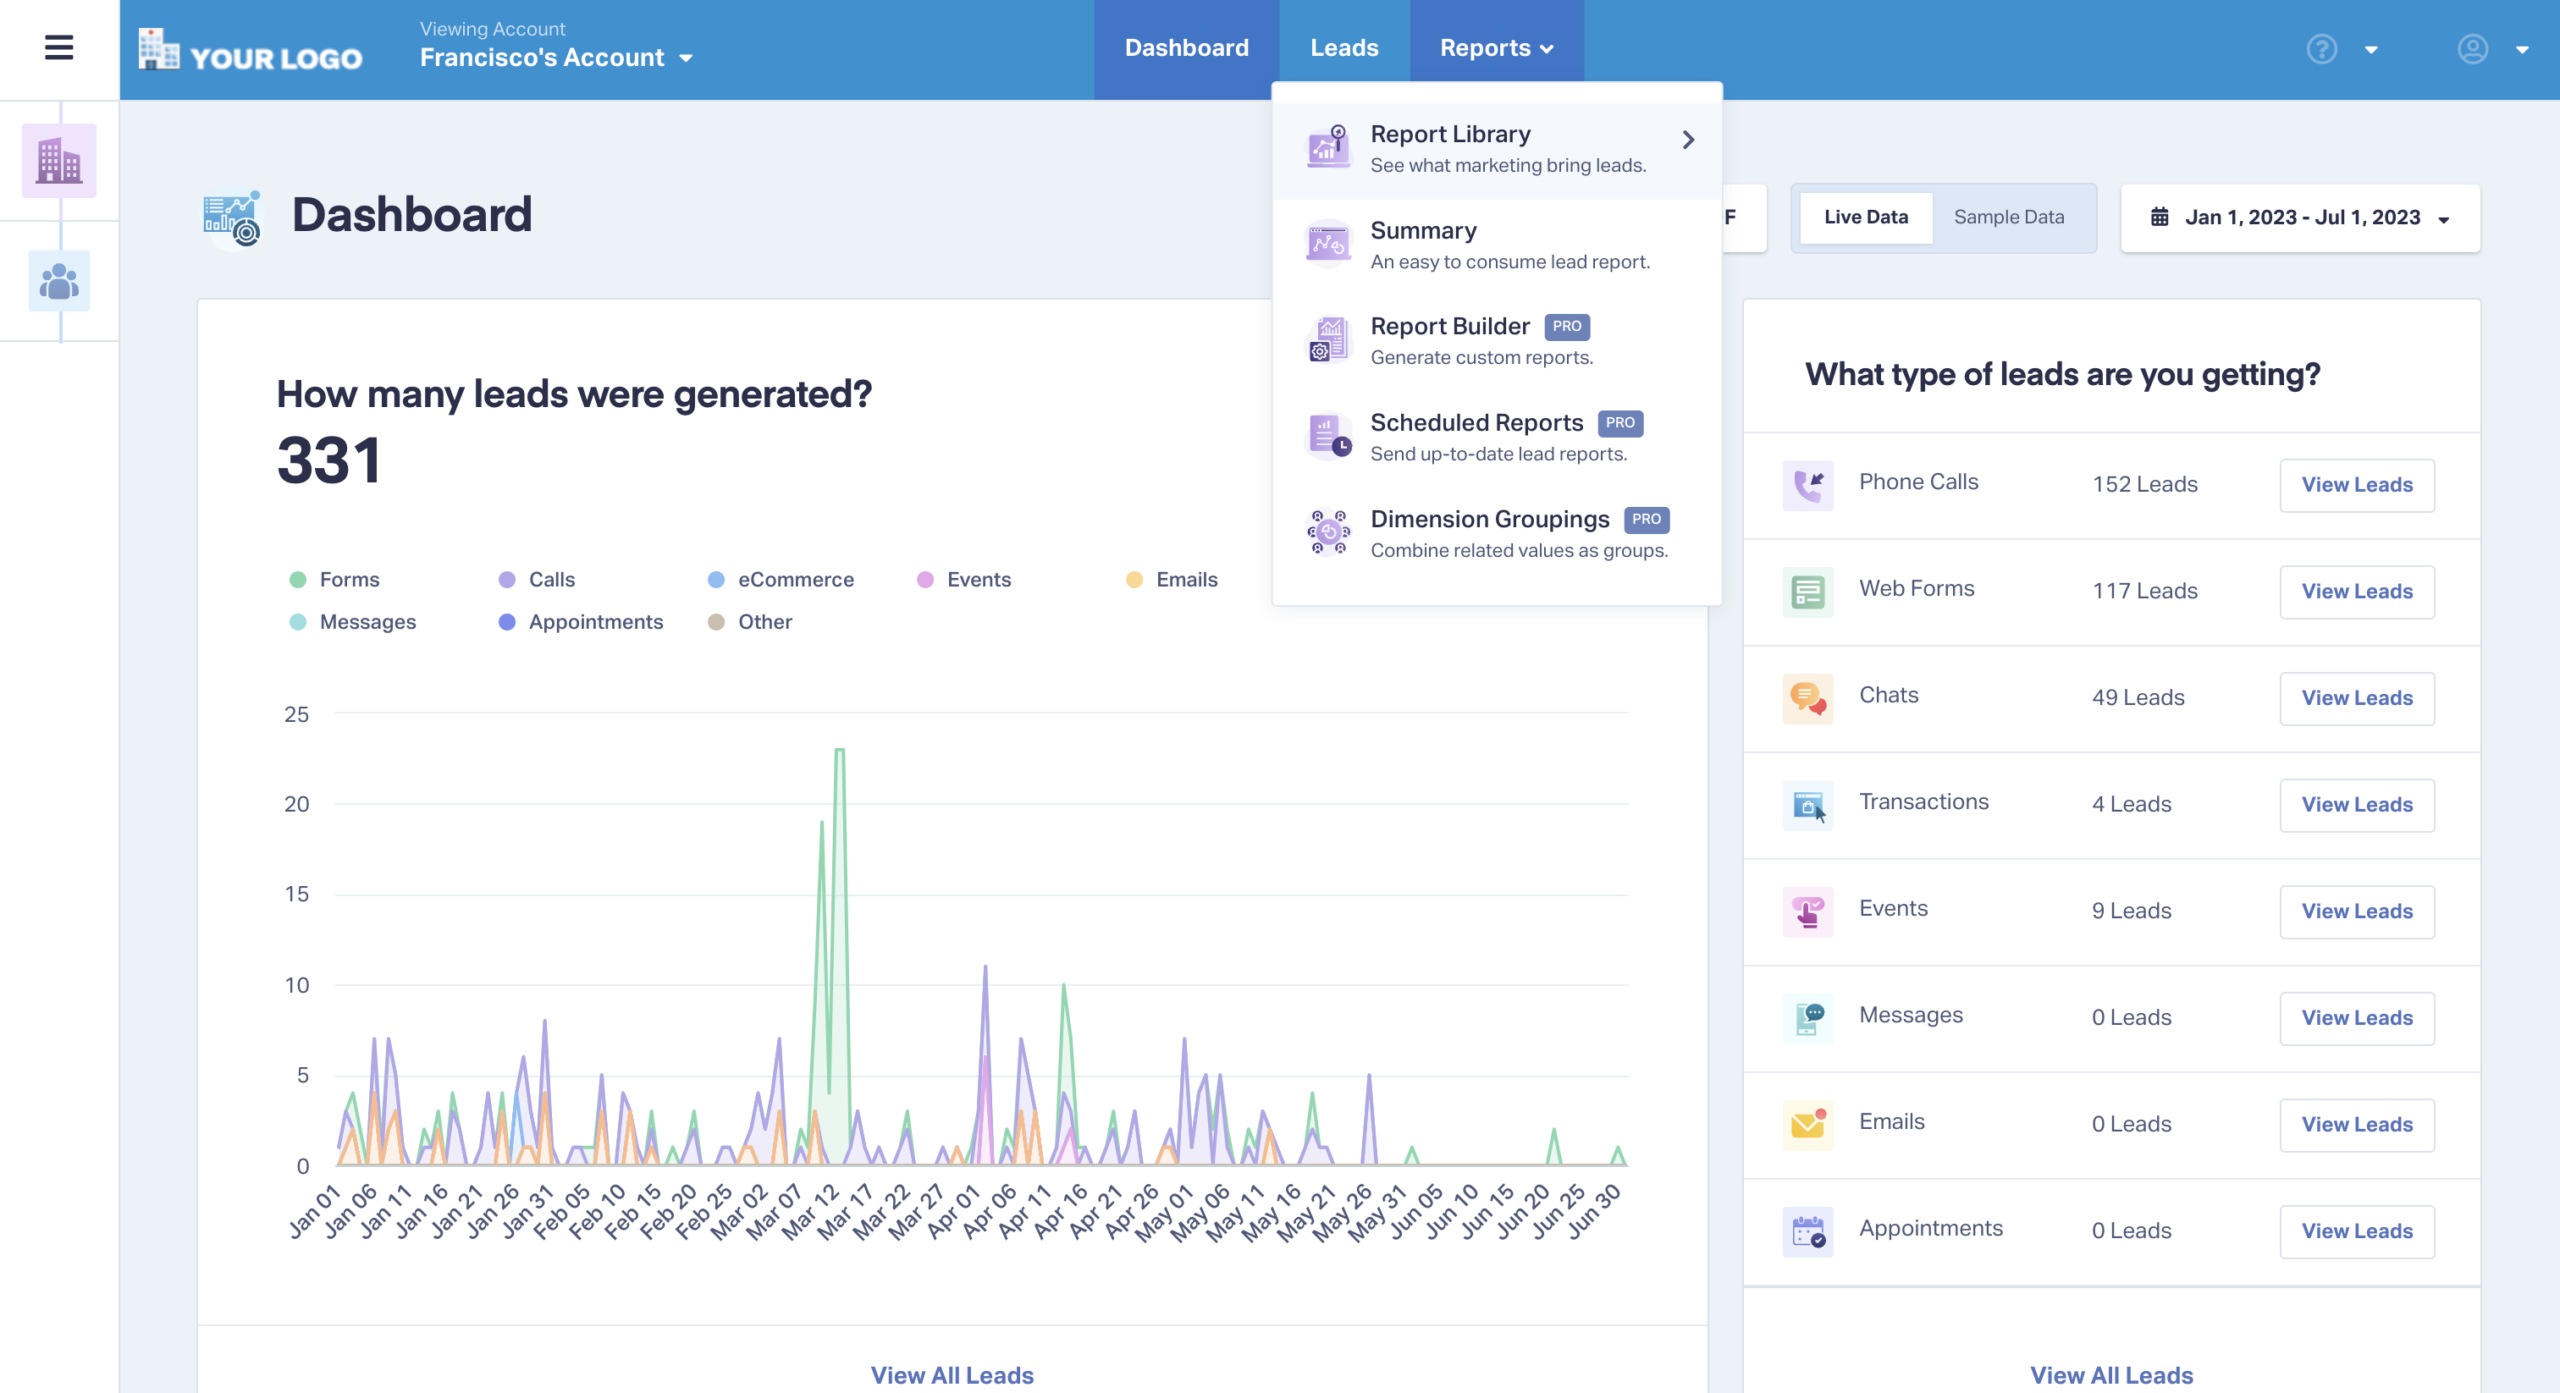
- Log into your WhatConverts account and choose/build your desired report.

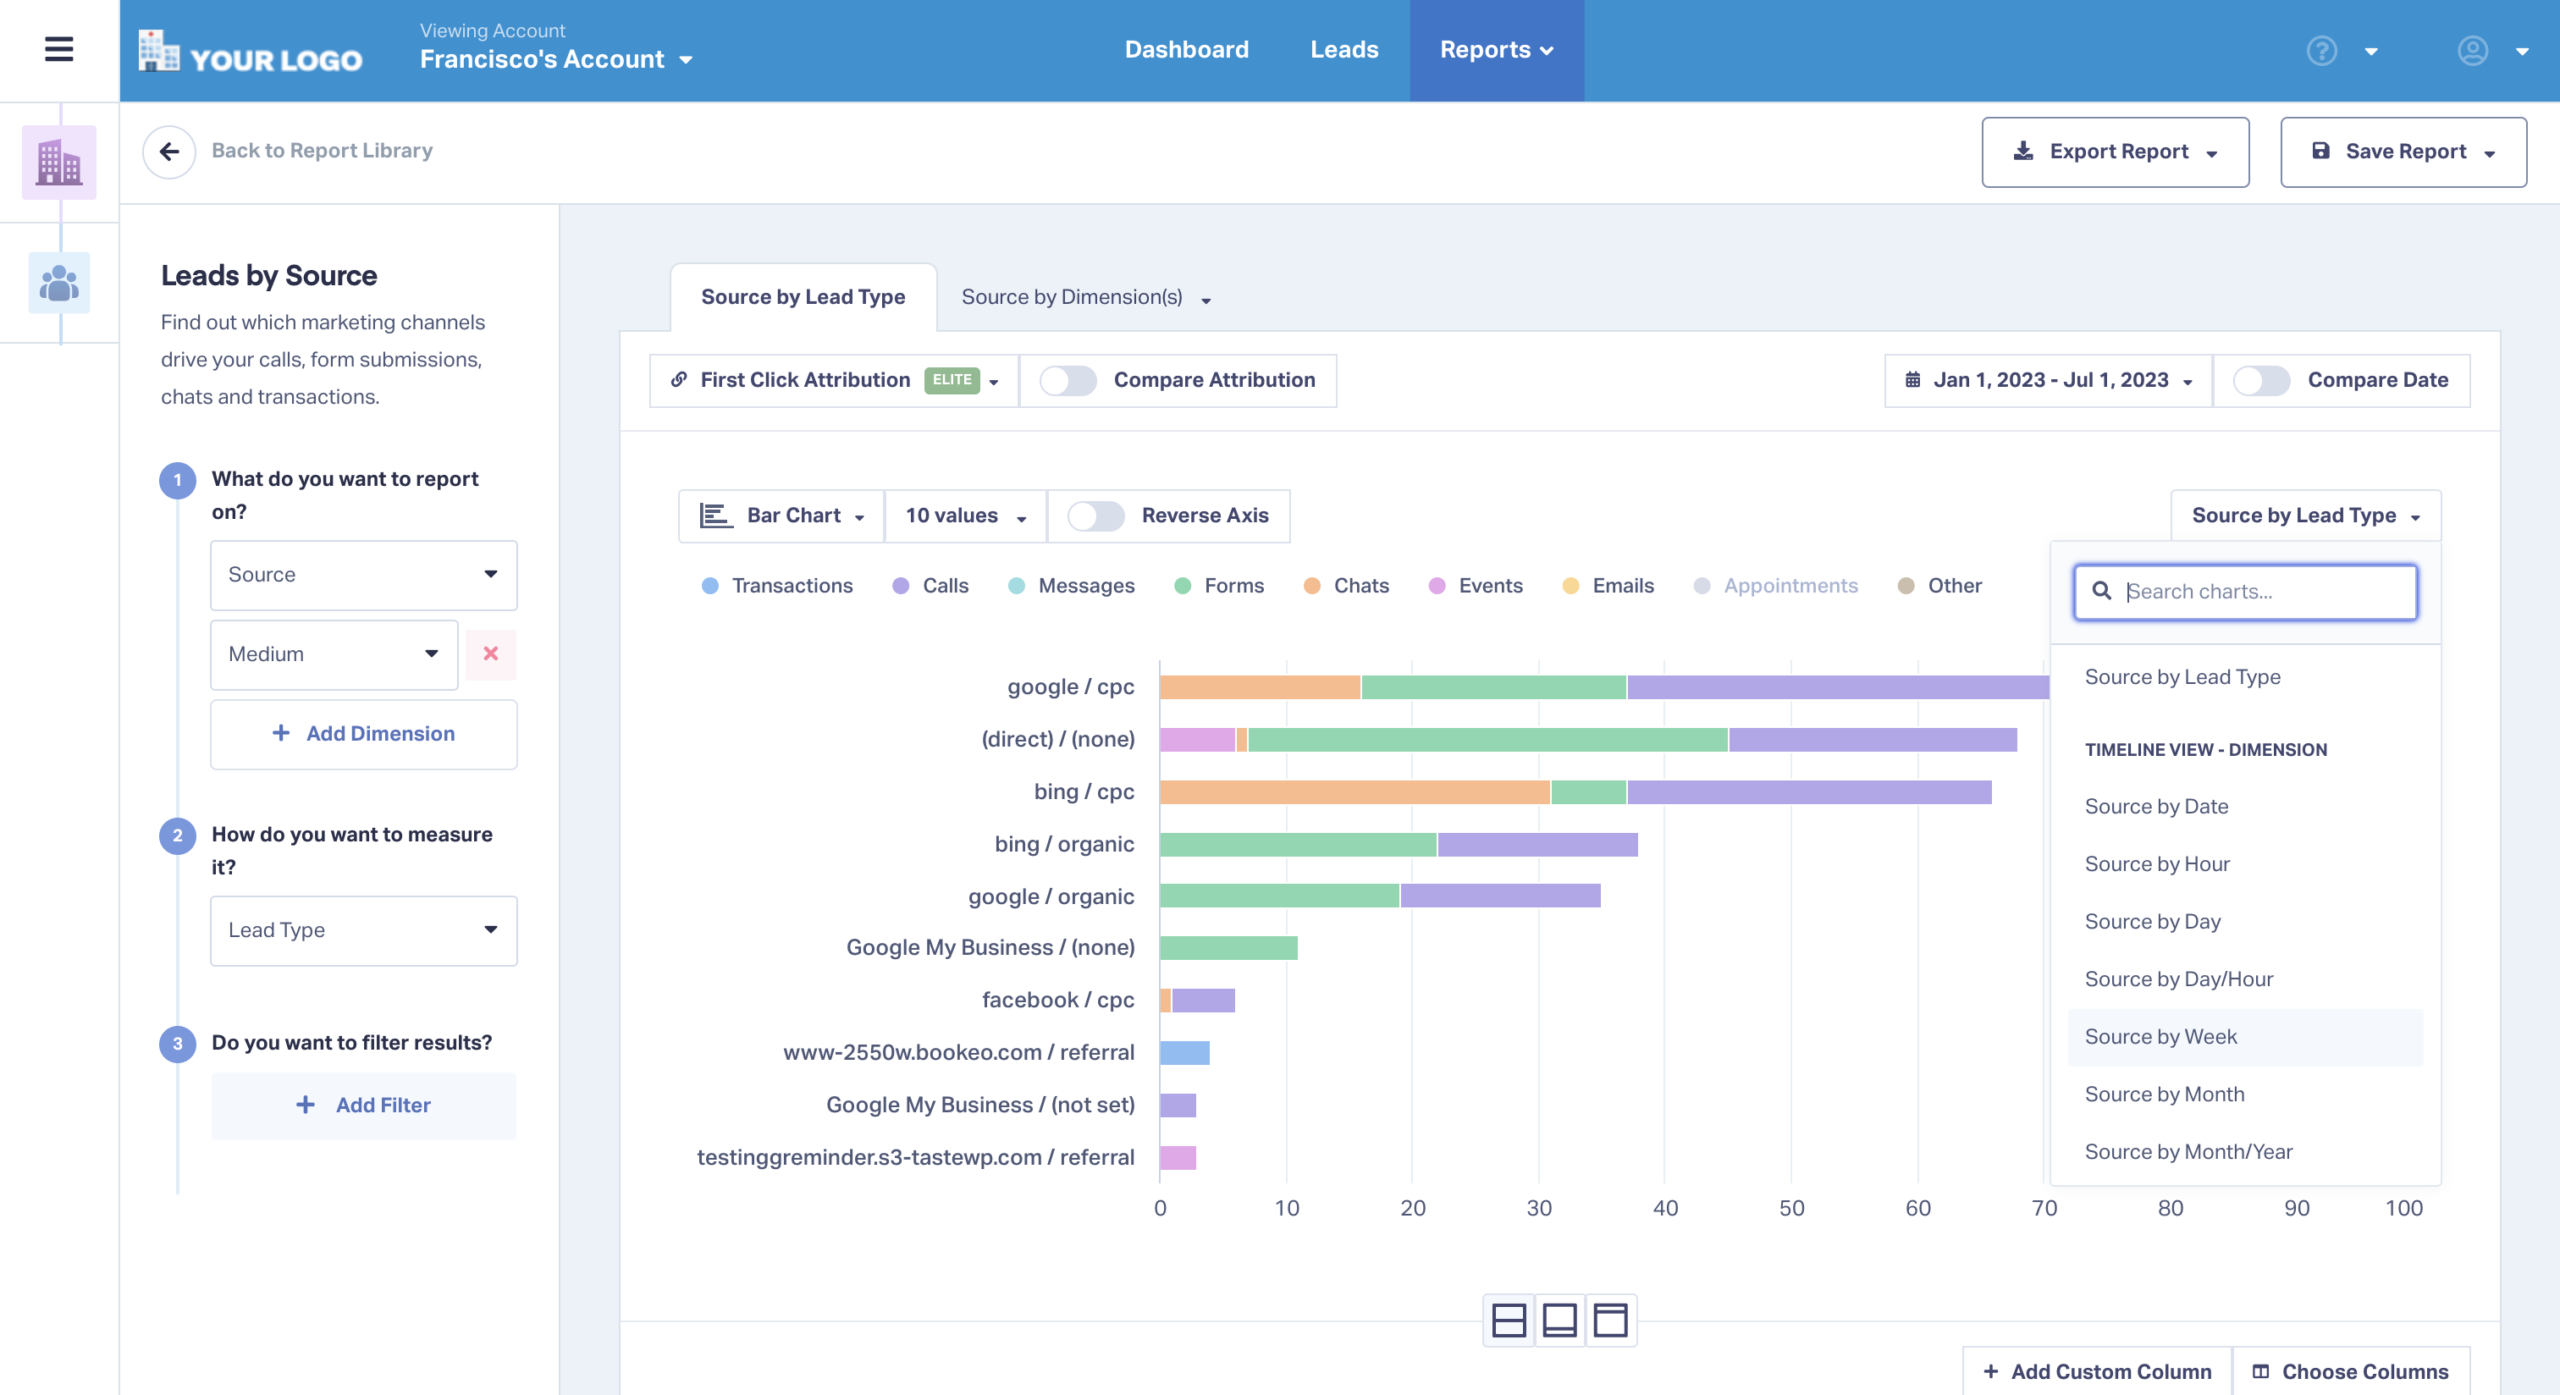
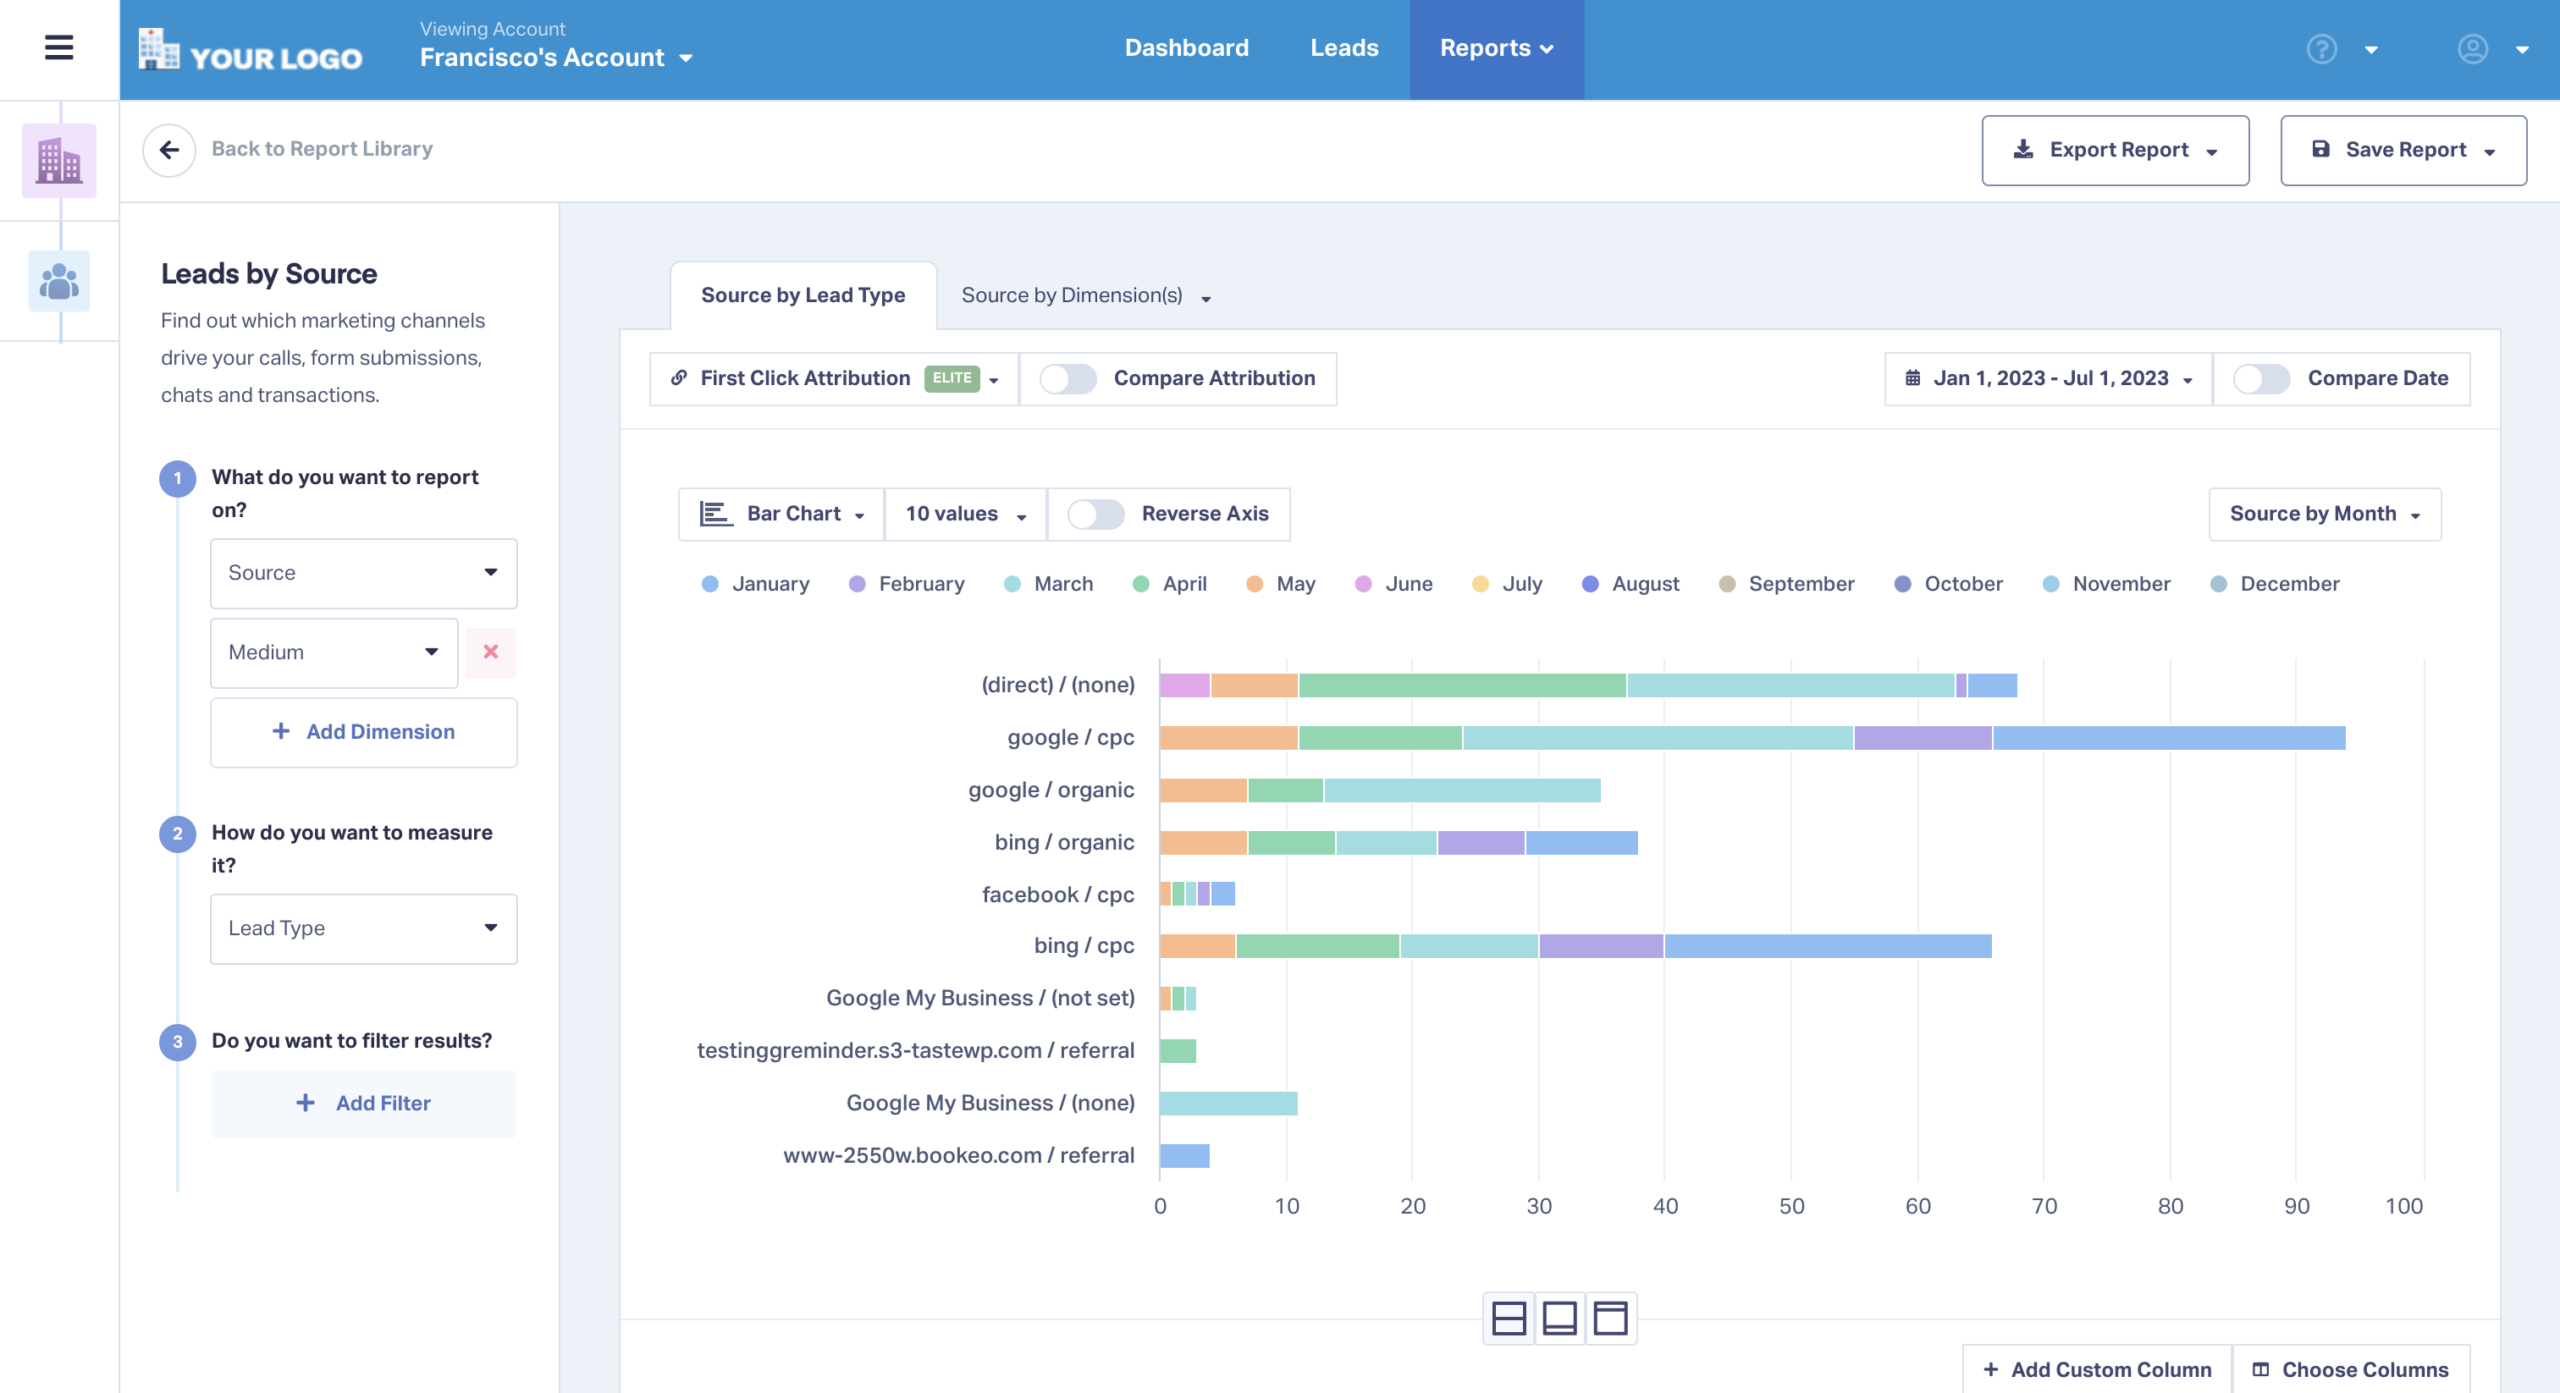
- Next, choose the Timeline View you’d like to see (Year, Month, Week, Day, etc.) from the dropdown menu on the right (“Source by Lead Type” in the example below). You can create your timeline view based on the dimension (e.g., “Source”) or the metric (e.g., “Lead Type”).

- You’ll now see a breakdown of your data by the time measure you chose.

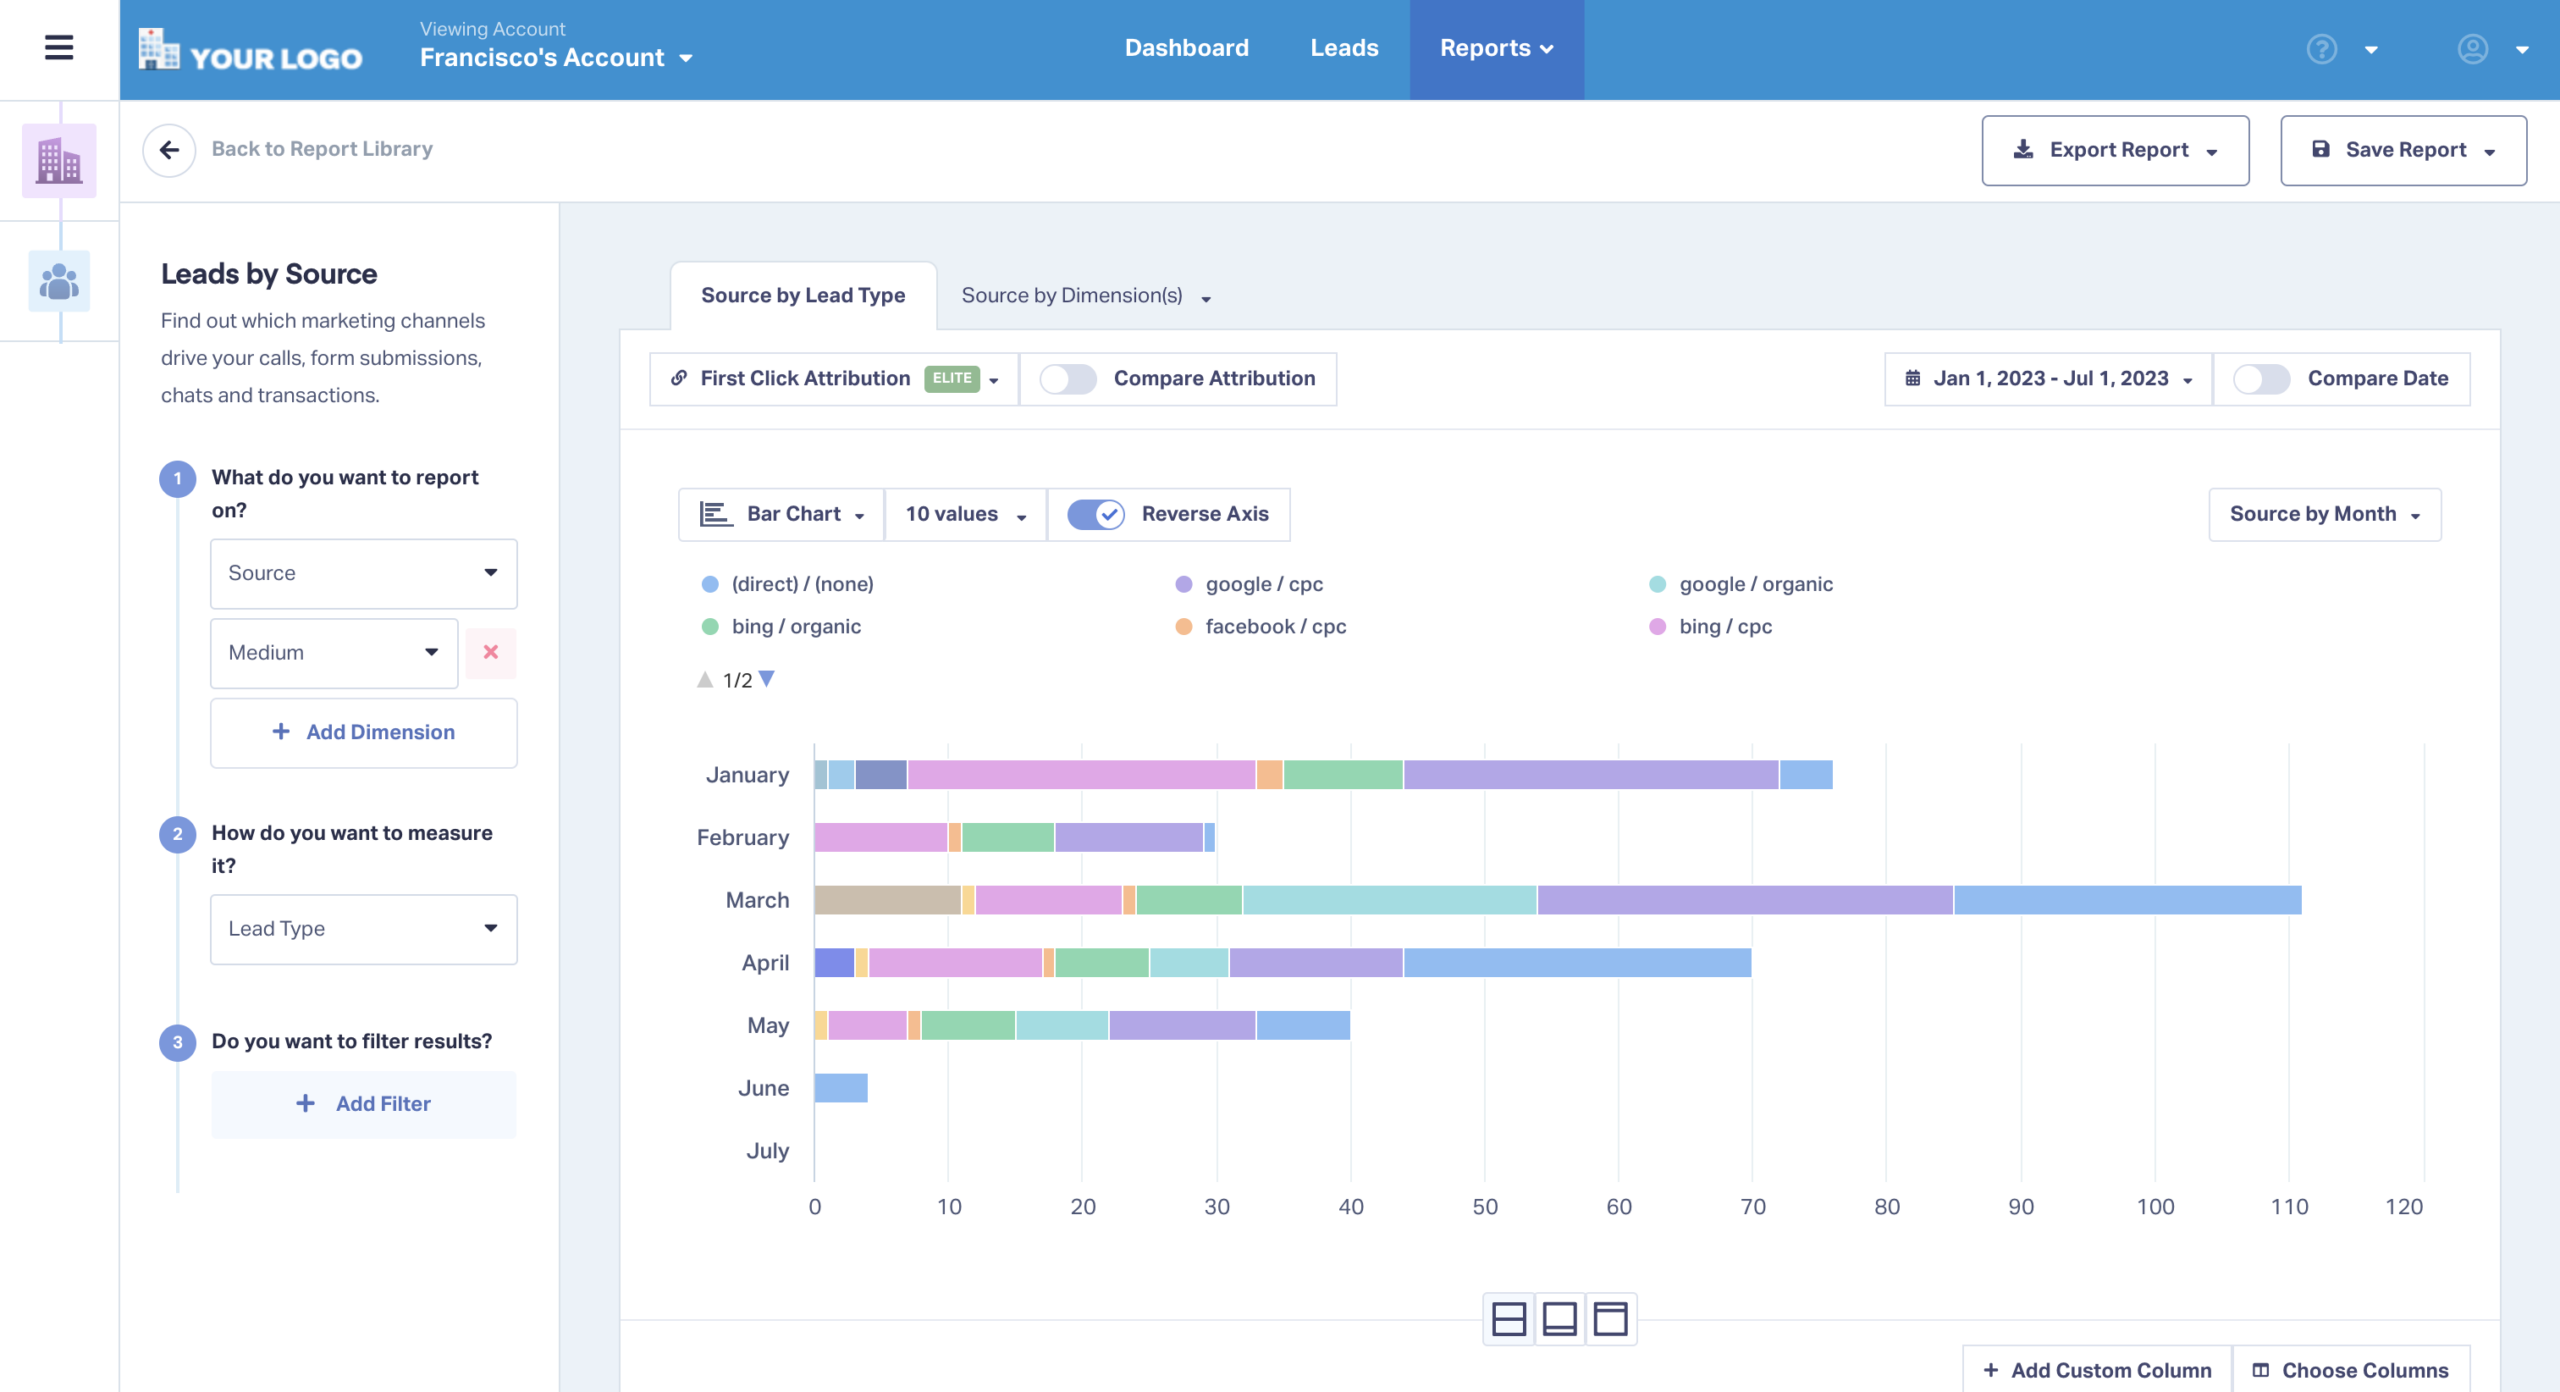
- Activate the “Reverse Axis” option to see your dimension and metric according to your time measure (e.g., Leads by Month).

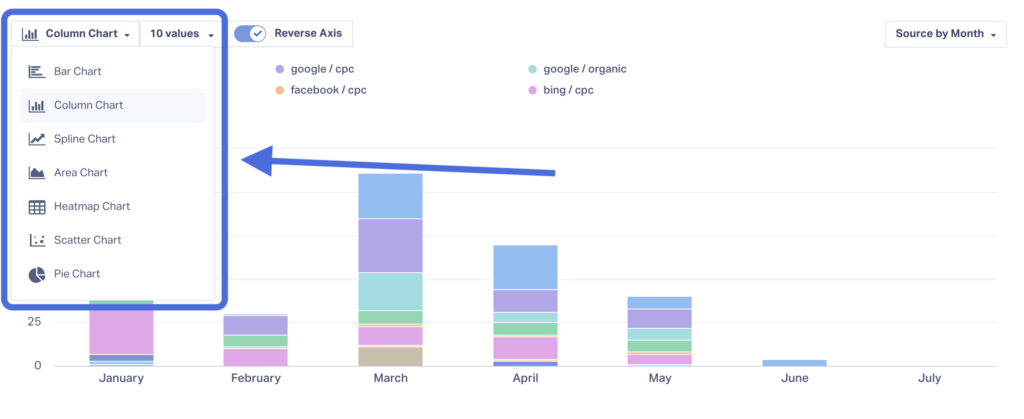
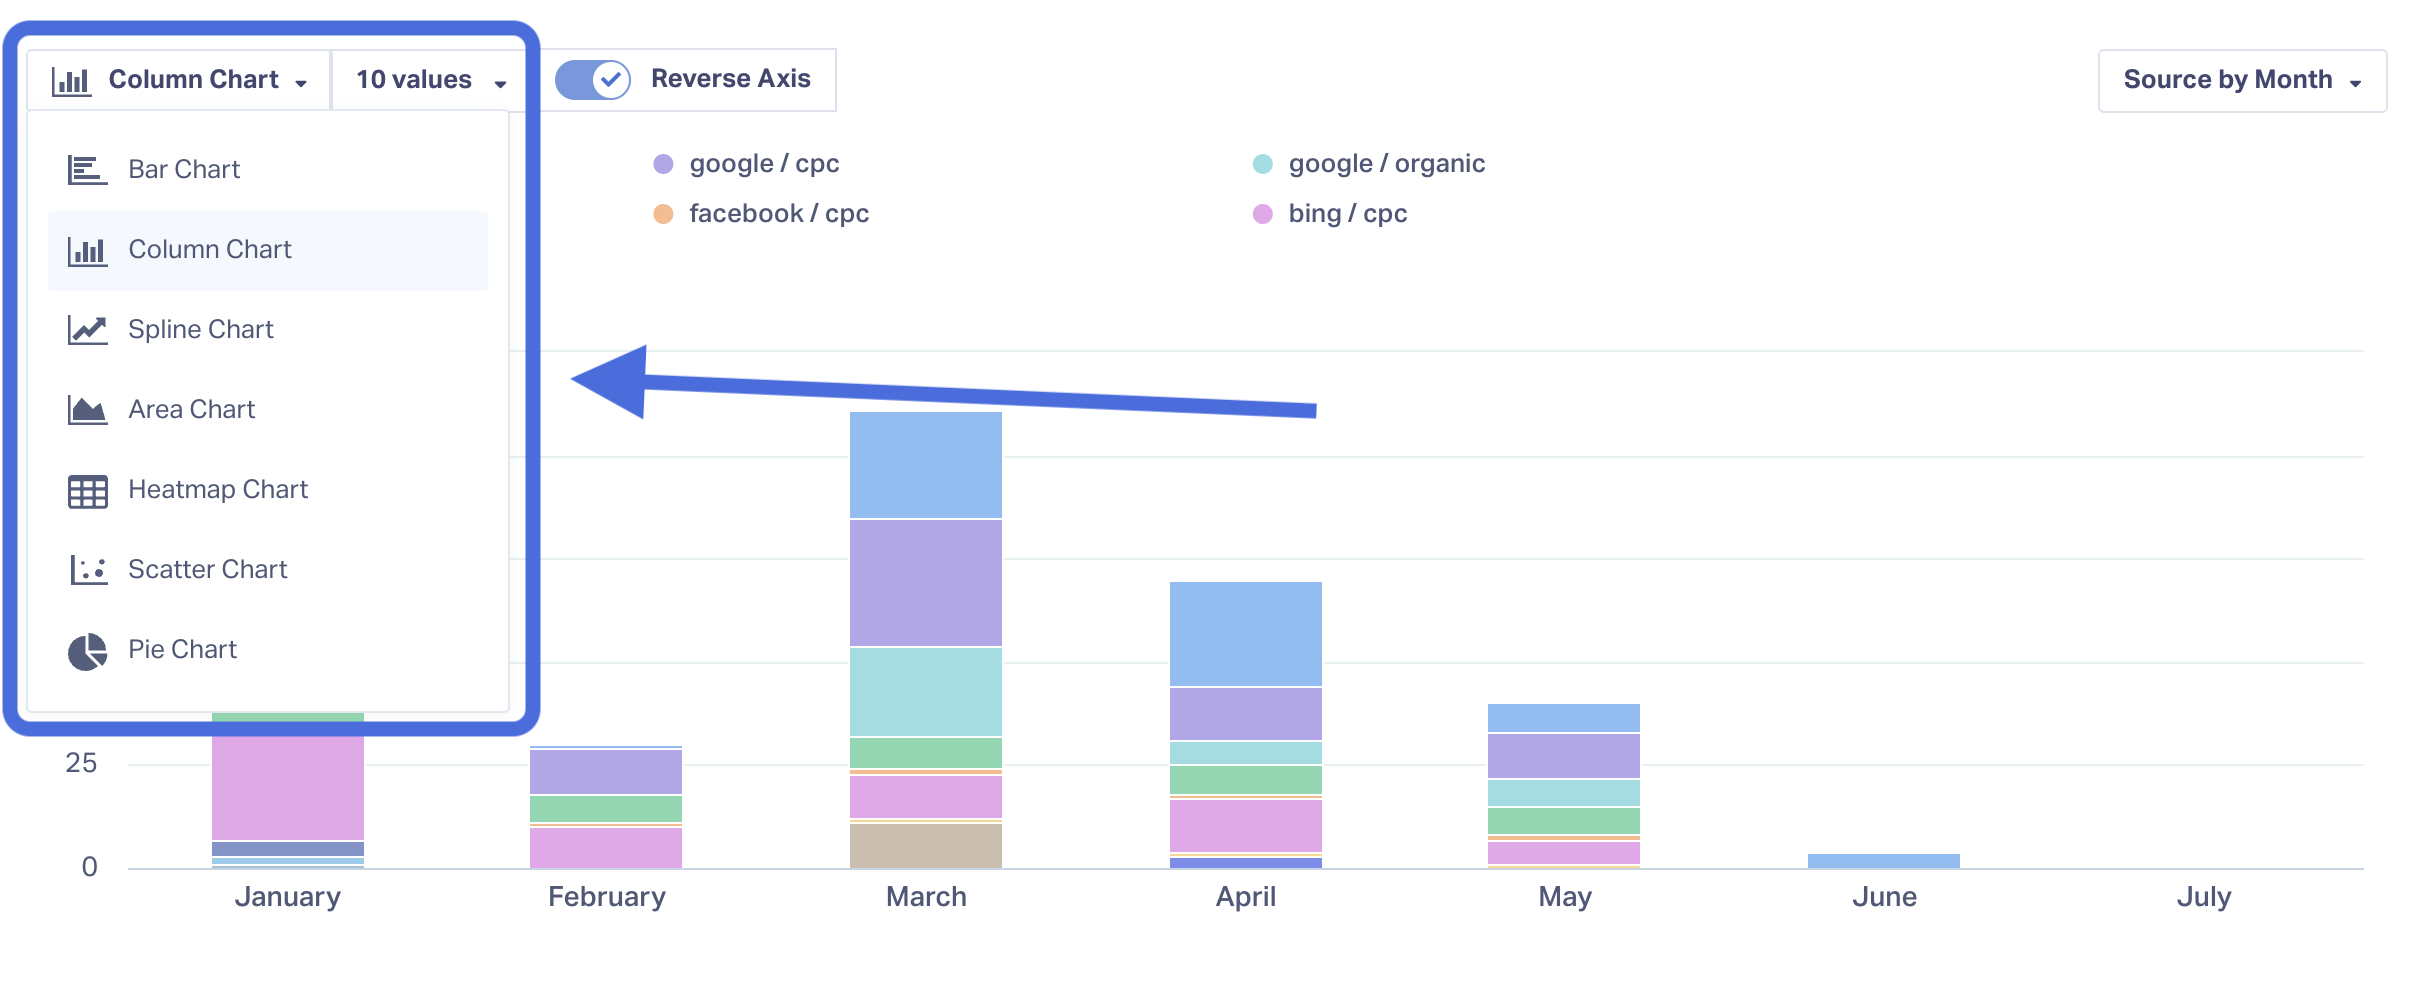
- You can also adjust the way your report looks using the chart button (try Column Chart for this report).
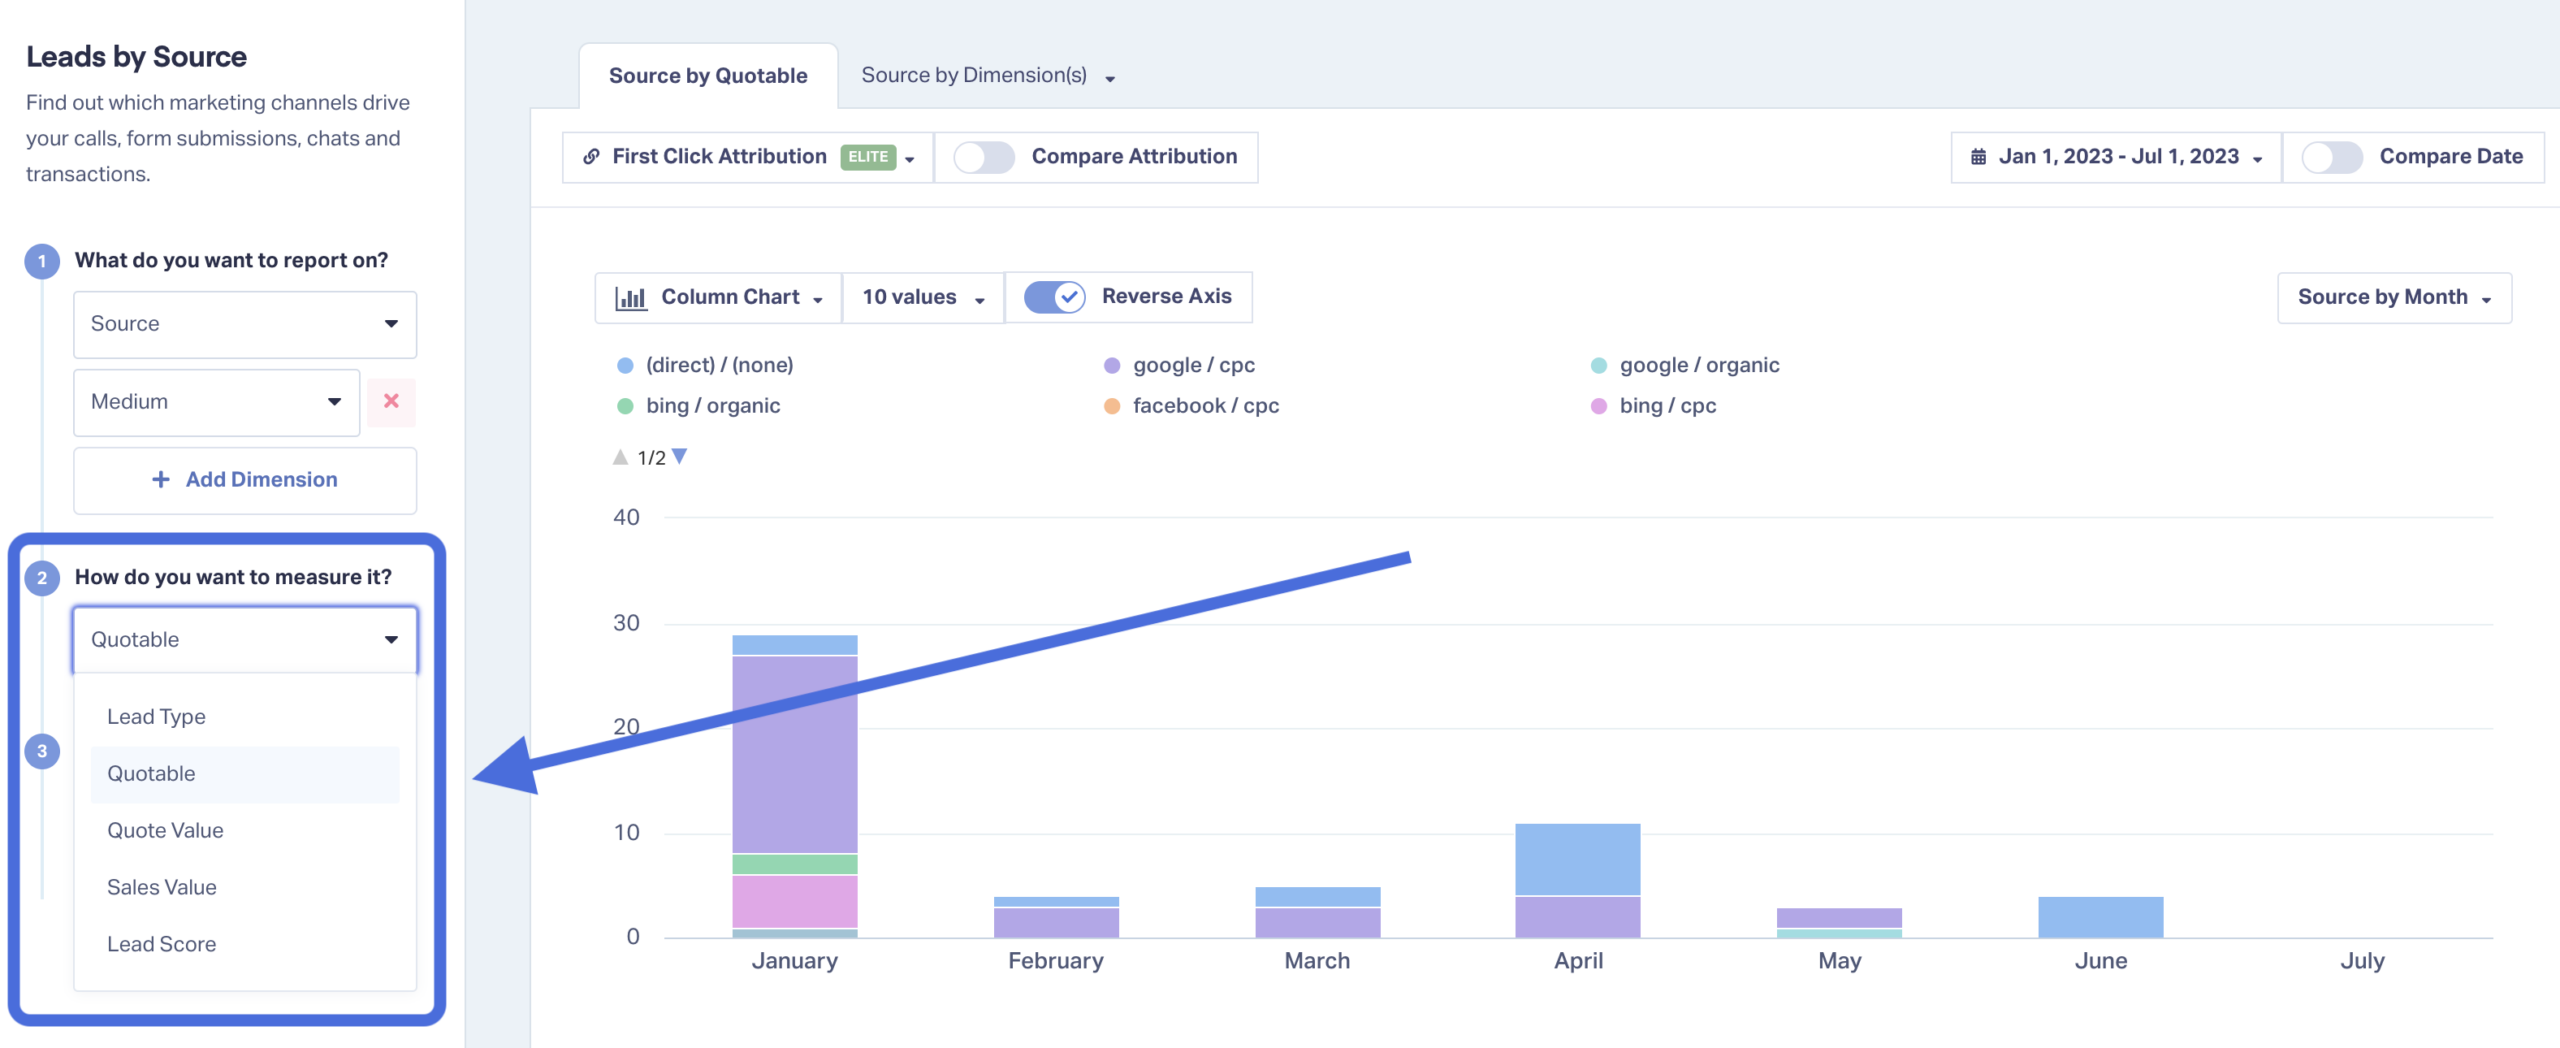
- Use the dropdown on the left to switch between measurement metrics (lead count, quotable lead count, quote/sales value, etc.).

Need Help?
Our support team is happy to help you set up your reports and find your peak lead times.
Get a FREE presentation of WhatConverts
One of our marketing experts will give you a full presentation of how WhatConverts can help you grow your business.
Schedule a Demo
Grow your business with WhatConverts


