


Your national campaign shows a respectable 3.2% conversion rate and $85 cost per lead. Decent (if somewhat mediocre) numbers, but the client seems satisfied.
But you're looking at the wrong data.
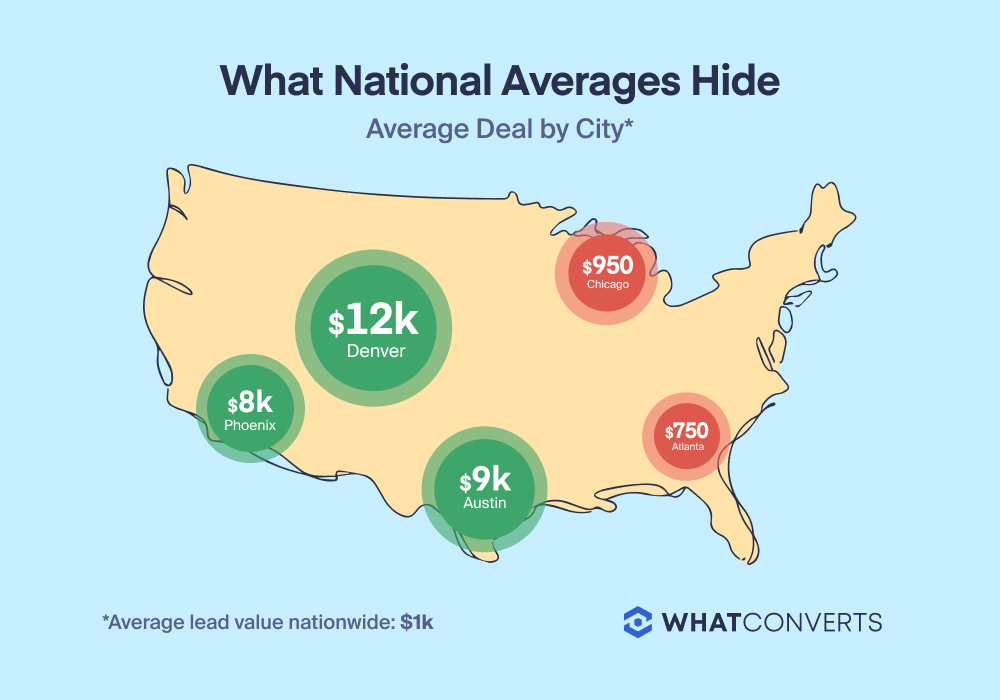
Hidden inside that mediocre average are three metro areas converting at 16%, with deal sizes 10x larger than everywhere else. Denver leads close at $12,000 average sale. Phoenix hits $8,500. Austin sits at $9,200.
Meanwhile, 10 other markets drag down your averages with $800 deals and abysmal conversion rates, burning 70% of your budget to subsidize underperformers.
The same trap hits regional businesses. Tri-state agencies see "New York metro" performance while missing that Montauk converts at $15k and Newark at $900. County-level blindness, same problem.
This is the geographic averaging trap: when aggregated data buries concentrated pockets of high-value opportunity. Location-level lead value analysis tells you exactly which markets to fund heavily, which to scale back, and how much money you're leaving on the table right now.
Note: Not a WhatConverts user yet? Start your free 14-day trial today or book a demo with a product expert to see how we help prove and grow your ROI.
When National Rollups Hide Regional Gold
Most marketing reports treat geography as decoration. A map showing lead volume by state, maybe a quick glance at top cities. But the location where leads convert rarely gets the same scrutiny as channels or campaigns.
That's a costly mistake.
A national HVAC company runs Google Ads at $45,000/month with these national rollup numbers:
- 180 total leads
- $250 cost per lead
- 2.8% conversion rate
- $405,000 estimated revenue
Looks efficient. Leadership approves the budget.
But filter by metro area and the story fractures:
| Metro Area | Leads | CPL | Conv Rate | Avg Sale | Est Revenue | ROAS |
| Phoenix | 12 | $292 | 15% | $8,500 | $102,000 | 29x ⭐ |
| Denver | 8 | $438 | 18% | $12,000 | $96,000 | 27x ⭐ |
| Austin | 10 | $350 | 14% | $9,200 | $92,000 | 26x ⭐ |
| Chicago | 24 | $146 | 2.1% | $950 | $22,800 | 6.5x |
| Atlanta | 31 | $113 | 1.8% | $725 | $22,475 | 6.4x |
| 8 other markets | 95 | $289 | 1.2% | $680 | $64,600 | 2.3x |
Three metros deliver $290,000 in revenue on $10,500 in spend (28x ROAS). The remaining ten markets generate $110,000 on $35,000 (3x ROAS).
But because reports show national averages, the budget gets spread evenly. Phoenix, Denver, and Austin—the markets printing money—get the same per-lead investment as markets barely breaking even.
The campaign isn't mediocre. It's exceptional in three places and terrible everywhere else.
Why Geographic Performance Stays Hidden
Most analytics platforms can show location data. But they don't surface it as a decision-making layer.
Location shows up as:
- A demographic filter buried three clicks deep
- An IP address that's often inaccurate (VPNs, mobile carriers, corporate networks all scramble the data)
- A map visualization that shows volume, not value
- A report that groups by state rather than metro—collapsing high-performing cities into statewide averages
Meanwhile, self-reported location data sits trapped in form submissions and call recordings. Someone says "I'm in North Denver, near Westminster" during a sales call. That's gold. But it never makes it into your performance dashboard because call data lives in one system and campaign data lives in another.
The result? Geographic insight requires manual work most teams never prioritize.
You'd have to export lead lists, match them to sales outcomes, geocode addresses, cross-reference with ad spend by region, then build custom reports showing value by metro.
So nobody does it. And high-value markets stay invisible.
Read More: Advanced Reporting and Clear Attribution Powers 22% Growth [Case Study]
What Location-Level Lead Value Analysis Reveals
When you analyze performance by self-reported location and tie each lead to revenue, patterns emerge that national data completely obscures:
Hidden concentration. A small number of metros drive disproportionate revenue. In the HVAC example, 3 of 38 markets generated 72% of total revenue but received only 30% of budget.
Deal size variance. Leads from expensive metros often convert at higher values. A Phoenix lead books a full system replacement. A rural Georgia lead wants a $150 maintenance call. National CPL doesn't account for that.
Competitive landscapes. Some markets are saturated—50 competitors bidding on the same keywords drive up CPL while driving down conversion quality. Other markets have untapped demand and lower competition.
Seasonal patterns by region. Phoenix HVAC demand spikes April through September. Denver peaks June through August. National campaigns that don't shift budget geographically waste money heating empty rooms.
The Fix: Self-Reported Location + Lead Value Tracking
Getting accurate geographic performance data requires combining two elements most platforms keep separate:
1. Capture self-reported location on every lead.
When someone fills out a form, include a location field. When they call, capture what they say during the conversation. Self-reported data is exponentially more reliable than IP-based guesses.
WhatConverts automatically captures location from form fields and extracts it from call transcriptions, tying each lead to the metro area they actually operate in.
2. Assign value to every lead based on actual sales outcomes.
CPL alone won't reveal geographic opportunity. A $200 lead that closes a $10,000 deal outperforms a $50 lead that goes nowhere.
Track which leads convert, what they bought, and how much revenue they generated—then map that back to location.
3. Report by metro area, not state or country.
State-level data still averages out the extremes. Metro-level reporting reveals which specific markets deserve more investment.
WhatConverts allows you to build reports by metro area with complete lead value visibility, showing exactly where your high-revenue leads come from and which campaigns drove them.
Scenario in Action: $180K Revenue Concentration in Two Zip Codes
A commercial roofing company in Texas runs a state-wide Google Ads campaign. Overall performance looks mediocre: 3.1% conversion rate, $92 CPL, acceptable but not exceptional.
But when they filter by self-reported location and mapped to closed deals, two zip codes in Dallas account for $180,000 of their $320,000 in total revenue—despite representing only 8% of their lead volume.
Armed with that insight, they:
- Tripled ad spend in those two Dallas zip codes
- Created Dallas-specific landing pages highlighting local commercial projects
- Cut budget from 6 underperforming markets entirely
Result: 47% increase in revenue with 12% decrease in total ad spend.
The opportunity was always there. They just couldn't see it until location and lead value connected.
From Averages to Precision
Geographic rollups kill optimization.
When Phoenix, Atlanta, and rural Kansas all blend into one national conversion rate, budget decisions become guesswork. High-performing markets get underfunded. Terrible markets keep draining budget because "the campaign works on average."
With location-level lead value analysis, precision replaces guessing:
- Capture self-reported location on every lead
- Track which leads close and at what value
- Report by metro area to reveal concentration patterns
- Shift budget toward markets with proven high-value demand
- Stop subsidizing underperformers with high-performer budgets
That's how top agencies turn "solid national performance" into concentrated regional dominance.
Ready to uncover which metros are quietly driving your revenue?
Start your free 14-day trial of WhatConverts today or book a demo with a product expert to see how we help prove and grow your ROI.
Get a FREE presentation of WhatConverts
One of our marketing experts will give you a full presentation of how WhatConverts can help you grow your business.
Schedule a Demo
Grow your business with WhatConverts


