


Every missed call is a missed opportunity. With the Answered vs. Unanswered Calls report in WhatConverts, you can see—at a glance—how effectively your clients (or your own team) handle the leads you work so hard to generate. Stop guessing, start proving ROI, and uncover the hidden revenue that slips away when phones go unanswered.
What You Can Do With the Answered vs. Unanswered Calls Report
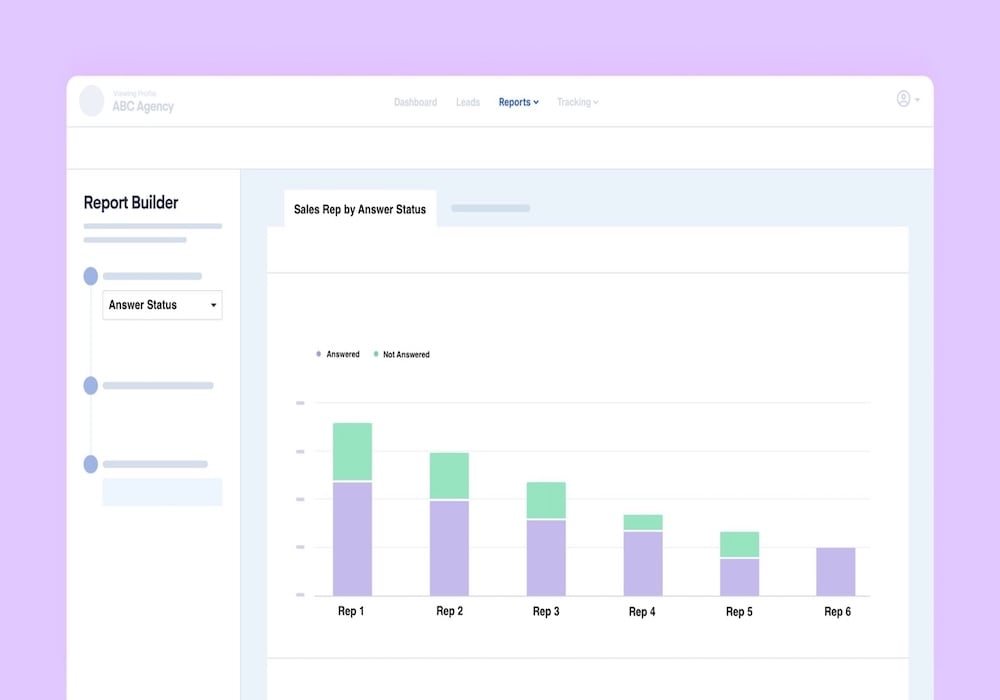
One of the great things about the Answered vs. Unanswered Calls Report is that it’s incredibly flexible.
Sure, you can use it to see your total answer rates across the board. But you can also get creative with it and build a report like this: 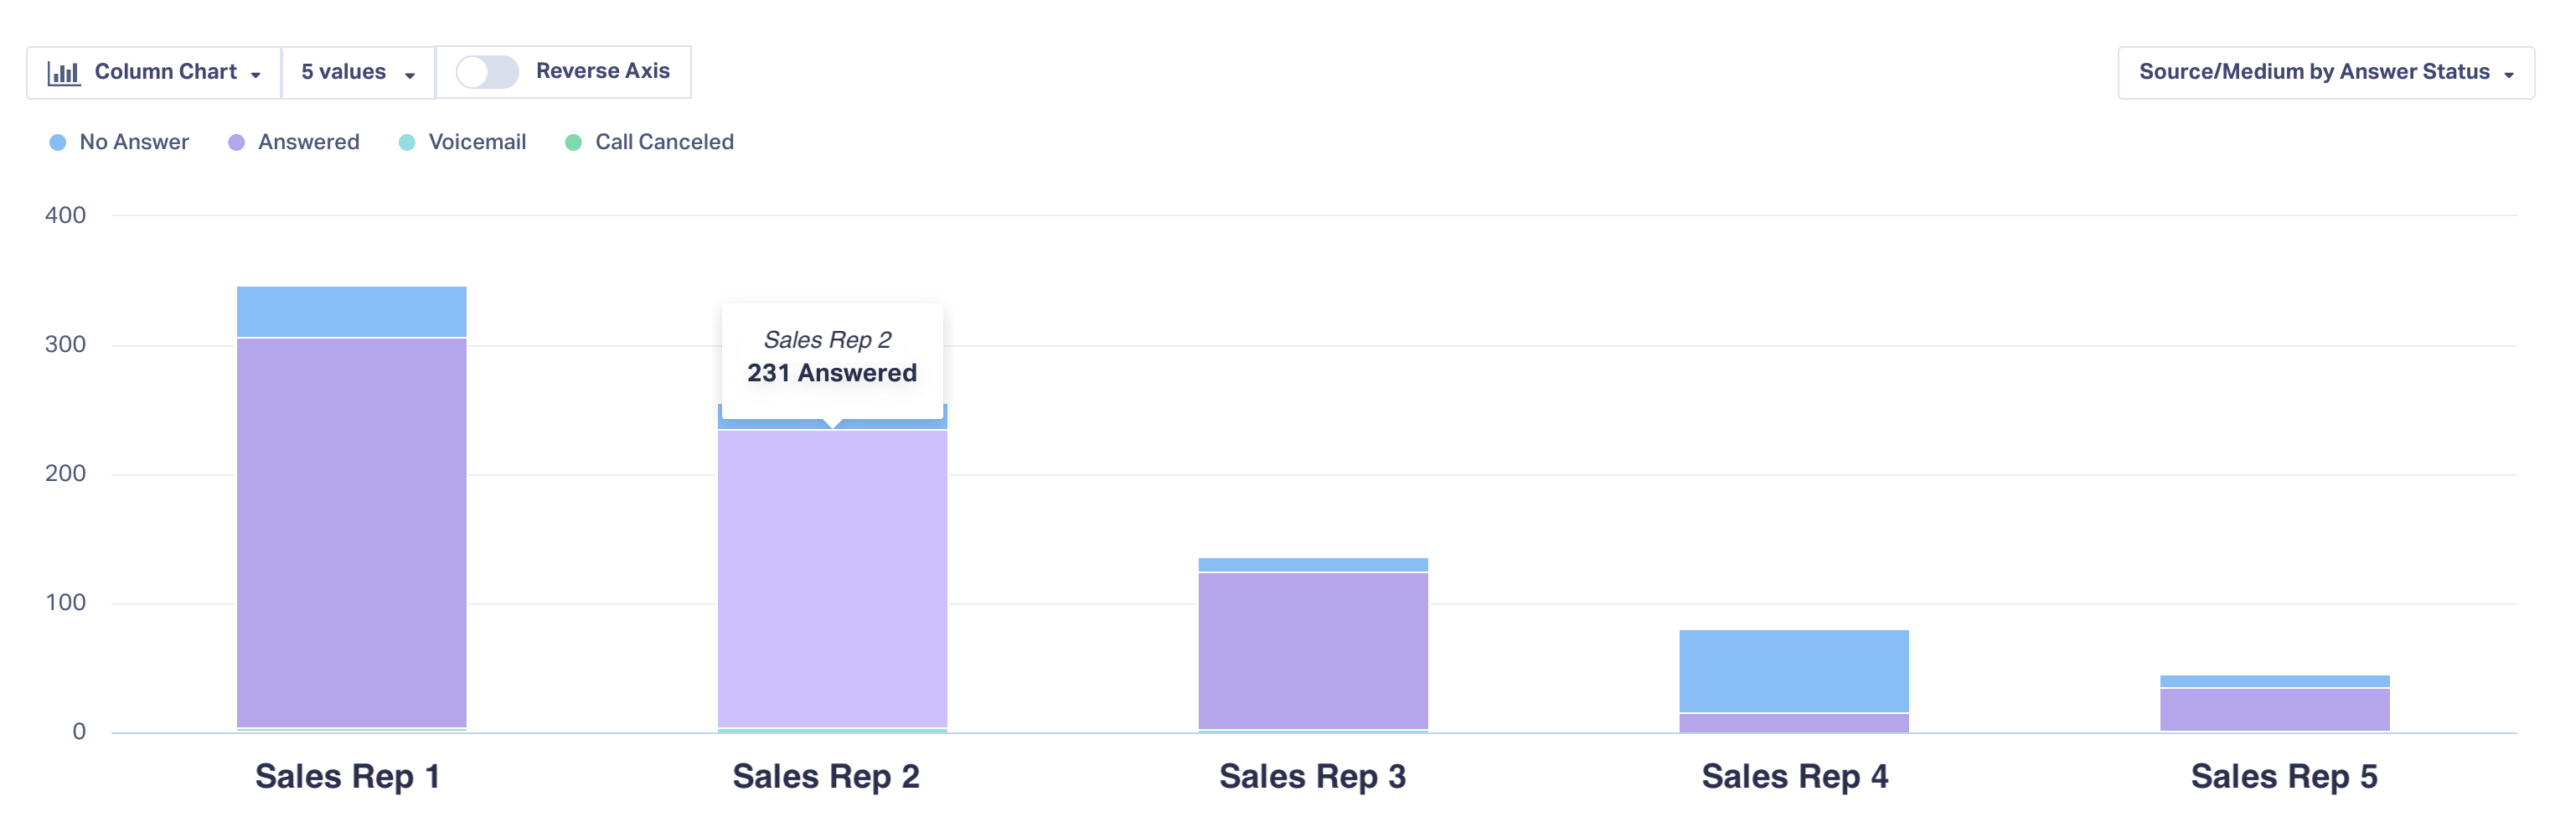
Here, you can see answer rates broken down by sales rep. With this data, you can report back to your clients on who is picking up the phone regularly and who is dropping the ball.
| Benefit | Why It Matters |
| Prove the Cost of Missed Calls | Combine answer status with quote value to show clients the exact dollar amount they’re leaving on the table. (“You lost $2,000 last month just by not picking up!”) |
| Staff Smarter by Time of Day | Chart answer status by hour to find peak times when your team gets overwhelmed, then adjust staffing accordingly. |
| Benchmark Multi-Location Performance | Franchise or multi-branch? Compare answer rates by location and intervene where customer experience is falling short. |
| Pinpoint Under-Performing Channels | Break answer rates down by marketing source (Google Ads, Bing, Facebook, etc.) to see which channels drive calls that are routinely ignored. |
Bottom line: Use this single report to protect your agency’s reputation, spark meaningful client conversations, and uncover easy wins that boost revenue. It’s this kind of reporting that’s helped WhatConverts users turn into a true marketing partner, not just a lead vendor.

Setting Up the Answered vs. Unanswered Calls Report
- Log in to your WhatConverts account.
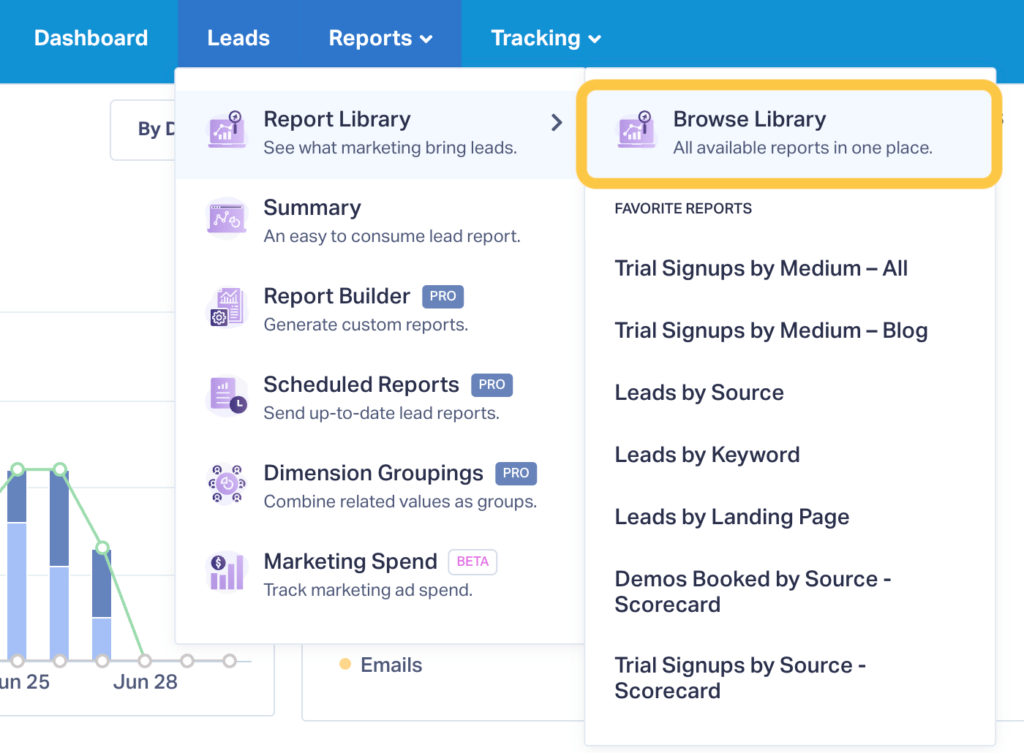
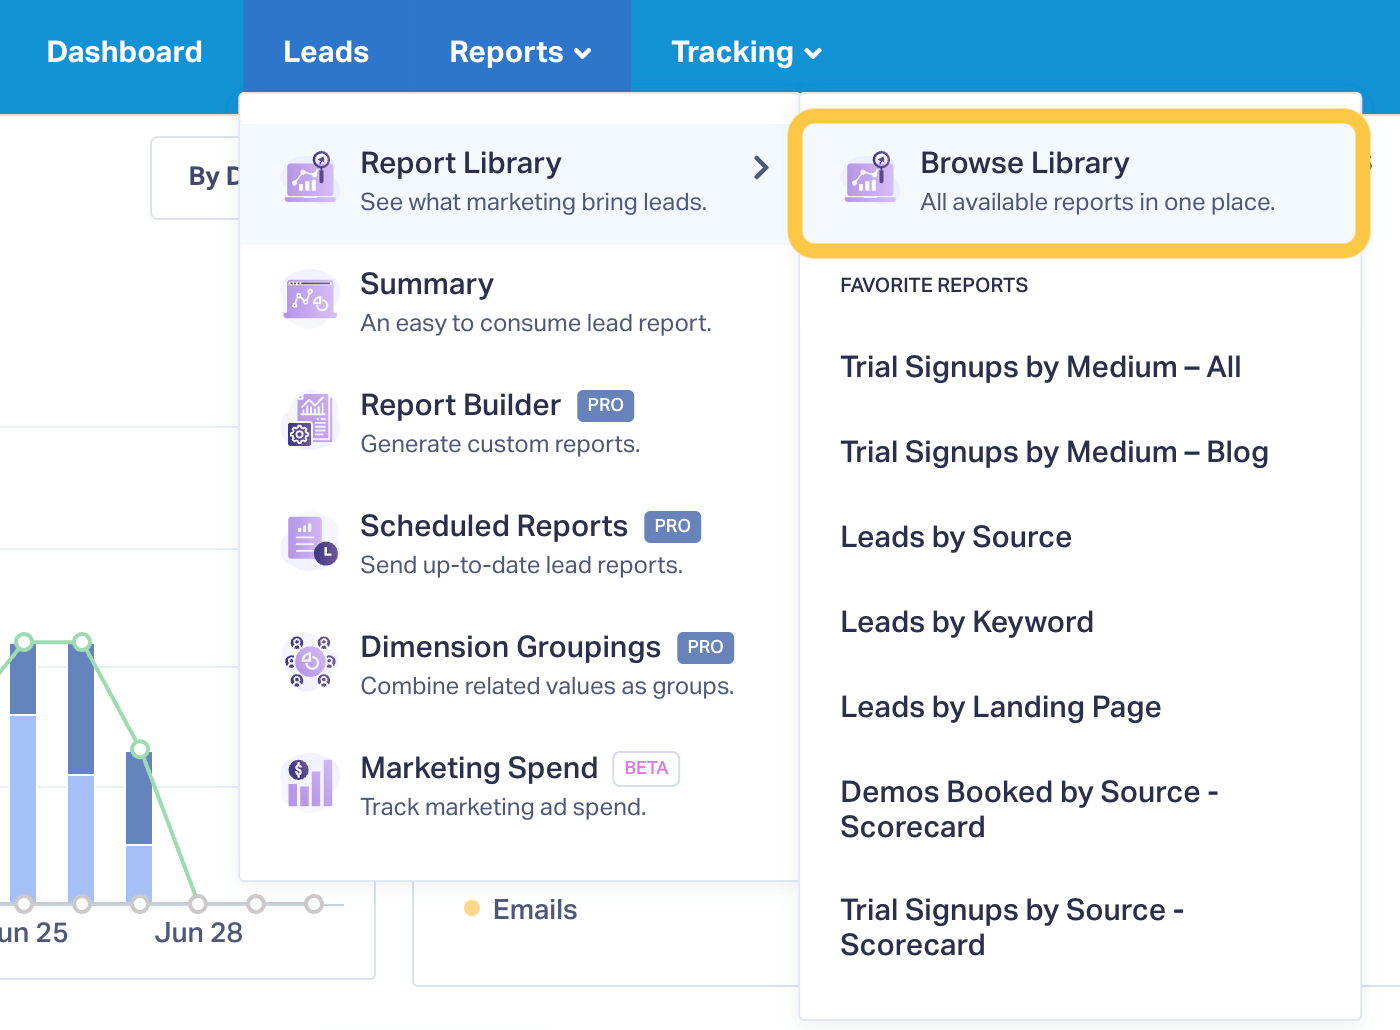
- In the main navigation, click Reports → Report Library → Browse Library.
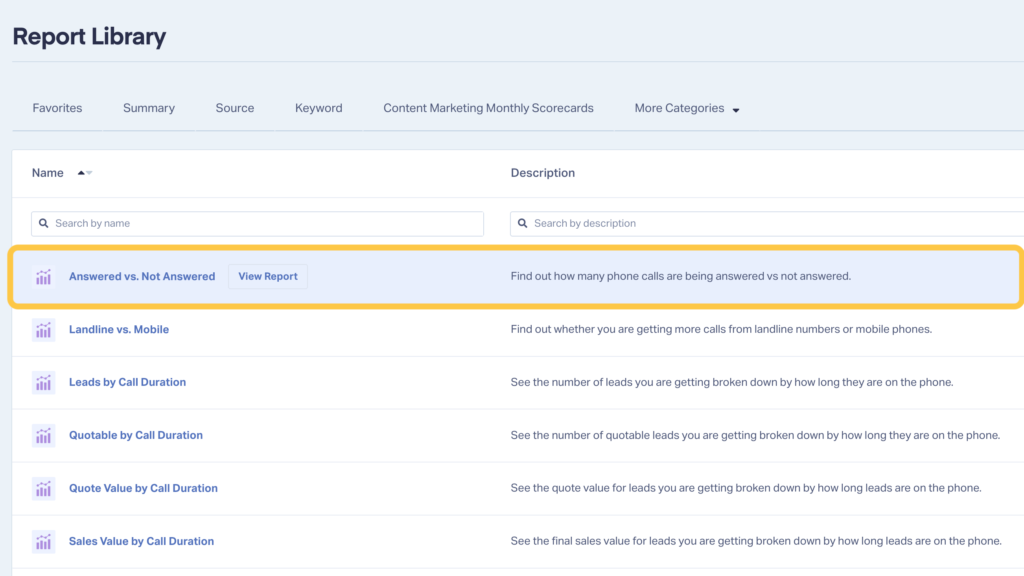
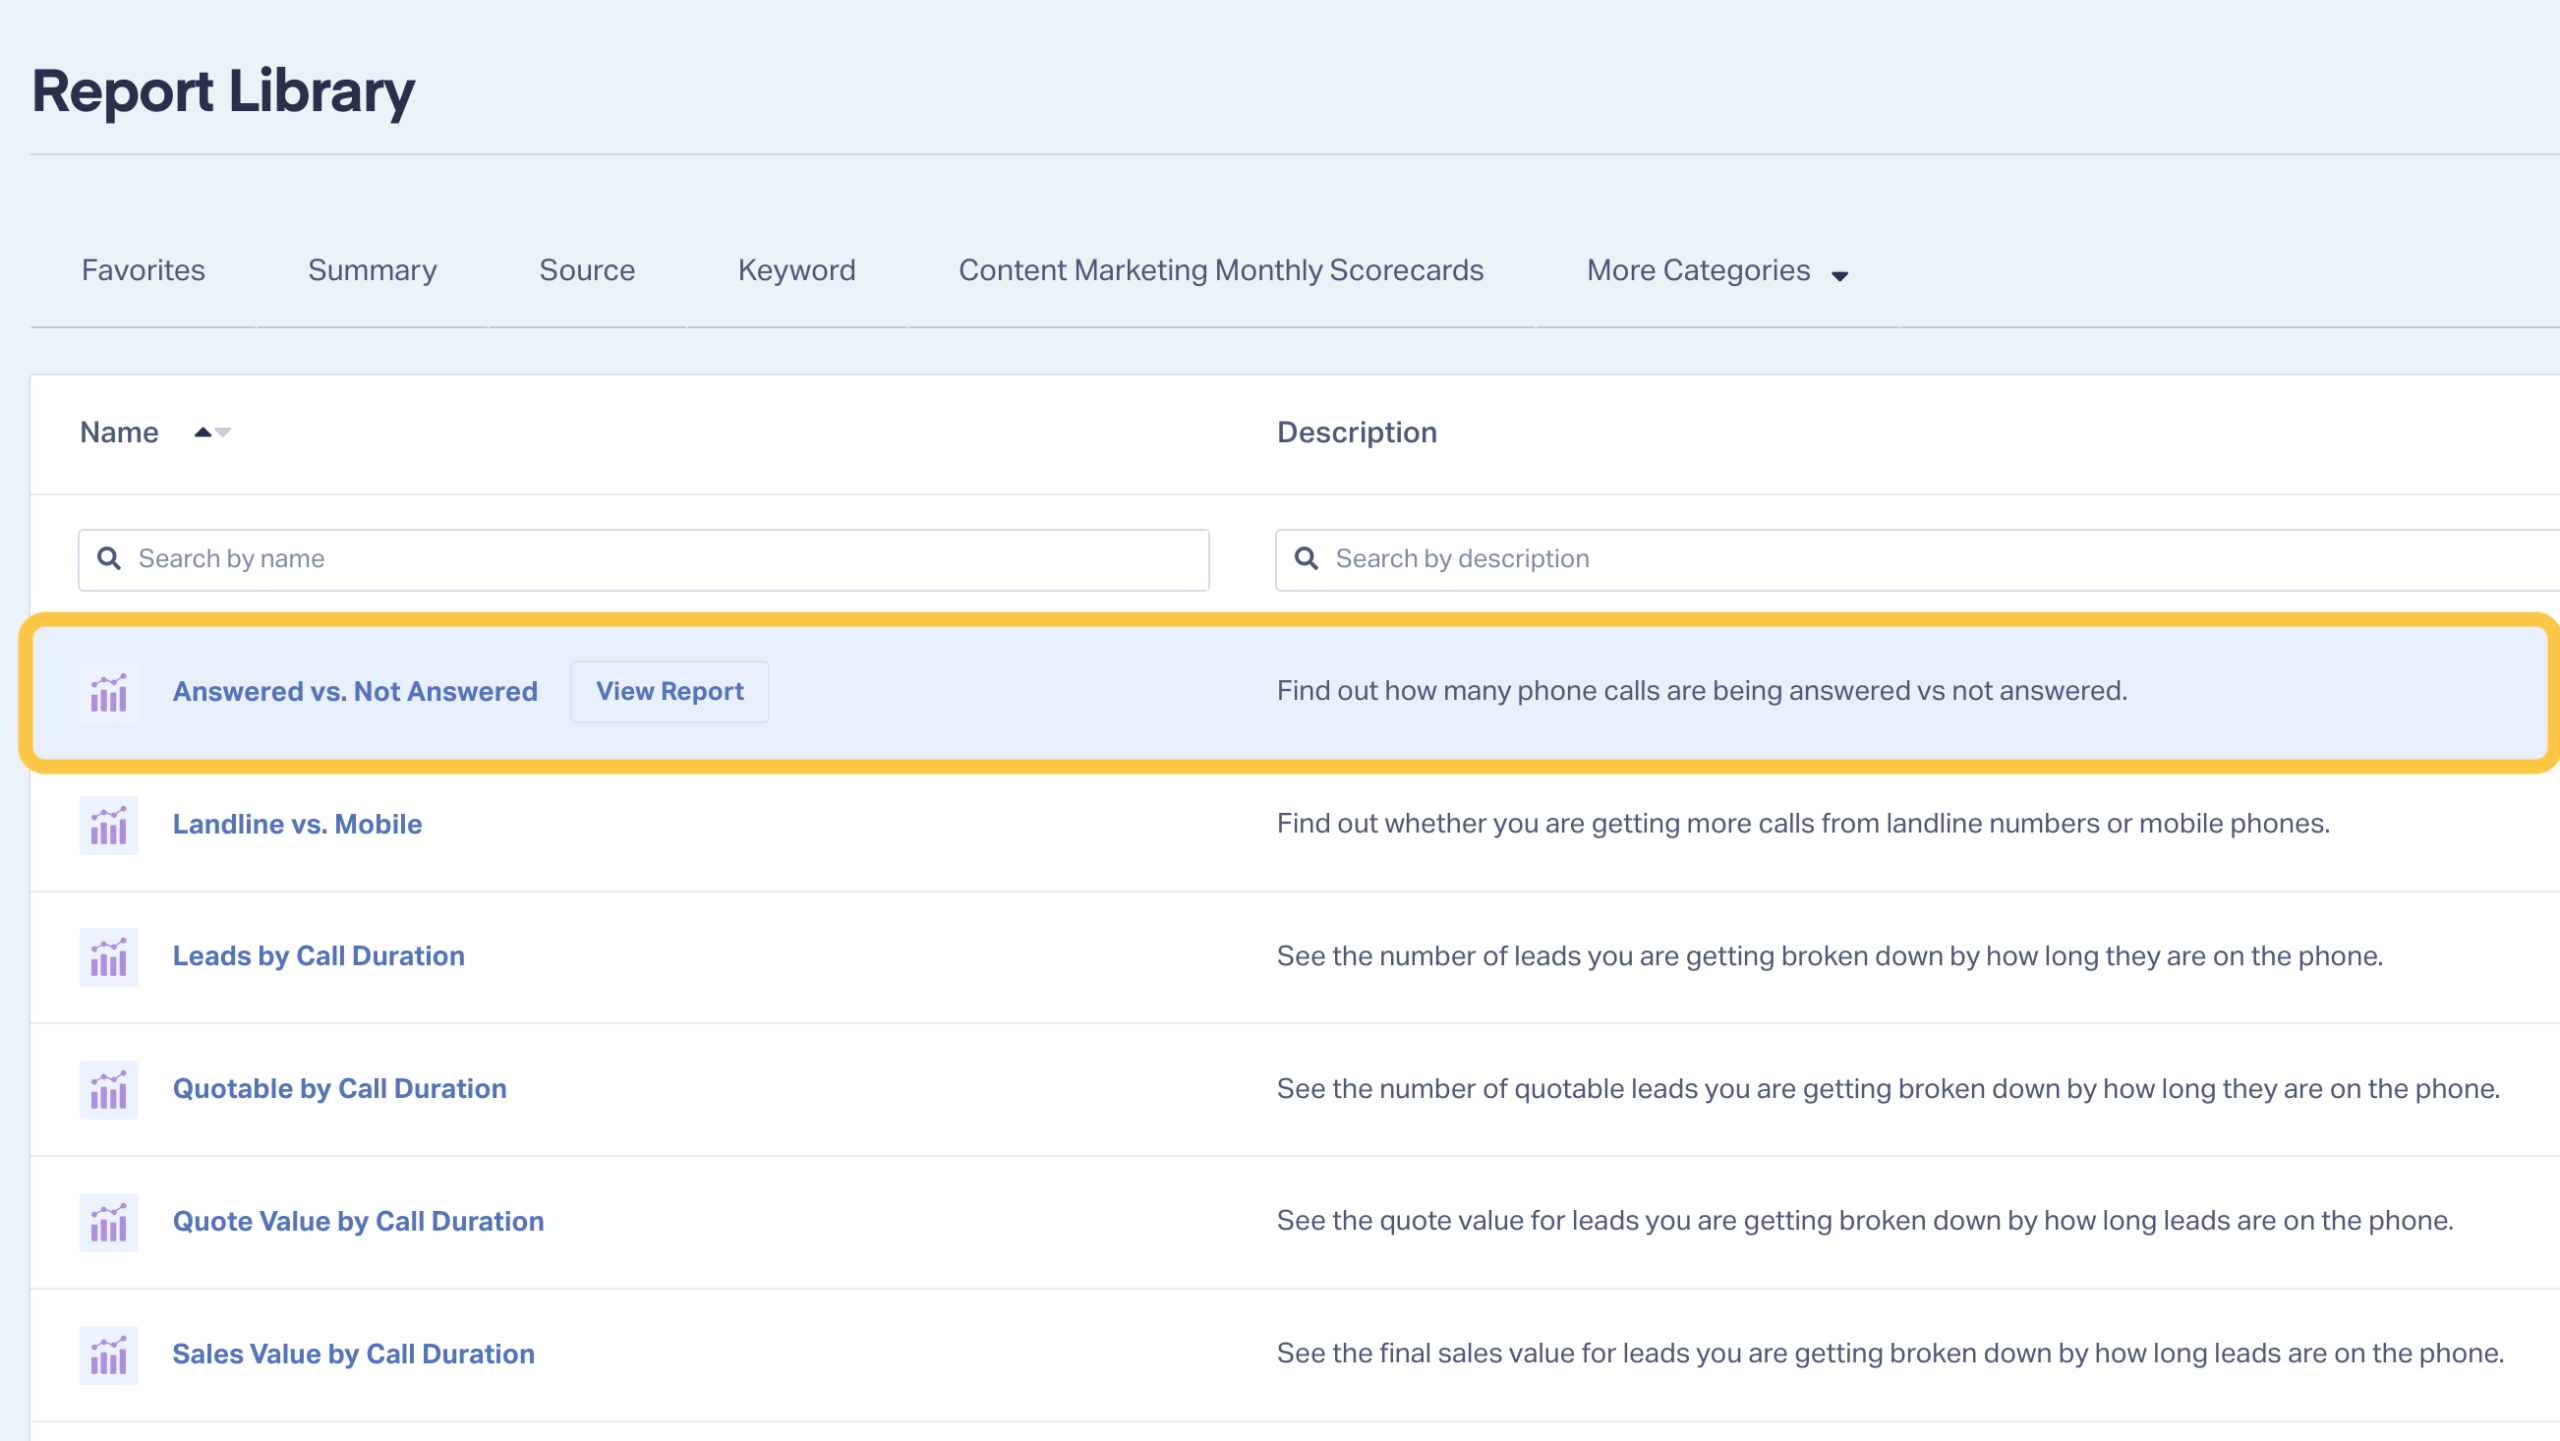
- Under More Categories, choose Calls.
- Click the Answered vs. Not Answered report to view overall results for your selected date range.
- You’ll see a report like this that shows total answered vs. not answered call rates.
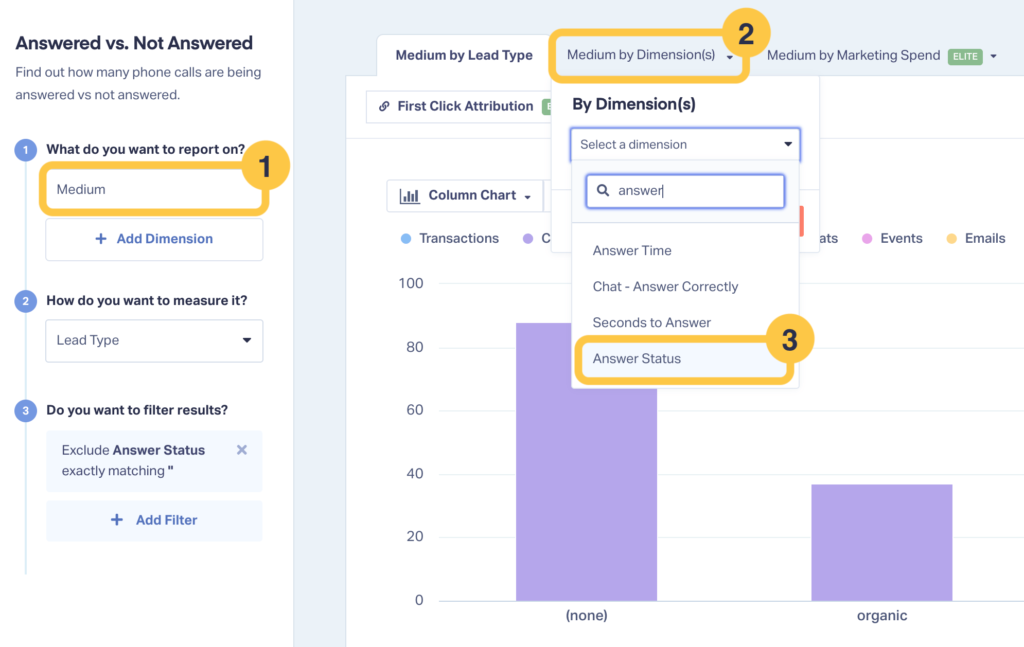
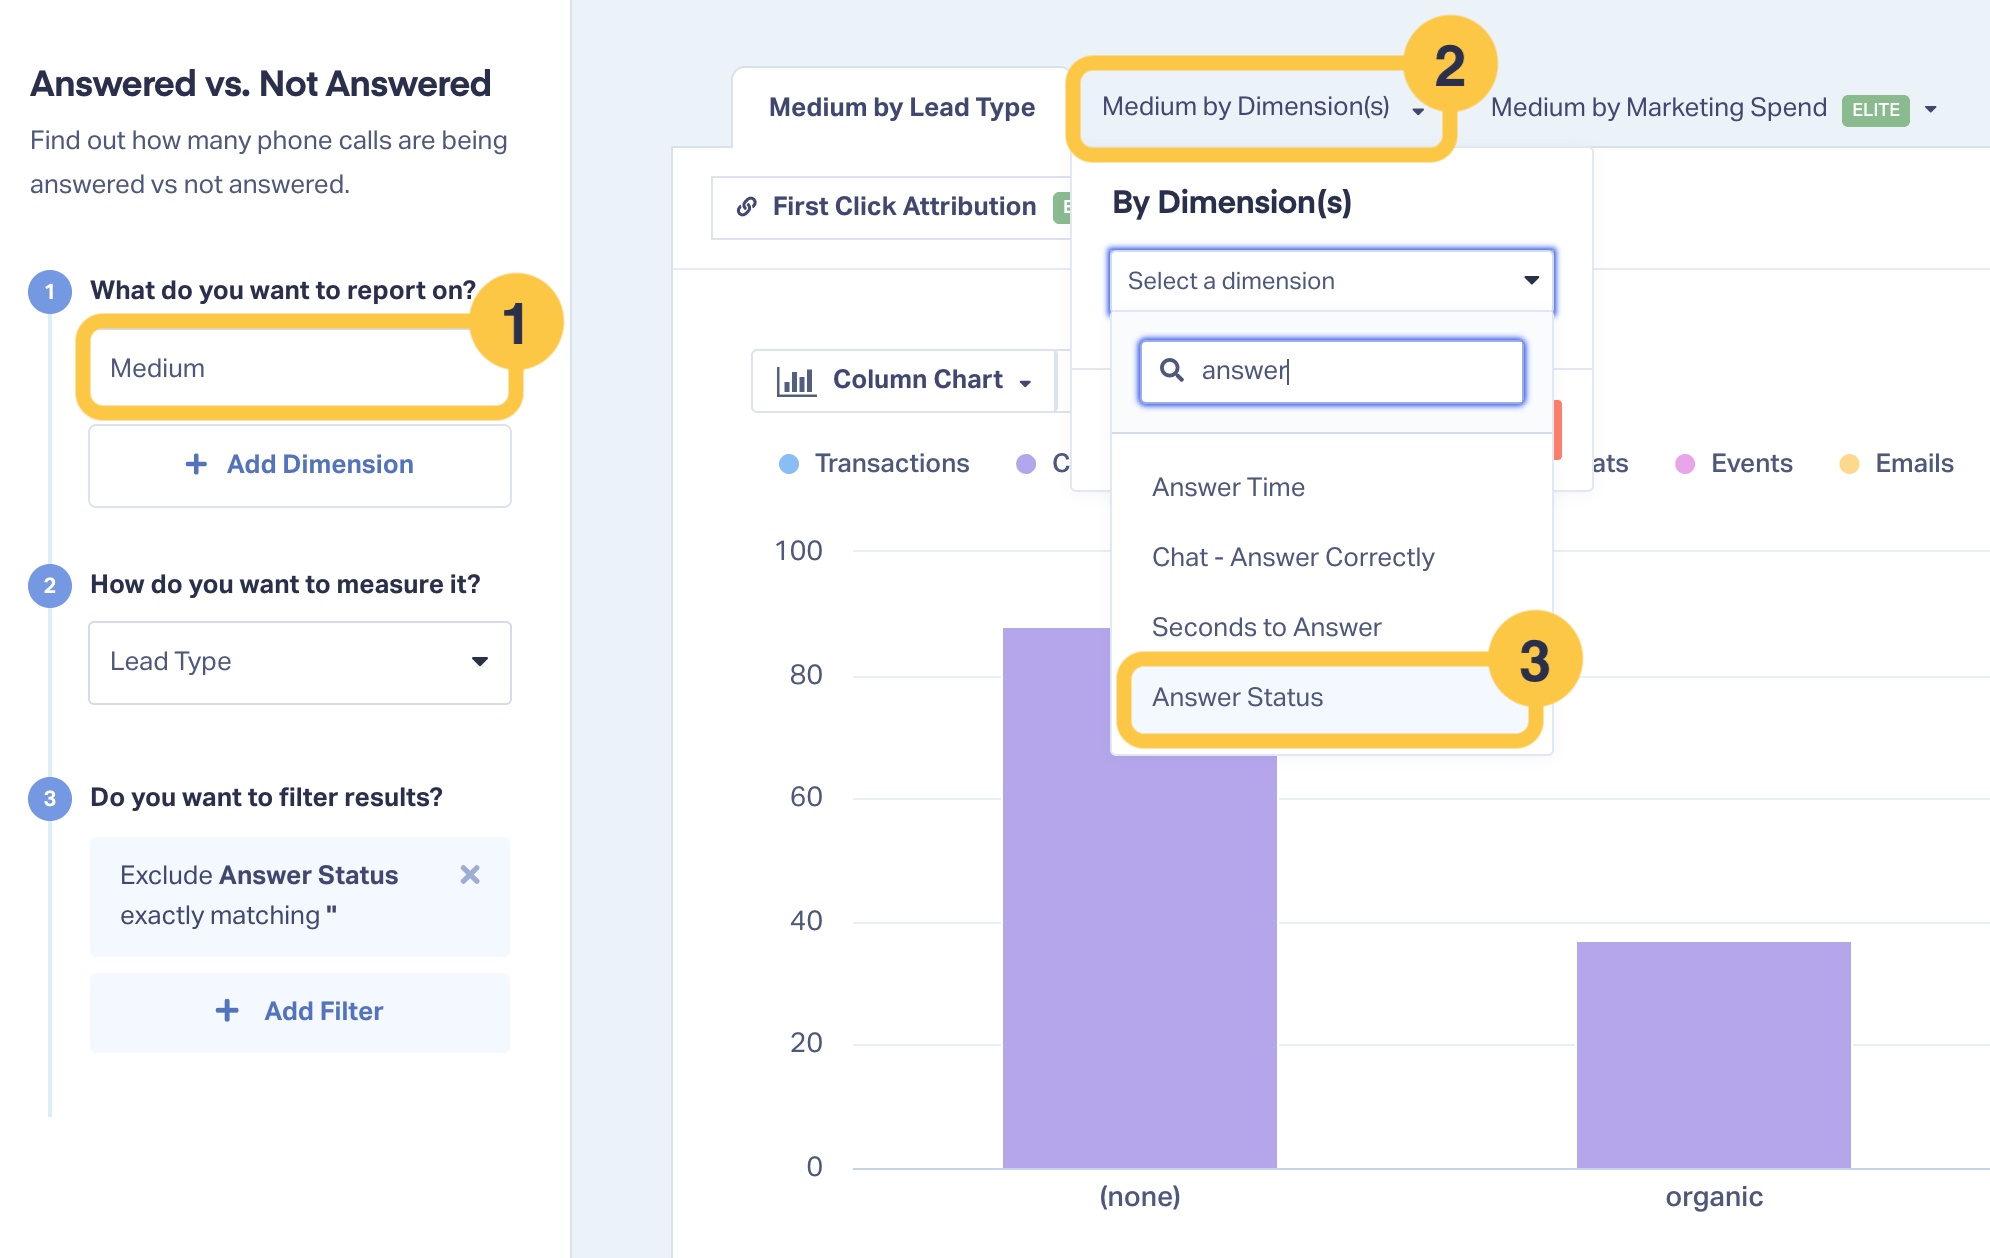
- For an even more insightful report, you can show a dimension broken down by answer rate. For example, to see answer rates by Medium:
- 1. Enter Medium as your dimension
- 2. Click the Medium by Dimension(s) tab
- 3. Choose Answer Status
Need Help?
Our support team is happy to help you set up your Answered vs. Not Answered Report.
Get a FREE presentation of WhatConverts
One of our marketing experts will give you a full presentation of how WhatConverts can help you grow your business.
Schedule a Demo
Grow your business with WhatConverts


