


WhatConverts gives you an enormous amount of flexibility when it comes to your reporting. You can mix and match dimensions to tell the exact story your clients need to see a clear ROI.
However, what if you want to see results for an entire year broken down by month, week, or even day?
Luckily, Timeline View Reporting in WhatConverts lets you do just that, so you can compare trends, spot opportunities, and get more nuanced insights in just a few clicks.
What You Can Do With Timeline View Reporting
Let’s say you regularly use the Leads by Source report when updating your clients. On its own, this report lets you see which channels are generating the most leads, quotable leads, and value.
But what if you wanted to know:
- Which months are the peak season for a particular client?
- Which channels tend to pick up/slow down based on the time of year?
- How the last 6 months compare to results from a year ago?
- Whether marketing decisions have led to long-term growth trends?
With Timeline View Reporting, you can see all of that information (and more).
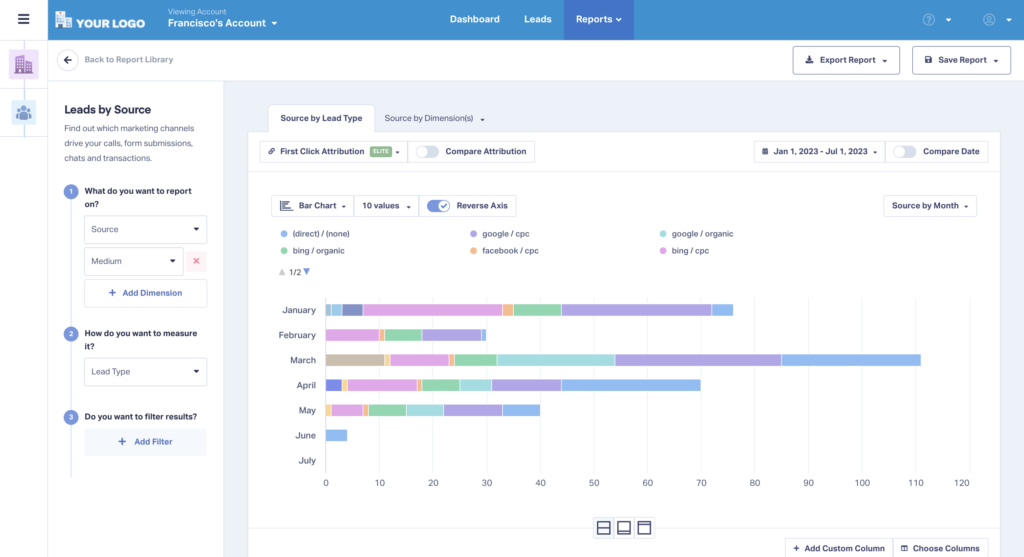
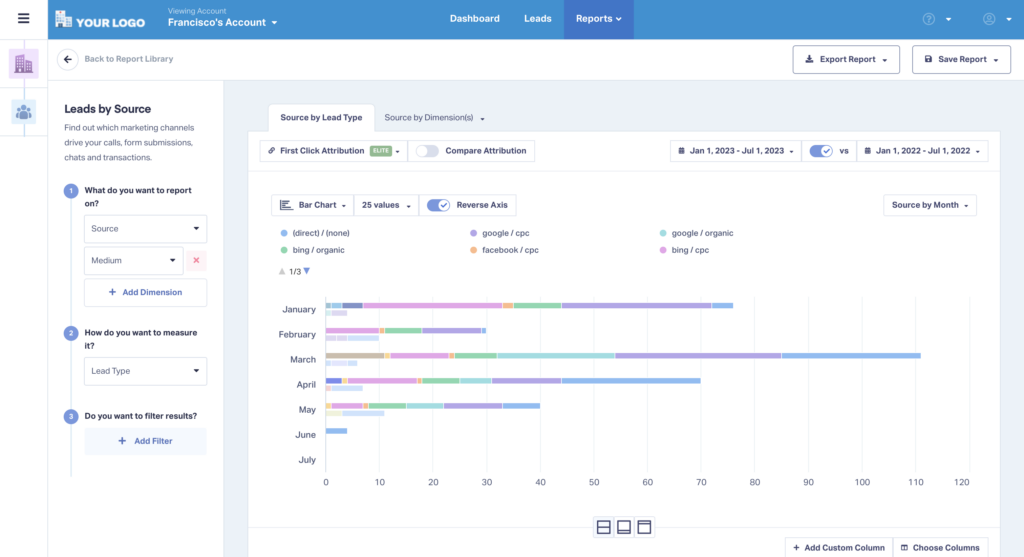
For example, in the image below, you can see the number of leads generated by source on a month-to-month timeline. You can also see the shadowed-out data comparing this year’s results to those from last year.
Best of all, you can add a layer of timeline data to any of your reports in just a few clicks.
How to Use Timeline View Reporting
To add a timeline view to your reporting:
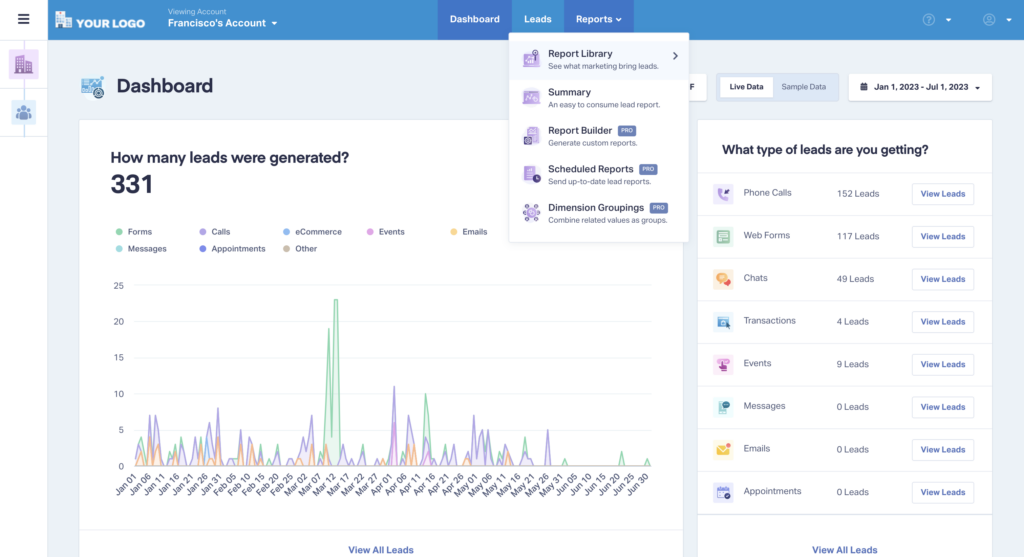
- Log into your WhatConverts account and choose/build your desired report.
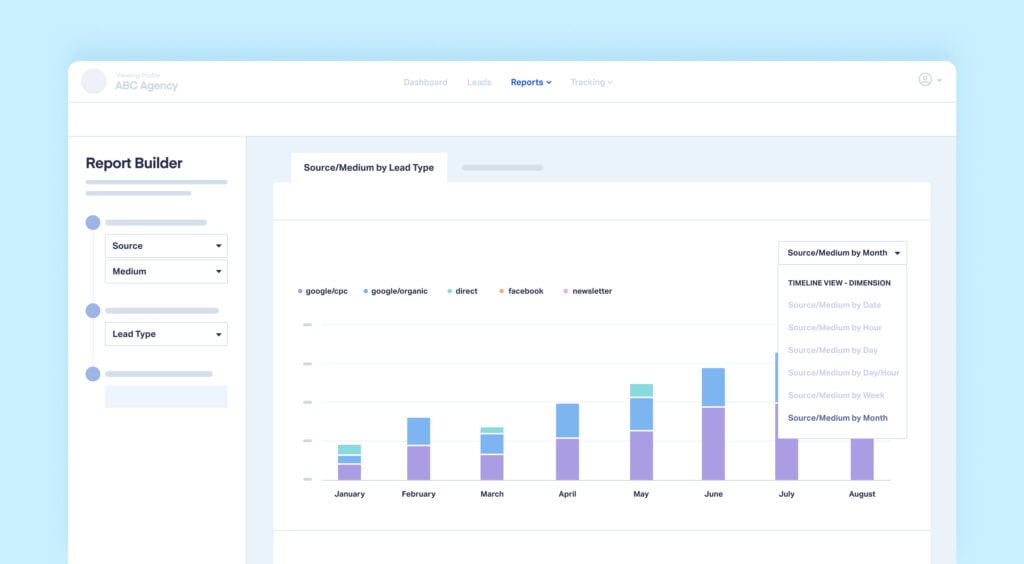
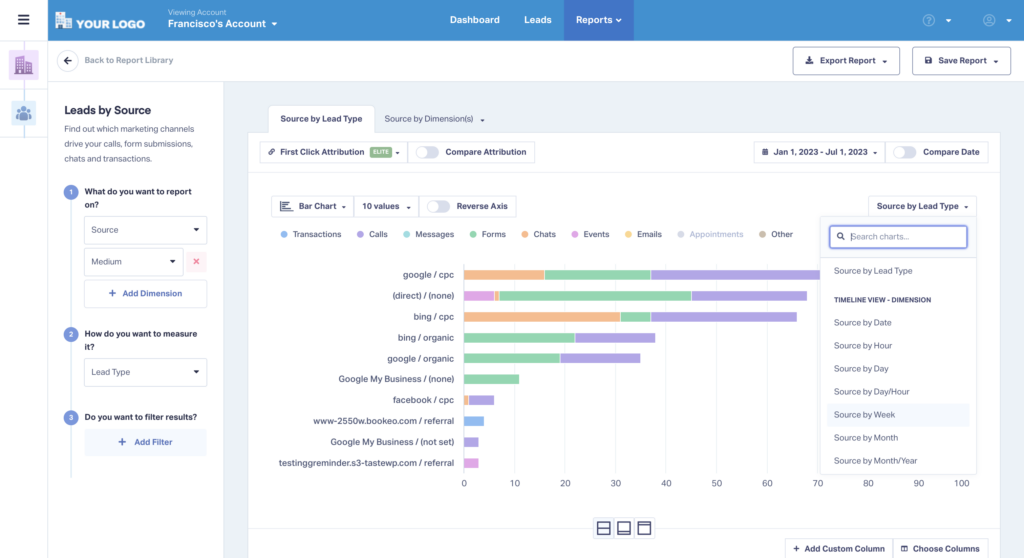
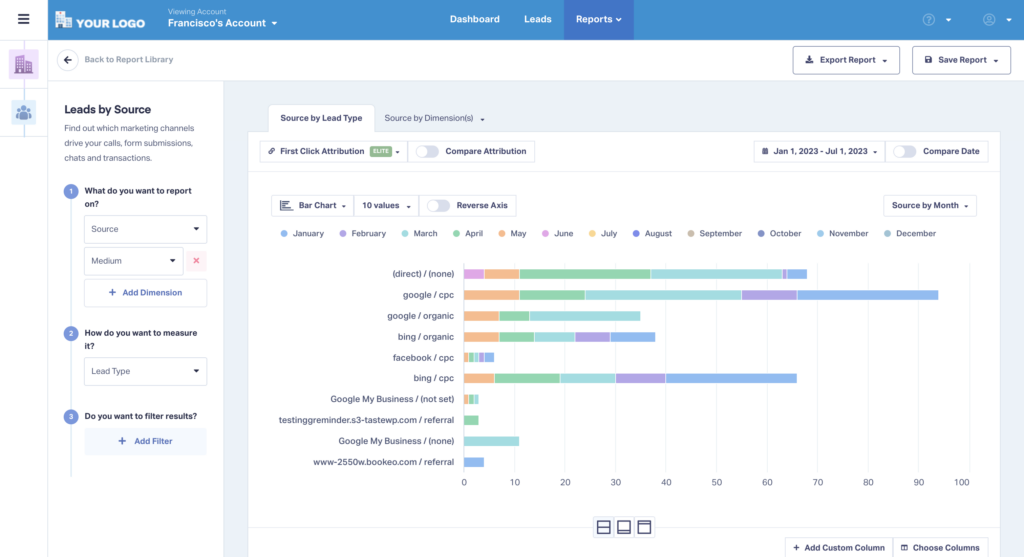
- Next, choose the Timeline View you’d like to see (Year, Month, Week, Day, etc.) from the dropdown menu on the right (“Source by Lead Type” in the example below). You can create your timeline view based on the dimension (e.g., “Source”) or the metric (e.g., “Lead Type”).
- You’ll now see a breakdown of your data by the time measure you chose.
- Activate the “Reverse Axis” option to see your dimension and metric according to your time measure (e.g., Leads by Month).
- You can also use the “Compare Data” option in the upper right to compare this data to another time period (e.g., Previous Year).
Need Help?
Our support team is happy to help you start using Timeline View Reporting.
Get a FREE presentation of WhatConverts
One of our marketing experts will give you a full presentation of how WhatConverts can help you grow your business.
Schedule a Demo
Grow your business with WhatConverts


