


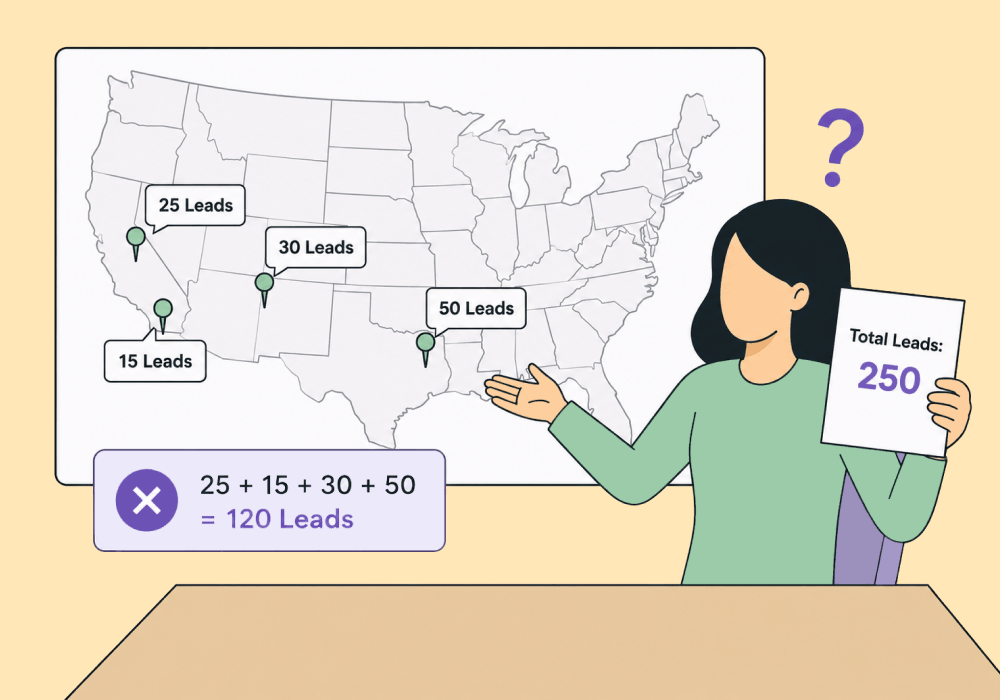
Aggregate reporting was built for one location. Multi-location clients break it.
A single campaign can drive leads to four phone numbers, across four locations, each answered by a different team. Roll all of that up into one number and the account looks healthy. Spend is efficient. Leads are flowing. Everyone's happy.
Then you try to answer a location-level question and the whole thing falls apart:
- Which location is actually winning?
- Which one is being starved?
- Which campaign looks weak only because its leads are landing under the wrong location?
The aggregate report can't tell you. And the missing location-level truth is exactly what decides where the budget should go.
This article shows how to report multi-location clients without flattening them, so per-location performance stays visible and the aggregate report still works when you need it.
Note: Not a WhatConverts user yet? Start your free 14-day trial of WhatConverts today or book a demo with a product expert to see how we help prove and grow your ROI.
The Aggregate Looks Fine, but the Locations Don't
Here's the trap with multi-location reporting: the account-level view rewards the highest-volume locations with the lowest costs, and buries the locations that are actually earning the most.
Take a regional HVAC brand running Google campaigns for four locations. The winners look like the locations with the most leads at the lowest cost:
| Location | Leads | Cost per Lead |
| Phoenix (HQ) | 180 | $40 |
| Tucson | 60 | $95 |
| Mesa | 110 | $55 |
| Tempe | 70 | $88 |
Phoenix looks like the powerhouse and Tucson looks like it can’t pull its own weight. But that’s because you can’t see each location’s actual revenue tied to its campaigns:
| Location | Leads | Cost per Lead | Revenue Earned | Return |
| Phoenix | 180 | $40 | $24,000 | 3.3x |
| Tucson | 60 | $95 | $90,000 | 15.8x |
| Mesa | 110 | $55 | $31,000 | 5.1x |
| Tempe | 70 | $88 | $40,000 | 6.5x |
Turns out Tuscon returns nearly five times what Phoenix does for every dollar spent.
But if you can only see account-level campaign data, you’d keep throwing budget behind Phoenix's “efficient” (read: cheap) leads and starve the location that’s actually driving business.
Why Misattributed Locations Cost You
When four locations collapse into one account total, every budget decision is made on the wrong numbers.
- High-value locations look weak. A location pulling fewer, pricier leads that close into big jobs reads as a failure on cost per lead. You pause the campaign that funds the business.
- Cheap-lead locations look strong. The location flooding the account with low-cost, low-value leads gets rewarded with budget it didn't earn.
- Client trust erodes. When the regional manager says Tucson booked its biggest jobs all month and your report calls Tucson the worst performer, you look like you don't know their business.
- Optimization runs on the wrong metric. Smart Bidding chases whatever you reward. Feed it blended volume goals and it doubles down on the cheapest leads, not the most valuable ones.
The leads are real. The spend is real. What's broken is judging four different markets by one blended number.
The Fix: Filter and Report by Location
WhatConverts captures every call, form, and chat with its source, campaign, keyword, and location, then lets you assign each lead a quote and sales value. For multi-location clients, that turns a blended average into four clear pictures.
That makes two views possible from the same data:
- Per-location reporting. Filter by any single location to see its real leads, revenue earned, and which campaigns drove the value. Tucson's performance stands on its own, separate from Phoenix.
- True aggregate when you want it. Roll all four locations back up for the portfolio view, knowing the rollup reflects value and not just volume.
- Campaign performance by location. See that one location's campaign produces $200 repairs while another's produces $9,000 replacements, then fund each market on what it actually returns.
- White-label reports per location. Hand each regional manager a report about their location alone, with numbers that match what they see on the ground.
You stop reporting a blur and start reporting four real businesses that happen to share one account.
Proof: How Digilatics Kept the Numbers Straight
The agency Digilatics never let a multi-location client's data turn into a blur. They tracked every call and form back to its source, keyword, landing page, and location campaign, then reported each location on its own terms.
That clean per-location view did real work. Because Digilatics could see performance by location, the client adjusted ad spend per market based on each location's job capacity, funding the locations that could handle the work instead of guessing from an account-level total.
The results:
- 90% drop in cost per conversion
- 22% business growth
- Crossed $1M in monthly recurring revenue for the first time
The takeaway: when attribution stays attached to the location, the per-location decisions get sharper and the aggregate still adds up.
Seeing Multi-Location Data Correctly
Multi-location clients don't need more reports. They need reports that don't bury which location actually drove the value. Here's the path:
- Give every location its own campaign and tracking number so leads and spend stay tied to the right market.
- Filter performance by location to see real leads, revenue earned, and the campaigns behind them.
- Roll up to aggregate for the portfolio view, built on value instead of a blended average.
- Reallocate budget by market, funding the locations earning the most per dollar, not the ones generating the cheapest leads.
- Report per location so every regional manager sees numbers that match their reality.
When each location is measured on its own value, the account stops being a blur and starts being four businesses you can actually steer.
Ready to see your multi-location client's numbers correctly for the first time?
Start your free 14-day trial of WhatConverts today or book a demo with a product expert to see how we help prove and grow your ROI.
Get a FREE presentation of WhatConverts
One of our marketing experts will give you a full presentation of how WhatConverts can help you grow your business.
Schedule a Demo
Grow your business with WhatConverts


