


You’re looking at your ad dashboard, and your numbers are up. That’s all well and good, the question remains: is your advertising actually making you any money? You might be successfully driving clicks and traffic, but if that traffic isn’t turning into more revenue than you spent on the ads that drove them, you’re bleeding cash.
This is where ROAS, or Return on Ad Spend, comes into play. ROAS measures how much revenue you generate for every dollar spent on advertising. While some experts suggest that 4:1 is “good,” the reality is that optimal ROAS varies dramatically by industry and advertising platform.
Not only that, but many marketers struggle to calculate accurate ROAS because they have no way to accurately track exact revenue back to the marketing that drove it—especially from trickier conversions like phone calls and offline interactions.
What Is a Good ROAS? The Short Answer
While conventional wisdom suggests 4:1 ROAS is “good,” current data shows that most industries come in well below this threshold. A good ROAS typically ranges from 2:1 to 4:1 (200%-400%), meaning you generate $2-4 in revenue for every $1 spent on advertising.
The reality is that there is no universal “good” ROAS. What matters is whether your ROAS exceeds your break-even point and supports your business goals. In order to ensure this, you must be able to accurately calculate your advertising revenue and your ROAS.
How to Accurately Calculate ROAS (Return on Ad Spend)
ROAS, or Return on Ad Spend, is the amount of revenue you generate for every dollar spent on advertising. The calculation is simple:
ROAS = Revenue Generated ÷ Ad Spend
For example, let’s say a campaign with an advertising budget of $1,000 generates $4,000 in revenue. Since it generated four times the amount it cost, its ROAS would be 4:1 (or you could say you’re getting a 400% return on ad spend).
The tricky part is determining the figures that are used in the ROAS calculation. While ad spend is easy to see, advertising revenue generated is harder to discern. How can you determine how much of your total revenue is attributable to advertising as opposed to outbound sales, word of mouth, or other types of marketing?
Read More: How to Track the Digital Customer Journey – Did You Know
How to Properly Attribute Every Dollar of Ad Revenue
To calculate your true ROAS, you need a tool that tracks all conversions and ties them to the actual leads that performed them. That way, when a lead ultimately becomes a paying customer, you can credit that revenue to the exact marketing they interacted with throughout their lead journey.
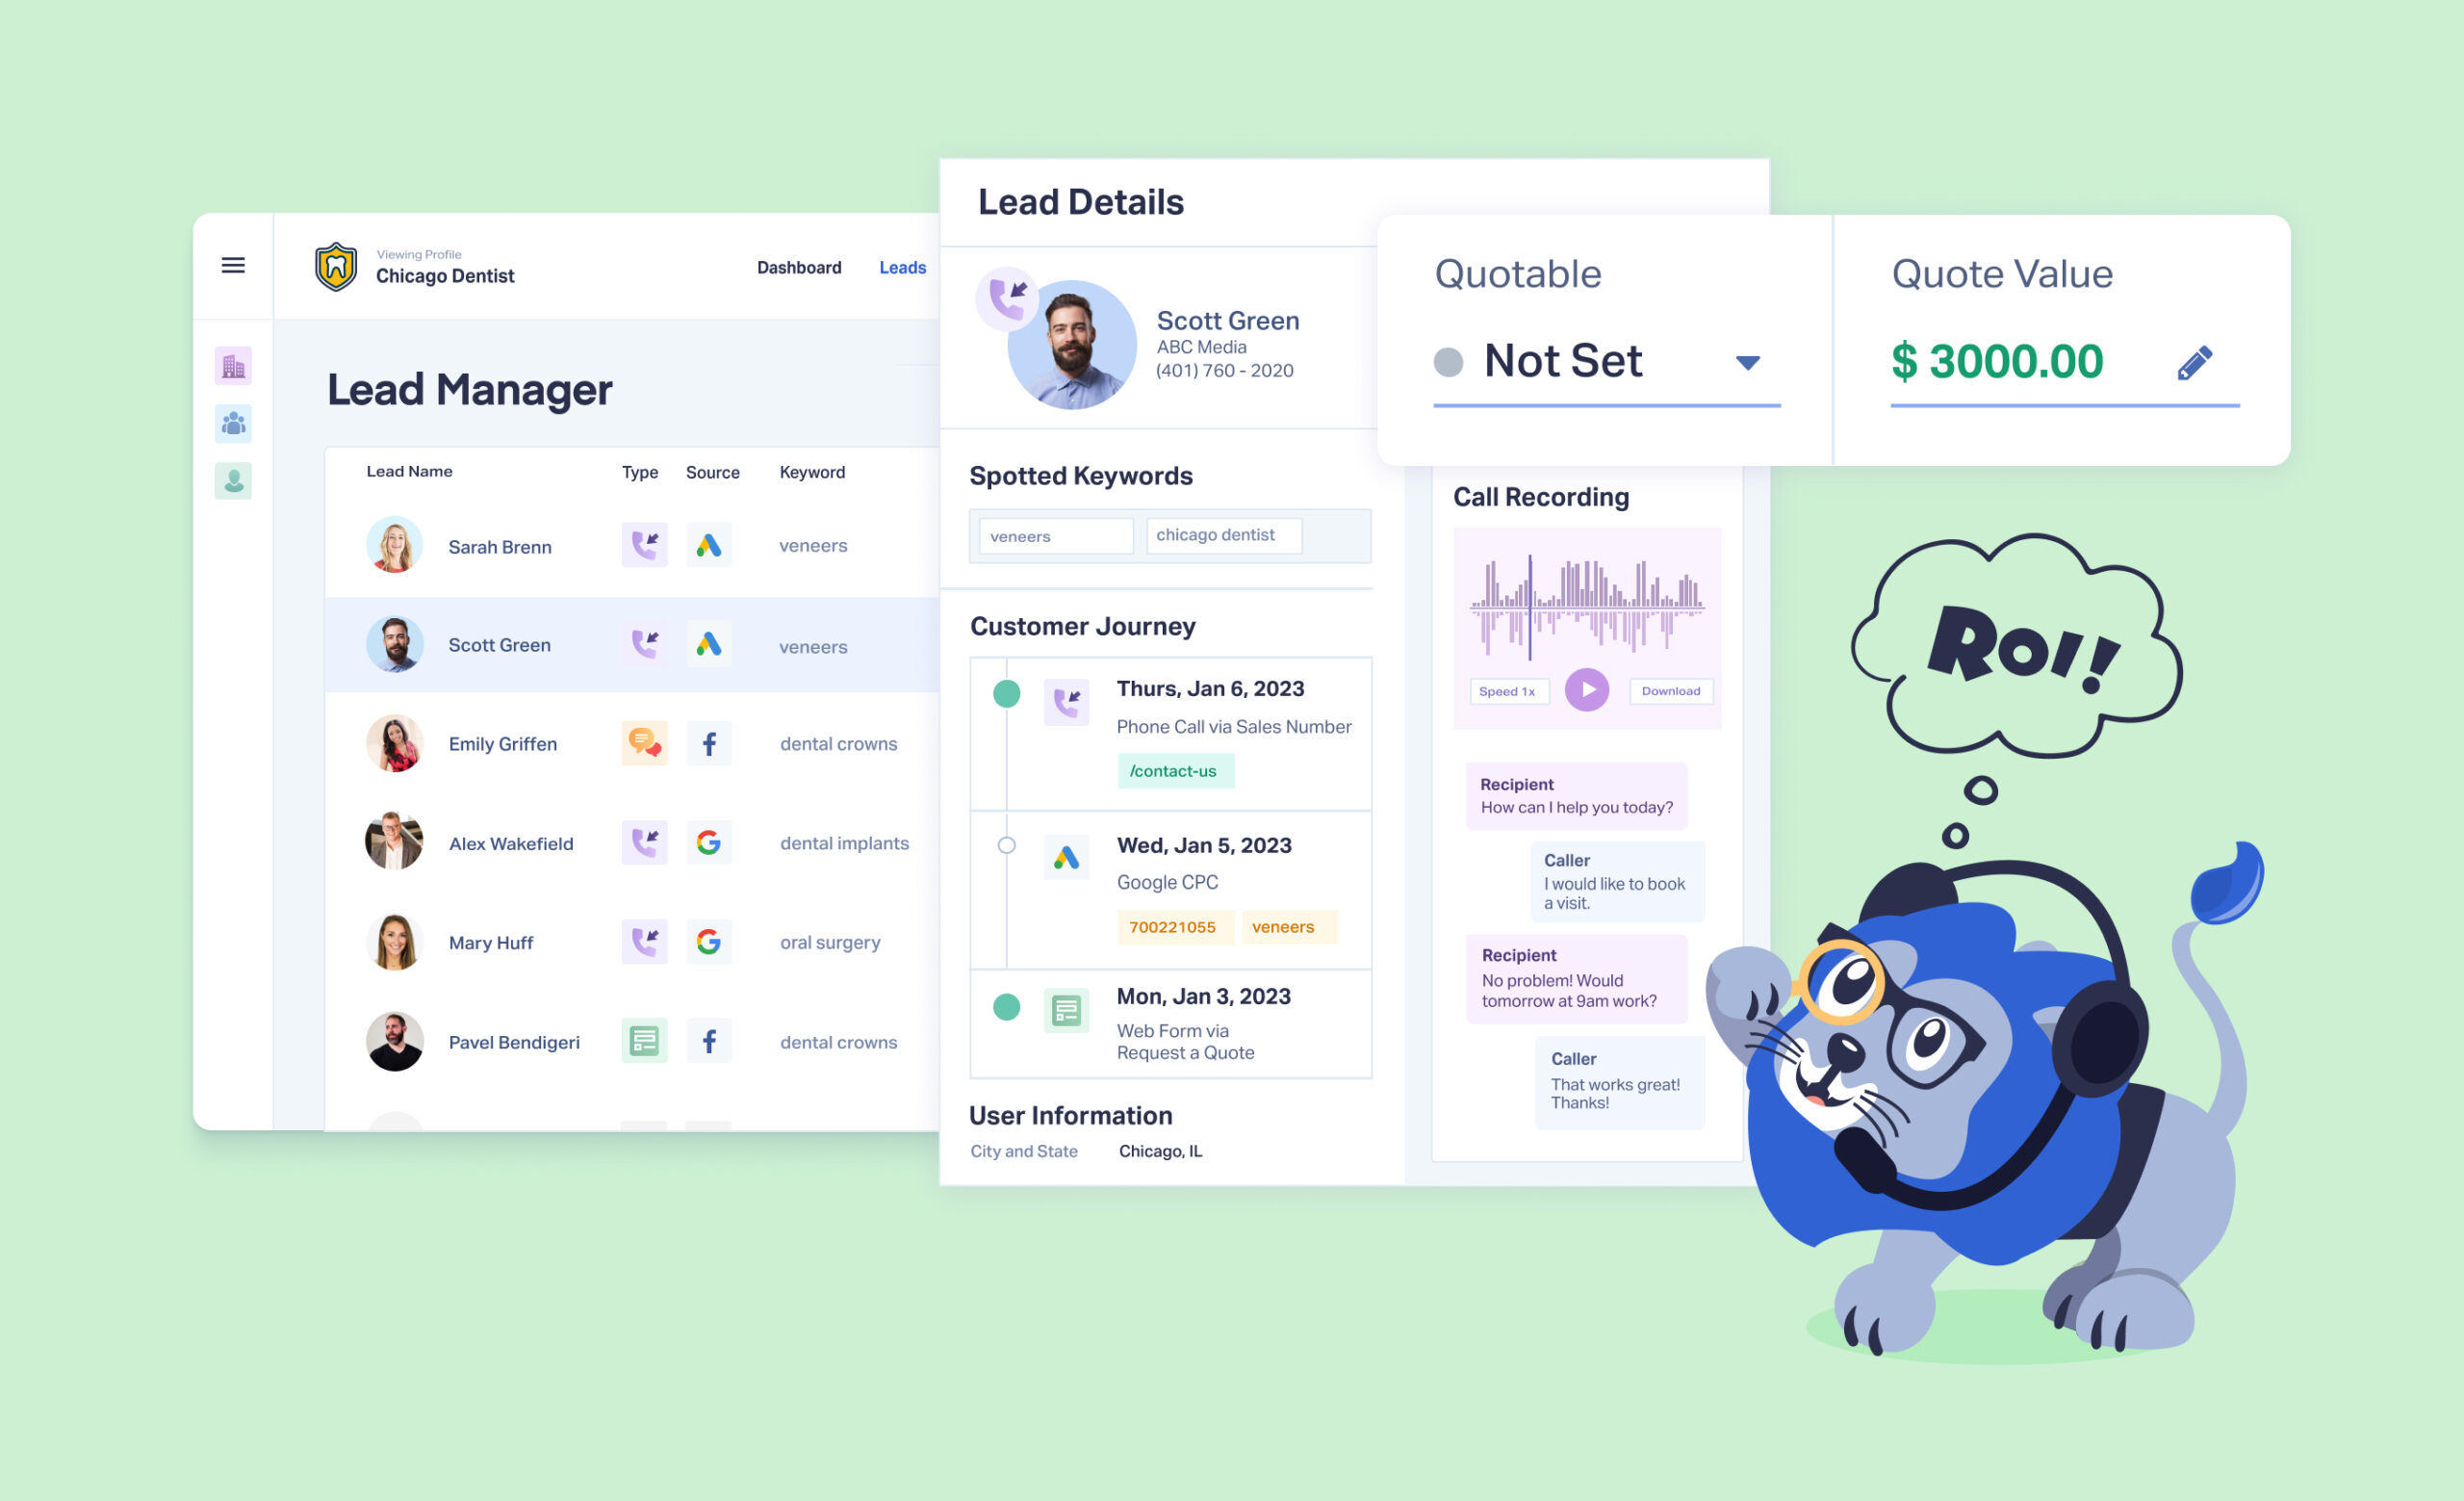
WhatConverts uses a first-party tracking script to attribute all of a prospect’s conversions and brand interactions and save them to a single lead profile. With your attribution data tracked on a lead-by-lead basis, you can input sales values for leads that make purchases and then generate reports that measure the exact revenue tied to specific ads, campaigns, and keywords.
In other words, WhatConverts allows you to calculate not just overall ROAS, but the ROAS down to the individual campaign, keyword, and ad.
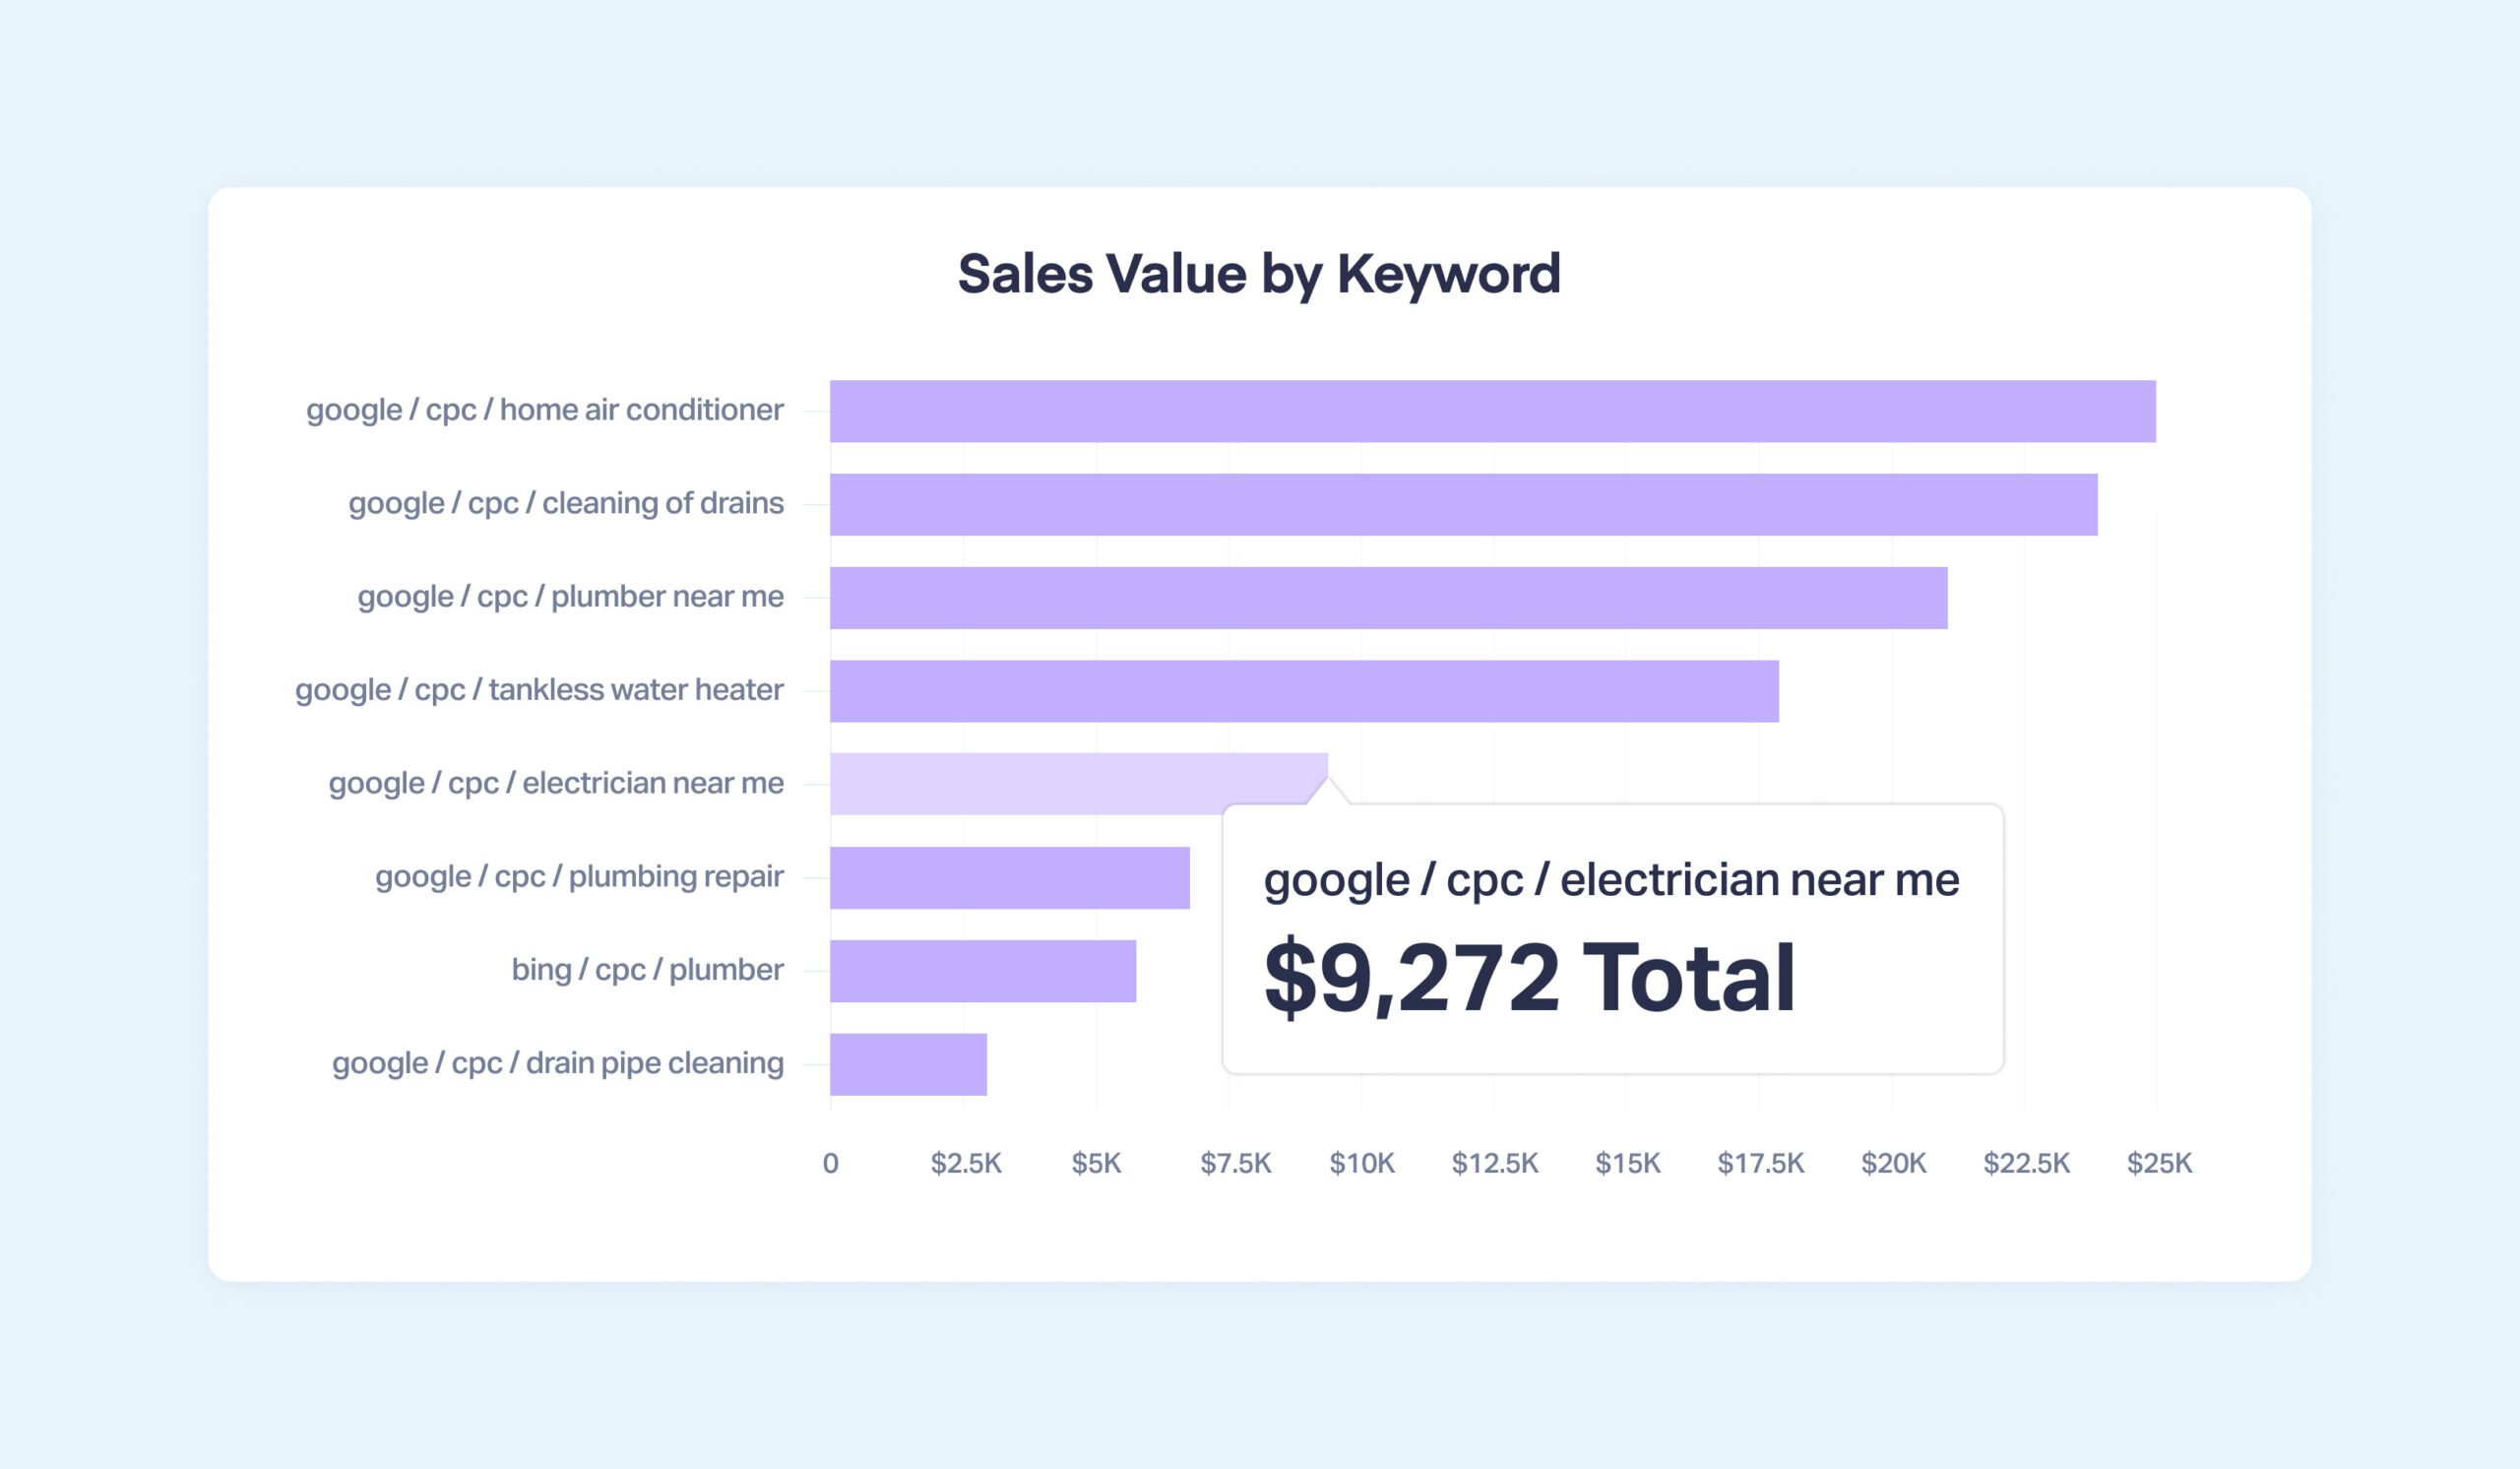
With campaign- and keyword-level revenue calculations, you can determine accurate ROAS for each of your campaigns individually and make smart decisions about where to allocate your advertising budget.
Average ROAS Statistics by Industry
Considering how tricky it can be to get accurate ROAS data for a single business, it should come as no surprise that there are many conflicting reports when it comes to determining a single average ROAS across channels and industries. We’ve compiled data from analytics company Varos (updated April 2025) to provide ROAS benchmarks across sectors.
| Industry | Google Ads ROAS | Facebook Ads ROAS |
| Median Overall | 3.31 | 2.19 |
| Automotive Parts | 5.44 | 6.76 |
| B2B SaaS | 1.29 | 1.6 |
| B2C SaaS | 1.17 | 1.32 |
| Baby Care | 6.09 | 2.49 |
| Banking Solutions | .09 | 1.92 |
| Beauty | 3.07 | 1.57 |
| Consulting Services | 2.05 | 1.88 |
| Delivery Services | 3.3 | 4.13 |
| Ed Tech | 1.71 | 1.34 |
| Education | 2.58 | 1.54 |
| Financial Services | .24 | .57 |
| Food & Beverage | 3.2 | 1.69 |
| Furniture | 3.87 | 4.67 |
| Healthcare | 2.09 | 1.19 |
| Healthcare Products | 2.52 | 1.19 |
| Home Appliances | 4.53 | 4.24 |
| Home Improvement | 4.07 | 3.94 |
| Hotels | 15.19 | 4.83 |
| Insurance Services | 3.22 | 4.24 |
| Kitchenware | 4.81 | 3.28 |
| Marketing & Advertising Agencies | 1.51 | 3.16 |
| Medical Services | 1.3 | 1.28 |
| Mental Health Services | .82 | 1.46 |
| Nutrition Services | 3.7 | .38 |
| Personal Care | 3.05 | 1.48 |
| Pet Care | 2.55 | 1.69 |
| SEO Services | 2.89 | 4.6 |
| Software Development Services | .04 | 1.4 |
| Subscriptions | 3.26 | 1.6 |
| Telehealth | .97 | .15 |
| Textiles | 2.91 | 2.9 |
| Travel Services | 7.71 | 3.52 |
| Wellness | 2.58 | 1.45 |
How to Improve Your ROAS
If your numbers aren't hitting industry benchmarks, try these proven strategies:
1. Track Every Lead
You can’t get an accurate ROAS with incomplete data. Make sure you’re tracking all lead types, including:
- Phone calls
- Form submissions
- Web chats
- Email inquiries
- Appointment bookings
- Online transactions
- Click events
More importantly, make sure you’re tracking leads across channels. For example, let’s say you spend $200 on a Google Ads campaign and it generates five form submissions, each of which turns into a $100 sale. By dividing your total revenue ($500) by your ad spend ($200), you can determine that your ROAS for that campaign is 2.5. That’s a solid return on ad spend.
What you don’t realize is that those same Google Ads also generated another 10 leads, each worth $100, but since they chose to call your business instead of filling out a form after they clicked on your ad, you didn’t attribute those leads and sales to your ad campaign. Your actual ROAS is three times what you thought it was ($1,500/$200 = 7.5)—and you’re now missing an opportunity to increase your ad spend and bring in a lot more revenue.
2. Run Ads that Drive Phone Call Conversions
Once you start tracking every type of conversion action across the lead journey, you might discover that phone calls are delivering your most valuable leads. It makes sense—leads who are ready to place a call are much closer to making a purchase than those who are just browsing or curious. They tend to spend more money as well: according to Forrester, 60% of marketers say that call leads convert 30% faster and spend 28% more on average.
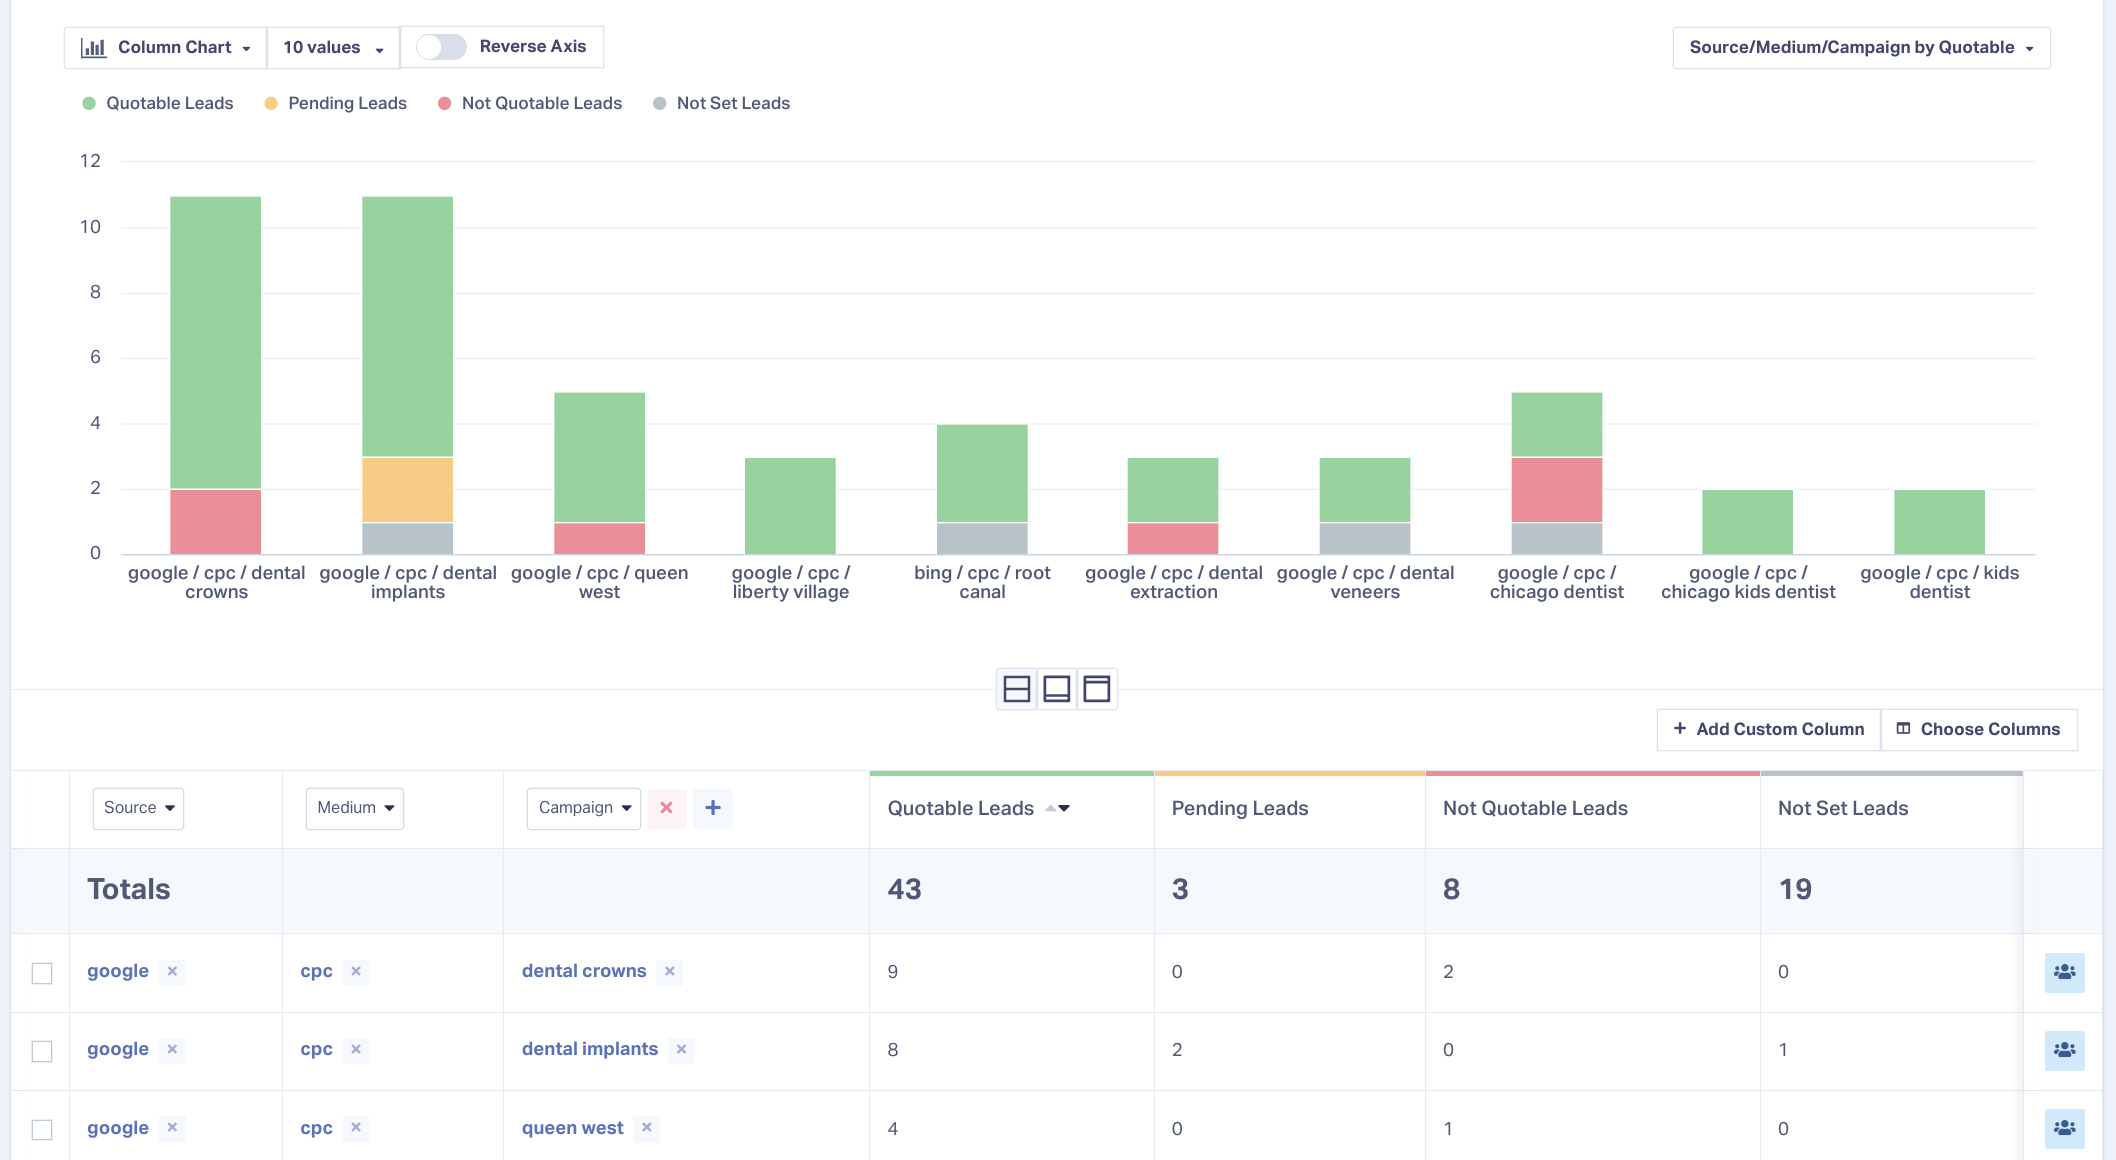
Once you’re gathering individual lead data, there’s truly no limit to the number of ways you can use that information to gain quantifiable insights into your ad spend. Start by looking at your sales value by lead type to verify whether or not phone calls are indeed more profitable for your business than other lead types. If so, you can look at your ad campaigns by quotable leads, filter your data to isolate call leads, and start increasing ad spend on the campaigns that are bringing in the most calls from qualified callers.
3. Test Different Landing Pages to Increase Conversions
Sometimes an ad gets a high click-through rate but doesn’t produce many leads. When this happens, it’s for one of two reasons; you’re not targeting the right customers, or your landing page needs improvement.
People who click on an ad and land on a webpage expect the page to deliver on the promise of the ad. This is known as “landing page message match.” If your landing page doesn’t match the message of your ad, people get thrown off and often fail to convert. This is one reason your ads may fail to produce a high ROAS.
Once you’re collecting data on the sales value of your leads, you can run A/B tests on your landing pages and measure the results in terms of actual revenue, rather than just traffic volume.
From ROAS Tracking to Revenue Growth
While industry benchmarks are helpful, they shouldn't be your only measure of success. The "right" ROAS depends not just on your industry and marketing channel, but also on your specific business model, goals, and growth stage. Instead of fixating on hitting a certain number, focus on:
- Tracking all your conversion types accurately
- Understanding which leads actually turn into sales
- Testing and optimizing based on real data
- Considering your full customer acquisition cost
By taking this more nuanced approach, you'll be better equipped to judge whether your ROAS is truly good for your business.
Ready to get better insight into your marketing ROI?
Start your free 14-day trial of WhatConverts today or book a demo with a product expert to see how we help prove and grow your ROI.
Get a FREE presentation of WhatConverts
One of our marketing experts will give you a full presentation of how WhatConverts can help you grow your business.
Schedule a Demo
Grow your business with WhatConverts


