Do more with your lead data
Want to know what days of the week drive the most business? This is the report to use. Grouping all the leads on the day of the week they were received allows you to see what days of the week drive the most business.
Try different date ranges to see if this changes over the long term or over times of the year. Another nice feature is seeing the different lead types all in one clear and simple chart.
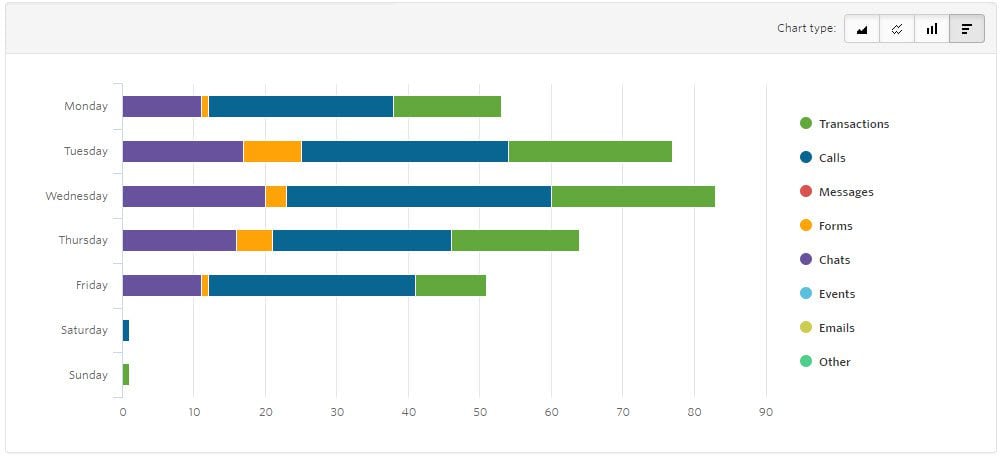
Leads by Day
This report charts the total leads received, grouped by the day of week and conversion type. We have used this chart sample to display the rich data from a website that uses chat, forms, calls and transactions to convert visitors into customers.
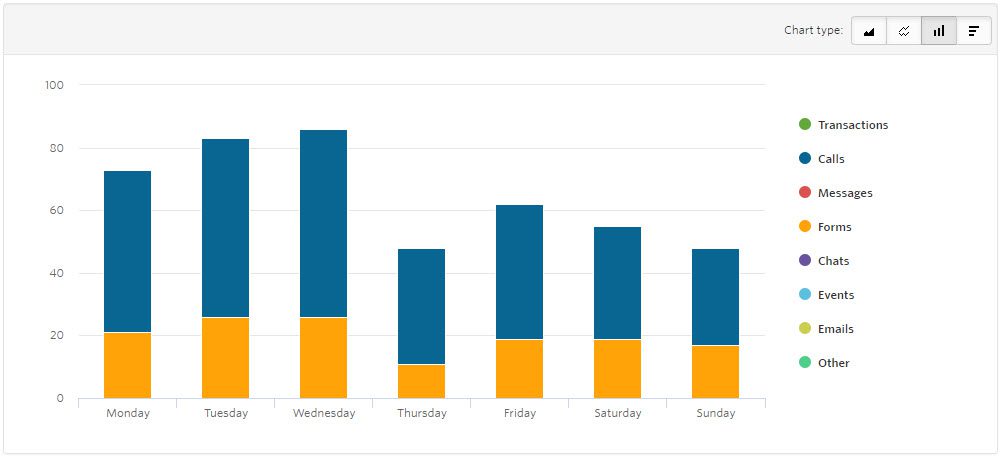
Data can be displayed using different chart types, below shows the data using vertical bars. In this chart we are only capturing calls and form leads.
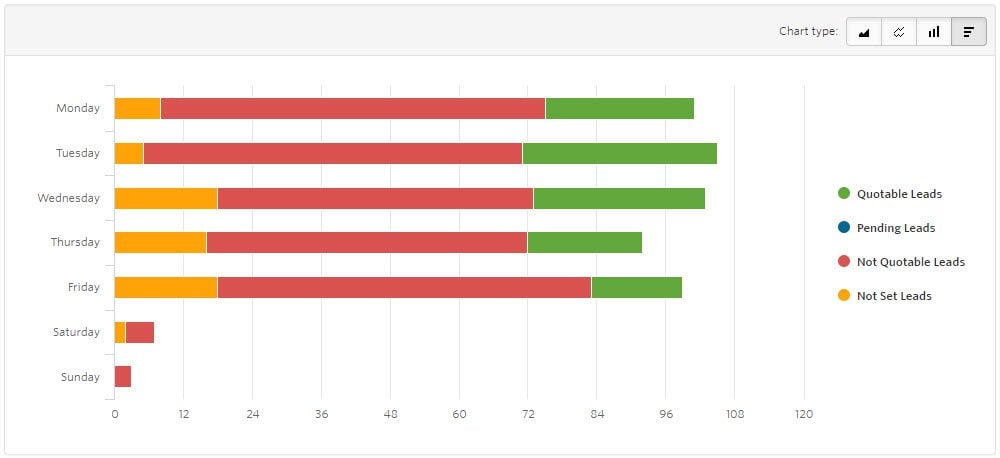
Quotable Leads by Day
Leads can be marked as quotable or not quotable, allowing you to see quotable leads in all our reporting.
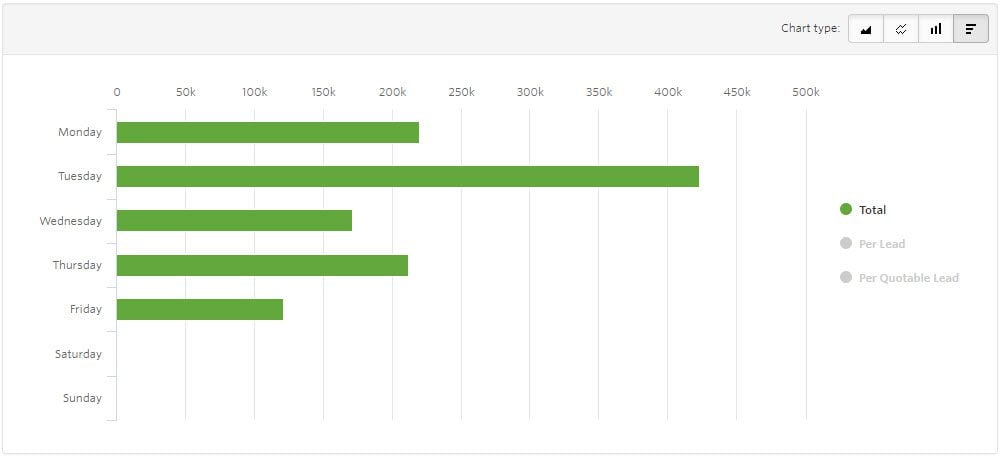
Quoted Value by Day
Quote value can be easily added to leads, allowing you to see total quoted value per dimension (day of week).
Get the tools you need to see what marketing converts, whether people call, chat or fill out a form. WhatConverts can track every touch-point back to the marketing responsible, giving you the complete marketing picture.
Don't miss a beat with your lead tracking. Get WhatConverts today with a 14 Day Free Trial and start knowing what marketing works.
Get a FREE presentation of WhatConverts
One of our marketing experts will give you a full presentation of how WhatConverts can help you grow your business.
Schedule a Demo


