

The switch from Google Universal Analytics to Google Analytics 4 isn’t a small update; it’s a complete platform overhaul that fundamentally changes how Google tracks website activity. So what is Google Analytics 4, and why should you care? We provide the answers below.
This post will discuss the main differences between the old Universal Analytics and the new Analytics 4. We’ll also reveal the blind spots that Google has with its analytics platforms, especially when it comes to identifying individual leads.
There is a solution to this missing lead information. WhatConverts helps agencies that are tired of relying on Google's metrics. Watch the video to see why one agency owner moved away from Google's metrics.
Once you understand the differences between UA and GA4, click the link below to see how WhatConverts can help you get more out of Google’s new platform.
Pairing Google Analytics with WhatConverts gives you better data to improve marketing efforts.
Schedule a demo of to see how WhatConverts can enhance Google Analytics.
The Old System: Universal Analytics
Universal Analytics (UA) provided the following general information:
- How did you acquire users?
- When did users visit your site?
- How many users came to visit?
- How long did users stay?
- Which pages did users view?
UA lacked true engagement metrics. If you wanted to see engagement, you had to rely on imperfect metrics like Bounce Rate, Session Duration and Pages per Session.
Bounce rate vs. other engagement metrics
Bounce Rate could only answer a few vague questions as an engagement metric. Did the user arrive on a page and bounce — showing zero engagement — or did they arrive then view a few pages before bouncing — showing some engagement?
Unfortunately, Bounce Rate was one of the best engagement metrics offered in the old Universal Analytics. A high bounce rate indicated that people weren’t engaging with your site. A low is an indicator that people might be engaging with your site..
The problem is that Bounce Rate is just an indicator metric; it tells you what might have been happening about engagement. The new Google Analytics 4 shows the actual engagement actions on your site.
Although Google still can’t tie specific leads to specific engagements, you can track general engagement through Google Analytics and then use WhatConverts to see the exact leads engaging with your site.
The New System: Google Analytics 4 - Acquisition
The old UA Acquisition section showed traffic sources and medium, how many users you acquired, and what percentage of traffic came from each marketing source.
Acquisition is still there in Google Analytics 4, but the accompanying “Behavior” section is gone. This is where you would find the important “Site Content” section, where you could view the most viewed pages and analyze your best landing pages.
“Conversions” — this section has been removed, and we now see “Conversions” can now be found under “Events.”
In GA4, Acquisition is separated into two categories; User Acquisition and Traffic Acquisition. This distinction is important because one user can have multiple sessions. User acquisition is based on user engagement, while traffic acquisition is based on session engagement.
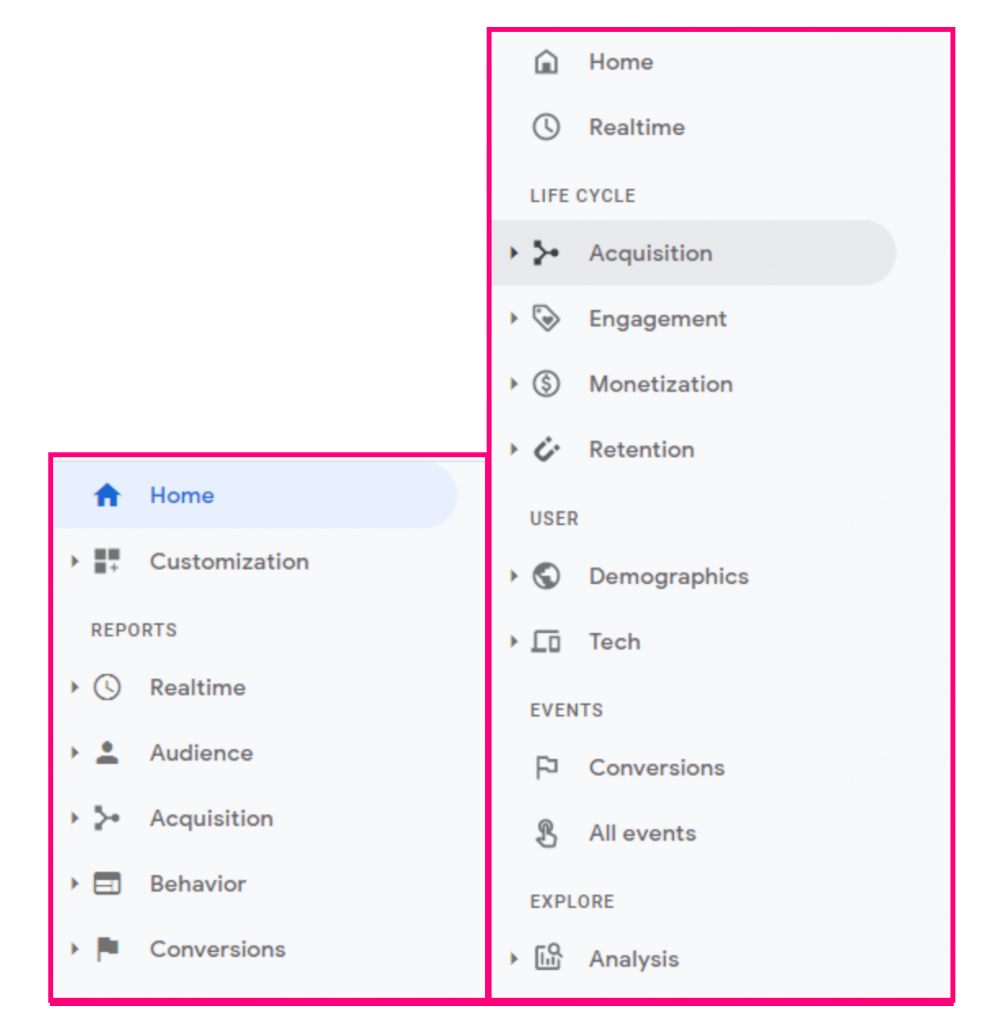
On the left, you can see the old Universal Analytics navigation. On the right, you can see the new Google Analytics 4 navigation.
The New System: Google Analytics 4 - Behavior and Events
The new GA4 Acquisition view shows the number of sessions, the number of users, and the behavior of each user and session. This Behavior section has changed dramatically from Universal Analytics to GA 4.
In the old Google Universal Analytics, the Behavior section showed engagement through the following metrics:
- Bounce Rate
- Page Views per Session
- Average Session Duration
- Conversions
- Conversion Rate
These were the only indicators UA offered regarding how users were engaging with your site. The new GA4 Behavior metrics show actual engagement actions, including:
- Click
- File Download
- Scroll
- Search Results Viewed
- Form-Fill
- Chat
- ...and more
This is a big improvement; Google now measures engagement based on actions and automatically tracks these actions without requiring any setup.
However, one big problem remains.
Neither Google Universal Analytics nor the new GA 4 allows you to see specific leads. Connecting WhatConverts to Google Analytics 4 allows you to tie specific actions to specific leads and then identify your qualified, high value leads.
Google tells you that an action happened to result in a lead, but you don’t know the value of the lead, what they wanted if they were targeted, and what they were worth.
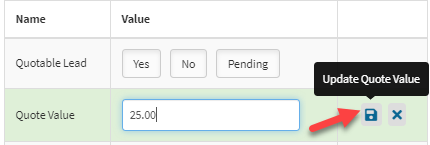
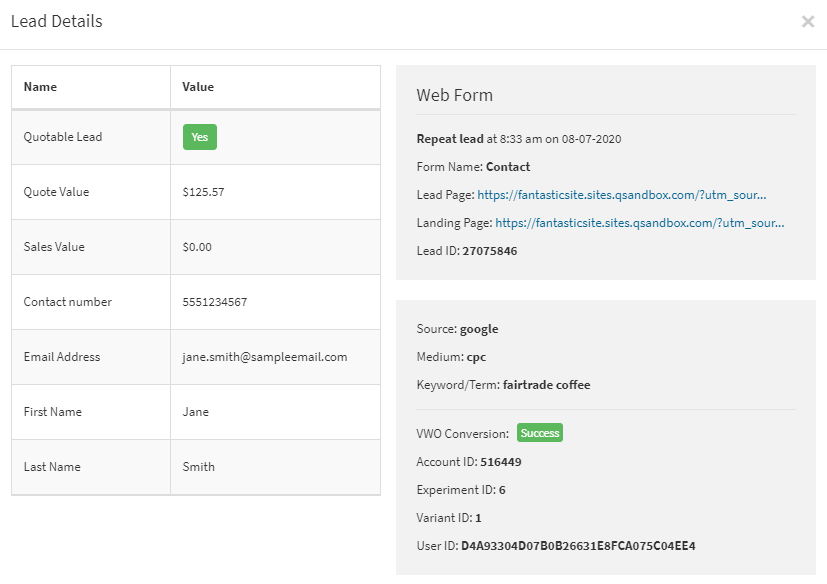
Even if you use the Acquisition page to see where conversions are coming from, you don’t know if they’re qualified. GA4 lets you see every type of engagement but doesn’t tie engagements to specific leads. A simple integration with WhatConverts will connect engagements to actual leads and allow you to qualify and value your leads, as seen below:
Google is shifting the focus from Sessions to Events
UA was very focused on user sessions:
- When did users bounce off your site during a session?
- How many pages did they view per session?
Session-based metrics measure activity, but the activity is mostly based on page views and clicks. Now, Google is focused on engaged action rather than passive pageviews, tracking how people click around, go to new pages, scroll, and generally engage with your site.
Session Duration is one example of a metric from the old UA Behavior section, but it doesn’t always tell the full story.
For example, if someone quickly finds the information, they’re looking for on your site and converts right away, that will show up as a short Session Duration. However, that short Session Duration led to a conversion.
With Universal Analytics, marketers used Bounce Rate and Session Duration to determine how many quality visitors they were getting on their site. Now, they can assess their site using more granular engagement metrics based on specific actions.
Instead of focusing on Session Duration, GA4 now shows engagement actions on each page and screen. Google has begun using “screens” to better include mobile traffic and engagement. This is another improvement over UA, which was very desktop-centric.
Google Analytics 4 also has a new section called, Engaged Sessions. This aligns with Google’s shift towards measuring engagement rather than just traffic.
The Engaged Sessions section is broken down into traffic sources, revealing whether one channel is driving engaged users or not. Google Analytics 4 also shows Average Engagement Time. This is the number of seconds that users are engaged; scrolling, clicking, using your site’s search function, etc.
If we had to pick one thing to applaud Google regarding GA4, it automatically tracks events.
Google Analytics 4 tracks Events automatically
The following events are automatically tracked in Google Analytics 4, except for phone calls, which can be tracked through the WhatConverts + Google Analytics integration.
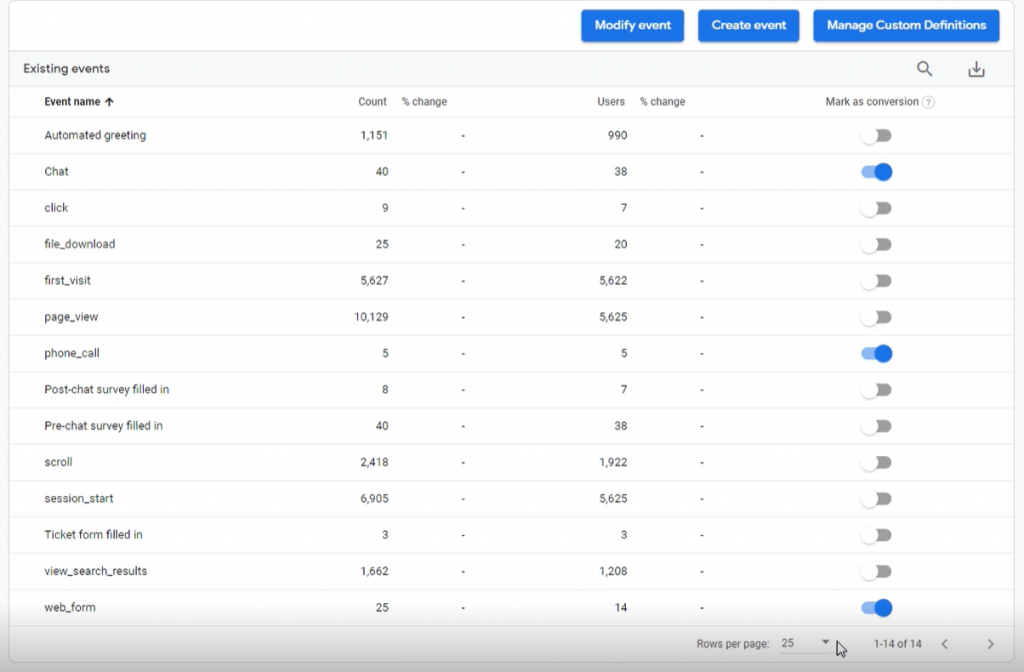
Google can automatically track these actions (except phone calls) as Events, but you have to go in and mark Events you want to be tracked as Conversions<.
For instance, “scrolling” is an Event that you wouldn’t want to mark as a Conversion. However, if a user fills out a form, that’s the type of Event you want to be tracked as a Conversion.
Marking events as conversions is a one-click process.
In the old Universal Analytics, tracking Events as Conversions was a five-step process that looked like this:
Go to Admin —> Goals —> New Goal —> Create a template —> Name it.
It appears Google recognized that this process was too complicated.
One note about tracking Events as Conversions: while the Events are automatically tracked, you won’t see Conversions in the data until you mark certain Events as Conversions. Once you do that, you can see Conversions in your reports and dashboard from that point forward. You will not have backlogged Conversion data, but you can still go back and view Events, such as a chat, from before they were marked as conversions.
What is Google Analytics 4 still missing, and how can WhatConverts help?
Here’s an example of an important business question that Google Analytics still can’t answer. Which marketing channels deliver your $1,000 leads, and which marketing channels deliver your $10,000 leads?
Google Analytics can’t provide this information for most businesses because it can’t show you the specific leads behind each conversion action.
A quick note: Google Analytics does provide better insights for e-commerce businesses than other businesses. E-Commerce businesses can see the sales value of leads through Google Analytics but still won’t know exactly who the specific leads are.
WhatConverts is a gamechanger for tracking Google Ads with Google Analytics
WhatConverts reveals the exact keyword your leads use to find your business through Google Ads. If this lead placed a call to your business, you can also listen to the phone call and tie it to the keyword. Here's an example of a report in WhatConverts showing which keywords led to conversions.
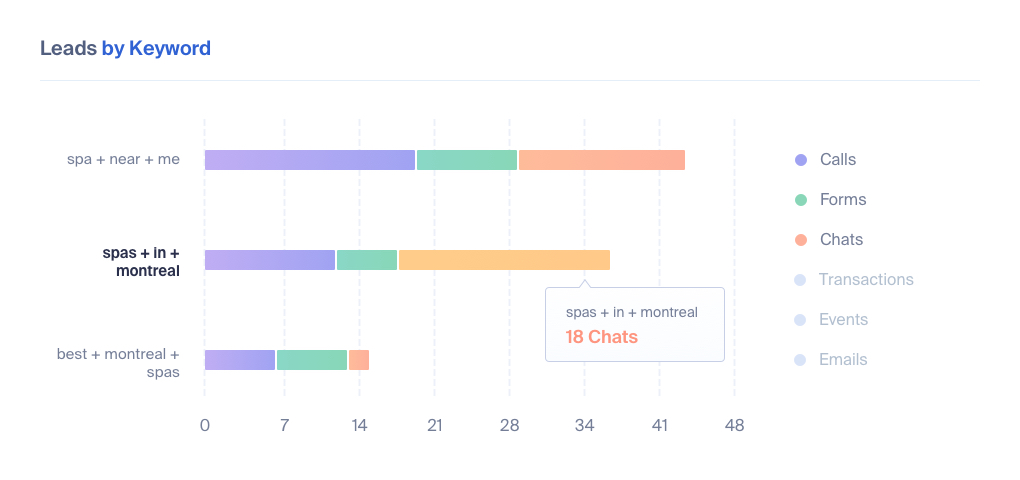
You can then click on these conversions to see the specific leads.
This detailed lead data can tell you that a specific keyword delivered a specific lead worth $X,000.
WhatConverts allows you to you can answer questions like,
“Can I spend $5 per click on this keyword?”
WhatConverts can show you that a specific keyword on Google Ads resulted in $24,000 in potential value.
If you’re paying $5 for ten clicks, you’ve spent $50. That $50 resulted in $24,000 in potential sales. Are you willing to spend $50 to get $24,000 in potential sales? Absolutely.
WhatConverts can help you identify your high-value and low-value keywords to know how much you need to spend to get ROI.
One more reason to use WhatConverts: Communicating with Non-Marketers
Google Analytics is not very user friendly, especially for those who aren’t familiar with terms like, “session duration” and “bounce rate.”. Non-marketers don’t know what to do with this information.
Google Analytics makes sense to serious marketers who use it, but it’s an advanced tool. Your client or CEO will not understand what they’re looking at if you walk them through Google Analytics data.
GA does have its place in the marketing ecosystem. It’s free and provides you with useful information about the activities happening on your site, but what does that mean for your real-world strategies? How can you use the GA data to boost revenue and improve marketing efficiency?
Pairing Google Analytics with WhatConverts ensures that your data has a bigger impact on your marketing efforts.
Schedule a demo of WhatConverts to see how our platform can enhance Google Analytics.
Get a FREE presentation of WhatConverts
One of our marketing experts will give you a full presentation of how WhatConverts can help you grow your business.
Schedule a Demo
Grow your business with WhatConverts


