


 Alex Thompson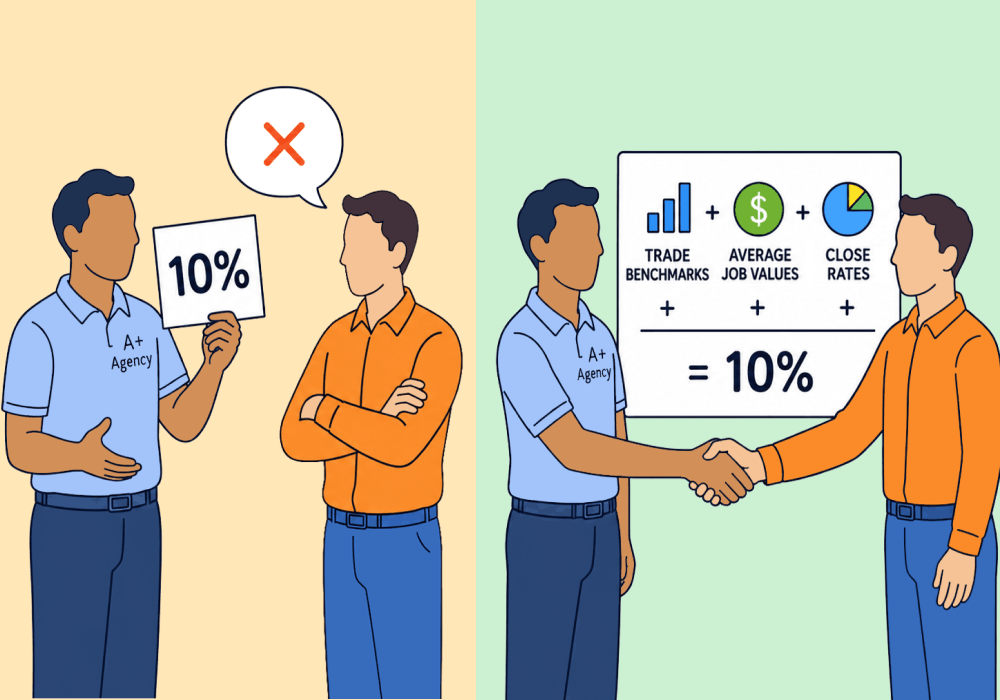
When your agency charges a share of the revenue its campaigns generate, the hardest question is often the simplest: What percentage should you charge?
There’s no single percentage that works for every client. A rate you can defend starts with three inputs: benchmarks for the client’s trade, the client’s actual close rate, and the value of a typical job. Together, they show what each lead is likely to produce and give you a business reason for the rate you recommend.
Without that method, writing a proposal turns into guesswork. You consider 8%, 12%, or 15%, but none of those numbers has a clear connection to the client’s business. Charge too much and the client may think you’re taking advantage. Charge too little and the account may not be profitable. Either way, you won’t have a good answer when they ask, “Why that number?”
Here’s what should shape a revenue-share rate, why a larger opportunity may support a lower percentage, and how to give the client a recommendation they can verify.
The Hard Part Isn’t Choosing a Rate. It’s Explaining It.
Broad pricing guidance doesn’t solve the problem. Advice on how agencies structure their pricing may suggest charging 5-25% of revenue or 10-30% of projected value. Those ranges show what’s common, but they don’t tell you which rate fits a particular client.
Choosing a number from a common range still leaves the client’s main question unanswered. “It’s within industry norms” explains where you found the number, not why it fits their account. A rate you can defend has to connect to the client’s economics.
Going back to hourly billing creates a different problem. It’s one reason task-based pricing can cap what an agency earns. In one consulting example, a professional with twelve years of experience completes the same work in one-third of the time and bills $4,000 less than someone with two years of experience (ConsultFees). The more efficient consultant creates the same result but earns less for it.
Source: ConsultFees.
Revenue-share pricing avoids that trap by tying the fee to the value produced. But it only works if the percentage comes from a method the client can understand and check.
Other Industries Use Rules and Benchmarks to Set Percentage Fees
Percentage-based pricing isn’t unique to marketing. M&A advisors, franchises, federal energy contractors, and healthcare organizations all use percentage fees or shared savings. They make those numbers easier to defend in one of two ways: a schedule sets the rate, or a measurement process calculates the result.
Model 1: A Schedule Sets the Rate
Sources: Auxo Capital Advisors (Lehman schedule); FranchiseVS (representative tiered royalty).
In M&A, the “Lehman schedule” charges 5% on the first $1M of deal value, 4% on the second, 3% on the third, 2% on the fourth, and 1% above $4M. Apply that same schedule and you get a 4.0% blended rate on a $3M deal and a 2.0% rate on a $10M deal. The deal value determines the rate; the advisor doesn’t pick it case by case (Auxo Capital Advisors).
Franchise royalties follow the same basic logic. Across 137 brands, quick-service restaurants average about 5.2%, while education franchises average 8.5%. The difference reflects the economics of each category, including transaction volume and value. Once a brand sets its rate, it’s “almost never negotiable,” and some tiered structures lower the percentage as revenue grows (FranchiseVS).
Model 2: A Measured Baseline Determines the Payment
U.S. federal Energy Savings Performance Contracts use a measurement process instead of a rate table. Contractors are paid from savings measured against a baseline built with the customer’s own utility data. Four verification steps occur before payment is set (U.S. Department of Energy). The payment follows from the agreed method rather than a number proposed by either side.
Hospital gainsharing programs also compare results with an established baseline. Physicians earn a share of cost reductions measured against a benchmark built from the hospital’s own data. A federal study found that this model reduced costs by 8.5% over three years (Becker's Hospital Review, citing AHRQ/CMS).
The takeaway isn’t that agencies should copy one of these fee structures. It’s that a percentage becomes easier to defend when an agreed rule or measurement process produces it. Pick an agency rate from a broad range and you’re skipping that step.
The Client’s Economics Determine the Rate
Schedules and benchmarks work because they respond to the economics of the deal. And one pattern keeps showing up: as the value of a transaction grows, the percentage often falls. A lower rate doesn’t necessarily mean a lower fee because that percentage applies to a larger amount.
You can see the same pattern in real estate. Redfin’s Q3 2025 data puts buyer-agent commissions at 2.52% on homes under $500,000 and 2.22% on homes over $1M (Offerpad, citing Redfin). A Federal Reserve study found that rising home prices since the mid-1990s explain more than half of the nationwide decline in commission rates. The M&A example below shows why: a smaller share of a larger amount can still produce a higher fee.
Two M&A deals under the Lehman schedule.
| Blended rate | Fee paid | ||
| $3M deal | 4.0% | $120,000 | |
| $10M deal | 2.0% | $200,000 |
Source: Auxo Capital Advisors (Lehman schedule).
Size isn’t the only factor. Risk and complexity can push a rate in the other direction. Recruiting fees run 10-15% for entry-level roles and 25-30% for executive hires. Retained searches range from 20-40%, compared with 15-30% for contingency searches, because the recruiter takes on more commitment and search risk (RecruitersLineup).
Consulting formulas can also account for how much of an outcome the work actually caused: Fee = (Quantified Outcome x Attribution %) x Rate (ConsultFees). For an agency, the client’s close rate serves a related purpose. It connects the leads generated by marketing with the revenue those leads are likely to produce.
For a home-services agency, those three inputs have distinct jobs:
- The trade benchmark provides a reference range for close rates and job values in the client’s category
- The client’s close rate shows how many of the leads you generate become paid work
- The client’s typical job value shows how much revenue an average closed lead produces
Let’s say you’re pricing an HVAC account. Trade data says service calls commonly run $300-$400, while the client’s own records show that 45% of qualified leads become paid work. Compare the benchmark with the client’s actual close rate and job value, and you’ll get a more reliable estimate of the revenue each lead can produce.
You have to evaluate those inputs together. A client with more revenue potential may support a lower percentage because a smaller share still produces a sustainable fee. A smaller or less predictable opportunity may need a different rate. That’s the point of the process: reflect the economics of the account instead of applying one percentage to every client.
A Rate Feels Fair When the Client Can See Where It Came From
Clients don’t just evaluate the size of a rate. They also evaluate the reason behind it. A percentage tied to their business data is easier to understand than one chosen from a generic range.
Research supports that distinction. A study of 437 business buyers found that willingness to accept a share-of-results agreement was driven by perceptions of fairness, not only by risk, even when two agreements produced the same payout (ScienceDirect). The explanation for the number affects how the number is received.
Research on perceptions of fair prices helps explain why. Buyers enter a negotiation with a reference price based on what they’ve seen before. They’re more likely to accept a change tied to a real business factor, such as a changing benchmark or higher cost, than one that appears to exploit their lack of alternatives.
Charging more for a snow shovel immediately after a blizzard is the familiar example. The product and seller are unchanged; only the buyer’s urgency is different. That reason makes the higher price feel exploitative.
Real estate gives us an industry-scale example of why transparency matters. After the 2024 NAR settlement, agents were required to state “the amount or rate of compensation... or how this amount will be determined.” Clients don’t need every rate to be identical, but they do need to understand how you set it.
That’s the practical takeaway: show the client the trade benchmark, their close rate, and their typical job value. A rate tied to those inputs is easier to defend because the client can follow the reasoning.
Home Services Is Too Broad for One Benchmark Rate
“Home services” includes businesses with very different sales patterns and job values. One benchmark rate can’t accurately price HVAC, plumbing, roofing, and landscaping accounts.
The table below shows both the range and the limits of the available benchmark data. Pay attention to the missing values. When reliable category data isn’t available, the client’s own lead and sales data matters even more.
For example, HVAC businesses book roughly 40-50% of inbound calls. Ticket values range from about $200 for a service call to $600-$700 when a technician also presents an upgrade opportunity. Booking performance also varies with company size (BaaDigi, citing ACCA/BLS).
| Illustrative comparison compiled from several industry and software sources, not one authoritative survey. Missing values indicate where reliable benchmark data was not available. | ||
| Trade | Close / booking rate | Typical job value |
| HVACBaaDigi, citing ACCA/BLS | 40-50% of calls booked (mid-40s average) | $200 service call, up to $600-$700 with an upgrade pitch |
| PlumbingJobber 2026 survey | 45%+ of shops close 70%+ of quotes | Not confirmed to one source Data gap |
| RoofingAllied Emergency Services; RoofLink/HomeAdvisor | 20-40% on sat appointments Weak source | $5,000-$10,000 shingle replacement |
| LandscapingJobber, citing Angi | No benchmark found Data gap | About $300/month recurring spend, not a single job |
| Close rates range from the low 20s to more than 70%, while job values range from about $200 to more than $10,000. A generic home-services rate cannot reflect that spread. | ||
Plumbing businesses report higher close rates. In Jobber’s 2026 survey, more than 45% of plumbing companies said they close at least 70% of their quotes, the highest pricing confidence of any trade surveyed (Jobber).
Roofing data is less consistent. One contractor reports a 20-40% close rate on completed appointments, while a typical shingle replacement ranges from $5,000-$10,000 (Allied Emergency Services; RoofLink, citing HomeAdvisor).
Landscaping has the largest data gap. The sources reviewed did not provide a reliable close-rate benchmark. The available spending figure—roughly $300 per homeowner each month—measures recurring spending rather than the value of one job (Angi via Jobber).
That spread rules out a universal “home services” rate. Benchmarks give you useful context, but the recommendation still has to use the individual client’s performance and job economics.
Let’s picture one agency serving two clients: an HVAC company that books about 45% of leads at $300 per job and a roofing company that closes 30% at $8,000 per job. The agency can use the same pricing model for both, but the rates should reflect the very different revenue potential of each account. These are illustrative examples, not named customers.
Turn the Three Inputs into One Defensible Rate
So what does that look like in practice? Start with a trade benchmark, then adjust the recommendation using the client’s actual close rate and typical job value. The challenge is applying that method consistently across every account.
A forecast-and-audit process standardizes the calculation. It reads the three inputs, estimates the account’s revenue potential, and recommends a rate. That means you’re not presenting a percentage on its own. You’re presenting the inputs and reasoning behind it.
Here’s the most important part of that calculation: close rate multiplied by average job value gives you the expected revenue per lead. The trade benchmark helps you check whether those client-specific numbers are reasonable.
Close rate multiplied by average job value.
Illustrative figures for the two example clients in this article, not named customers.
The tool below applies the same method. Pick the client’s trade, enter the best available close rate and job value, and see which rate those inputs support.
If you’d rather build the recommendation yourself, here’s the process:
- Find the benchmark range for the client’s trade
- Calculate the client’s close rate from lead and sales data, or estimate it from booking patterns if necessary
- Calculate the client’s typical job value
- Use a documented calculation or forecast-and-audit process to turn the three inputs into a recommended rate
A standard process gives you consistency as well as speed. You evaluate every client with the same method, but the recommendation still reflects that client’s data.
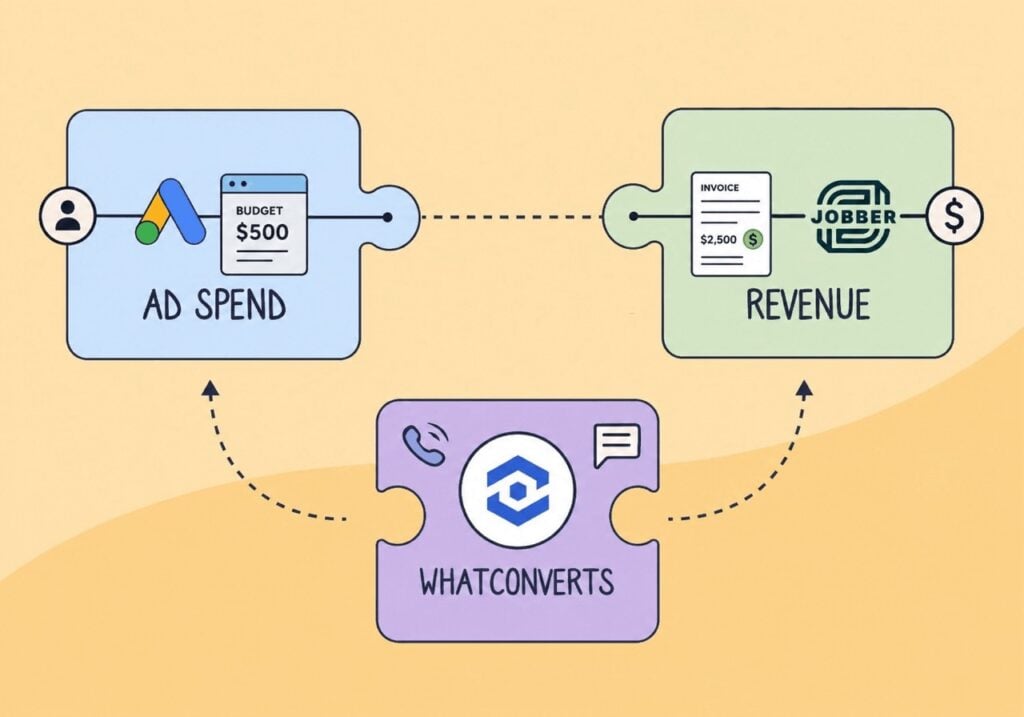
The recommendation gets more reliable when you attach a real dollar value to each lead and track which ones close. You’re replacing estimates with observed results. WhatConverts Forecast and Audit uses those three inputs to recommend a revenue-share rate you can explain and the client can verify.
Feature Highlight: Value Leads Software
A Percentage Has Meaning Only in Context
Once you’ve calculated a rate, the client may still ask whether it’s high or low. The percentage alone can’t answer that question. You also need to know what value it applies to and what factors determine it. The table below adds context from other fields that use outcome-based or percentage fees.
| Field | Typical range | What moves it |
| Recruiting | 15-40%of first-year salary | Role seniority and search risk |
| Consulting | 10-20%of attributed value | Engagement risk and complexity |
| Insurance | 3-20%of premium (55-120% first-year on life) | Product and risk type |
| Franchising | 2-12%of revenue (about 6% average) | Category volume vs brand value |
| M&A advisory | 2-4%blended on mid-size deals | Deal size (eases as it rises) |
| Real estate | 2.2-2.9%per side | Home price (eases as it rises) |
| Percentage fees are common across many industries, but the ranges are not interchangeable because they apply to different types of value. The right agency rate still depends on the client’s trade benchmark, close rate, and job value. | ||
Is 10% High or Low?
It depends on the value being shared. Consulting fees may run 10-20% of value created (ConsultFees), franchise royalties average about 6% of revenue (FranchiseVS), and M&A fees blend to 2-4% on mid-size deals (Auxo Capital Advisors). Recruiting fees run 15-40% of first-year salary (RecruitersLineup), while insurance commissions run 3-20% of premium (Mira Health). These examples show that percentage fees are familiar. They don’t show that 10% is automatically right. The client’s economics still have to support it.
Do Bigger Clients Pay a Higher Rate?
Not necessarily. In real estate and M&A, the percentage often falls as deal value rises because a smaller share of a larger amount can still produce a higher fee (Offerpad, citing Redfin). But deal size is only one input. The full recommendation still depends on the account’s economics.
Do I Need to Become a Pricing Expert?
No. You need a consistent method and reliable inputs. A forecast-and-audit process can handle the calculation. Your job is to verify the inputs and explain how they support the recommendation.
Choose the Rate You Can Explain
The goal isn’t to prove that 5%, 10%, or 15% is universally fair. It’s to identify the rate this client’s economics support. Start with the trade benchmark, then use the client’s close rate and typical job value to reflect the account’s actual revenue potential.
Use three steps:
- Find the trade benchmark for close rates and job values in the client’s category
- Calculate the client’s close rate and typical job value from lead and sales data, or use clearly labeled estimates when actual data is unavailable
- Run the three inputs through a consistent method and present the recommended rate together with the data behind it
Now you can present one rate and show how you reached it. The client may still negotiate, but you’re starting the conversation with evidence instead of a guess.
This article covers how to determine the rate. The companion article below explains why clients are more likely to trust a number that comes from a transparent process.
Get a FREE presentation of WhatConverts
One of our marketing experts will give you a full presentation of how WhatConverts can help you grow your business.
Schedule a DemoGrow your business with WhatConverts