


We're excited to announce two game-changing features that will revolutionize how you interact with your lead data: Quick Reports and Lead Grouping. These powerful new tools, available right from the Lead Manager, are designed to help you make faster, smarter decisions about your marketing strategies.
The Lead Manager: Your Marketing HQ
The Lead Manager is where all of your lead data comes together in one place, giving you a bird’s-eye view of your entire lead generation landscape. Calls or forms, paid or organic—no matter where your leads are coming from, they all end up here.
With the Lead Manager, you can:
- See exactly who your leads are (contact info, demographics, the works)
- Understand how they found you (which marketing channel brought them in)
- Qualify leads and assign values (so you know which ones are worth pursuing)
- Sort and filter leads any way you want (to spot trends and opportunities)
In other words, the Lead Manager helps you figure out what marketing is actually working. And with our latest update, accessing those detailed insights just got a whole lot easier.
Get Instant Insights with Quick Reports
The Quick Report is a one-click, easy-access mini-report that populates right in the Lead Manager, so you can get your insights when and where you need them most.
Until now, users who wanted to view reports on specific data dimensions would use the Report Library to pull a templated report or to build a custom report of their own. And while the Report Library remains an essential resource for more detailed reporting, Quick Reports introduces an easy and efficient way to grab quick insights without ever leaving the Lead Manager.
For example, if you wanted to quickly see a report on how many leads came in via CPC compared to organic, just two clicks pulls up this beautiful interactive report: 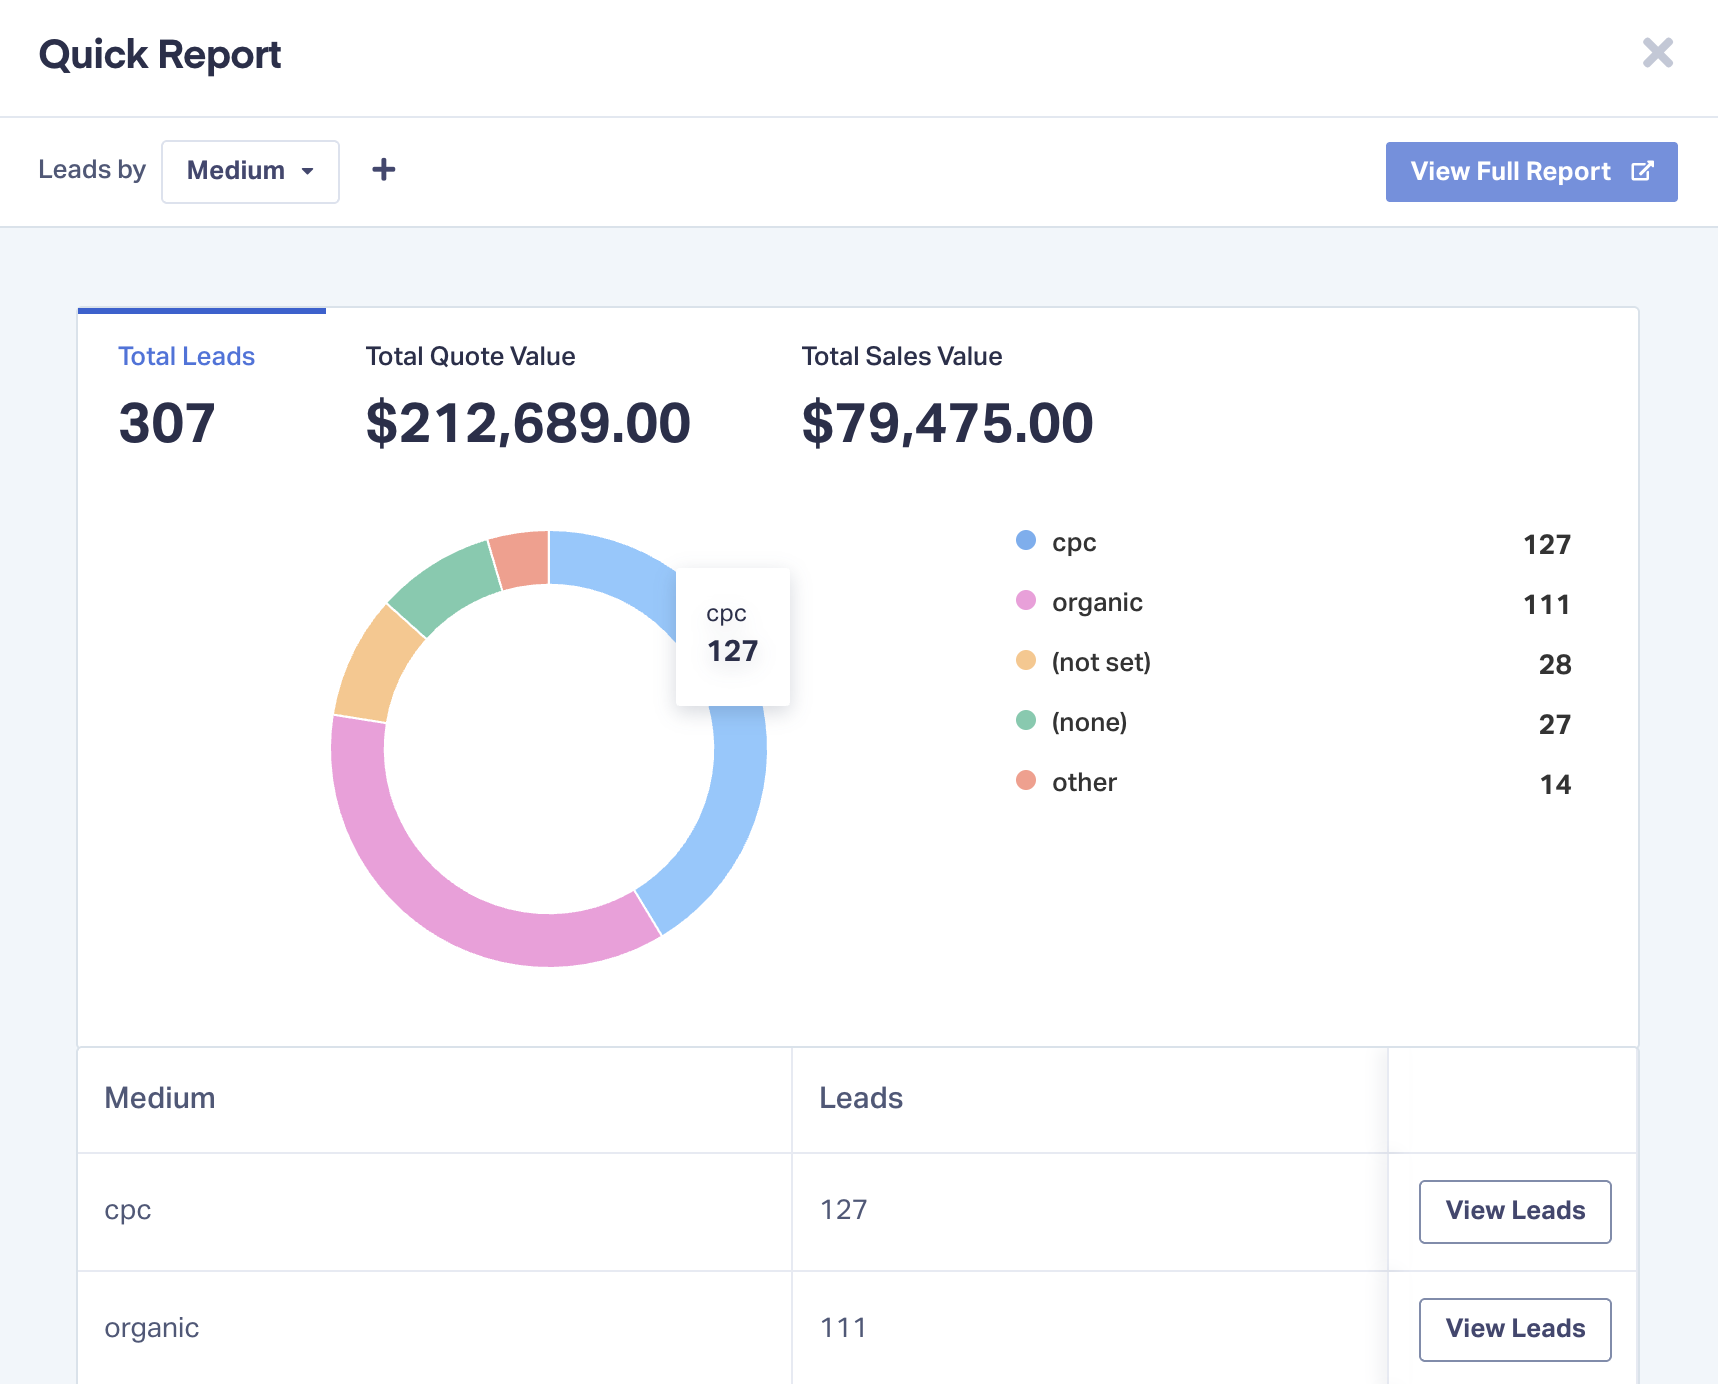
How to Use Quick Reports
When you’re in the Lead Manager, you’ll notice there’s now a dropdown arrow next to each of the category labels in your spreadsheet. If you click on one of these arrows, you’ll see a dropdown menu that includes the option to generate a Quick Report on the data in that column.
When you generate a Quick Report, you’ll get a summary overview of your leads by the data point in that column. For example, if you generate a Quick Report on the Campaign column, you’ll get a summary overview of all of your leads according to which of your marketing campaigns brought them in. 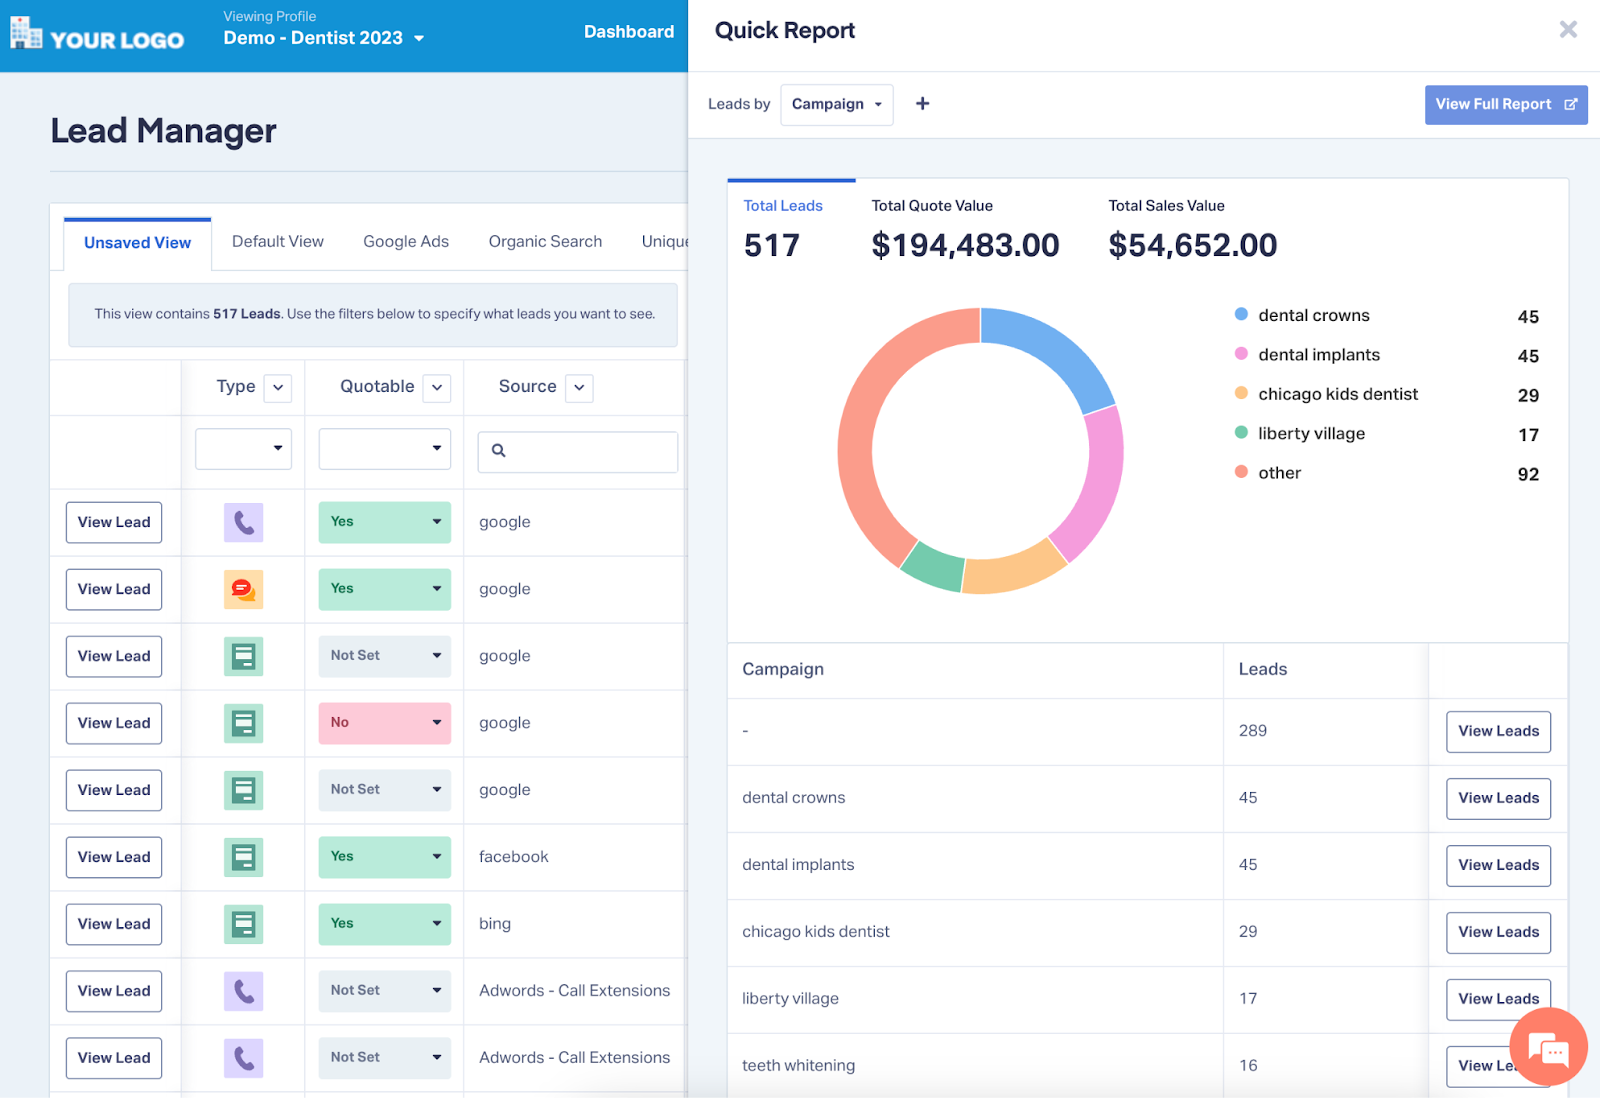
By clicking the labels at the top of the report, you can see each campaign’s lead generation data by lead count, quote value, or sales value. And with the View Leads button to the right of each campaign, you can quickly isolate all of the leads that were brought in by a particular campaign and evaluate them in the Lead Manager.
Adding a Second Report Dimension
You can also add one additional dimension to your quick report. If, for example, you want to know which of your campaigns brought in more quotable leads, you can add the Quotable dimension to produce an even more detailed Quick Report.
Quick Reports are designed to be a lite version of standard reports, so if you want to look at more than two dimensions (or add filters, exclude data, etc.), you’ll need to head to the Report Library. But for quick insights, Quick Reports is all you need.
For more on how to use Quick Reports, check out the help article below.
Organize Efficiently with Lead Grouping
In the same dropdown menu you used to generate Quick Reports, there’s another new option that reads “Group leads by [dimension]”. This powerful new function is called Lead Grouping, and it allows you to sort and organize your leads into collapsible groups based on any data dimension you choose. 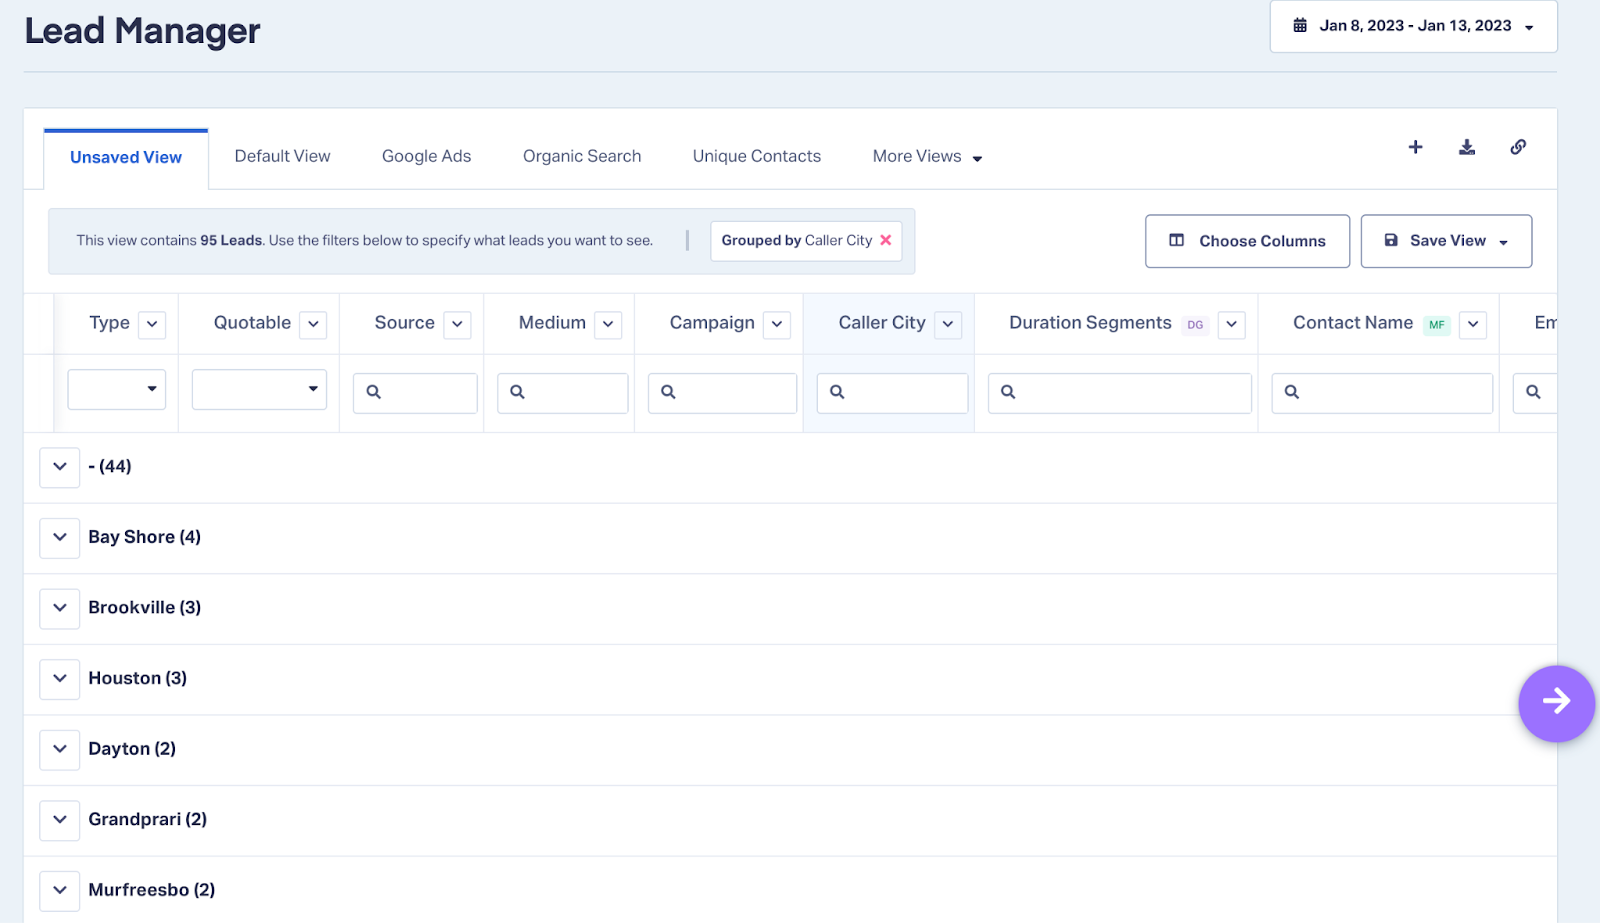
Let’s say you’re in the Lead Manager and you notice you’ve received a number of new leads since you logged in the day before. If you’re following the WhatConverts Six Step Roadmap (which you should be!), your next step is to evaluate these new leads and designate which of them are qualified potential customers.
Lead Grouping allows you to sort your leads into neat groups, so you can organize them by key qualifying characteristics instead of evaluating each lead one at a time. For example, if you’re a roofing service, one of your main qualification criteria will be whether or not leads live within your service area. With Lead Grouping, you can create neat collapsible groups by city and quickly eliminate unqualified leads.
How to Use Lead Grouping
In the Lead Manager, identify the dimension you want to use to group your leads. Navigate to the dropdown menu near the column header and click “Group leads by [dimension]”. 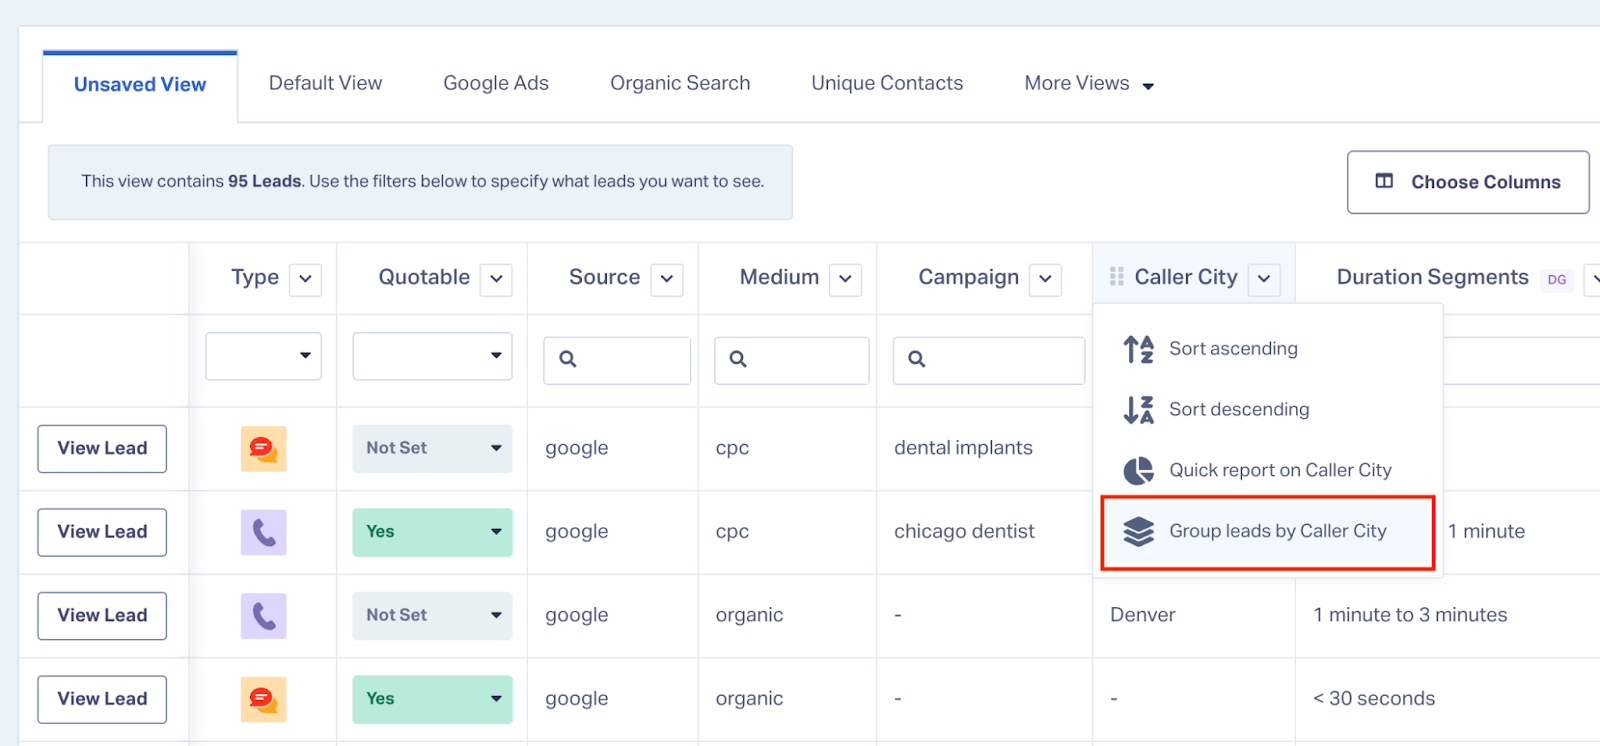
Your leads will instantly be sorted into neat collapsible groups according to the data point you chose. Using the dropdown arrows, you can quickly and easily jump between groups to explore the individual leads in each one.
For more on how to use Lead Grouping, check out the Help Center article below.
Other Usability Improvements
Beyond these two features, a variety of usability improvements to your Lead Manager, including:
- "View Lead" button makes it easier to find the Lead Details page
- Turned attribution, add leads, and other features into icons
- Cleaner interface
- Various other UX improvements
For more on what's changed, have a look for yourself by logging in and heading to the Lead Manager.
More Powerful Tools for Data Access & Evaluation
In our many conversations with WhatConverts power users, we’ve determined that the most successful users evaluate and qualify leads daily. With Quick Reports and Lead Grouping, you can access, sort, and evaluate your data more quickly and efficiently than ever before. And with the enhanced insights that come from enriched and organized data, you can make smarter decisions that directly impact your marketing ROI.
Ready to start exploring the new Lead Manager? Log in or sign up for a free 14-day trial.
Get a FREE presentation of WhatConverts
One of our marketing experts will give you a full presentation of how WhatConverts can help you grow your business.
Schedule a Demo
Grow your business with WhatConverts


