


Understand the Landing Pages Report
The Landing Pages Report helps you understand which website pages generate your most valuable leads, quotes, and sales. It connects your marketing performance to real business outcomes, showing which landing pages drive results and which need optimization.
Note: Learn how to access and navigate Standard Reports in Use Standard Reports and discover how to turn insights into action in Analyze Performance with Standard Reports.
Landing Page Performance Overview
This section highlights your top-performing landing pages across multiple metrics, helping you see which pages attract the most valuable leads and conversions.
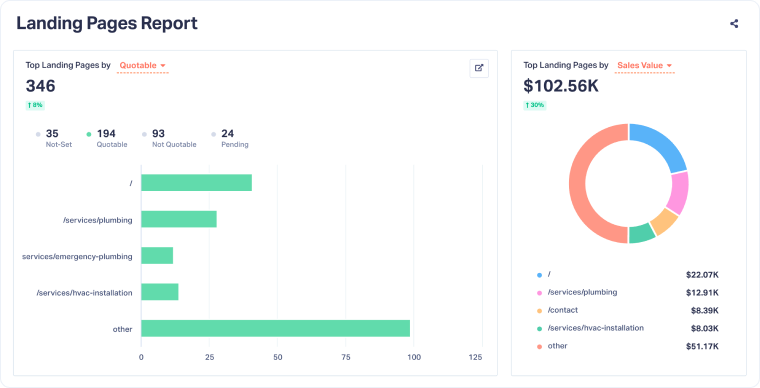
- Top Landing Pages by Lead Type: Shows how each page performs by conversion type (calls, forms, chats, appointments, and others). This helps you understand how visitors interact once they arrive on each page.
- Top Landing Pages by Quotable: Displays leads segmented by qualification status (Quotable, Not Quotable, and Pending), allowing you to identify which pages attract higher-quality leads and which may bring lower-intent traffic.
- Top Landing Pages by Quote Value: Reveals which pages generate the highest quote values, helping you link landing page performance directly to revenue potential.
- Top Landing Pages by Sales Value: Shows which pages lead to confirmed sales, letting you see which parts of your site actually close deals.
Use these metrics together to assess both lead quality and business impact. A page may have fewer leads but higher quote and sales value, indicating stronger ROI.
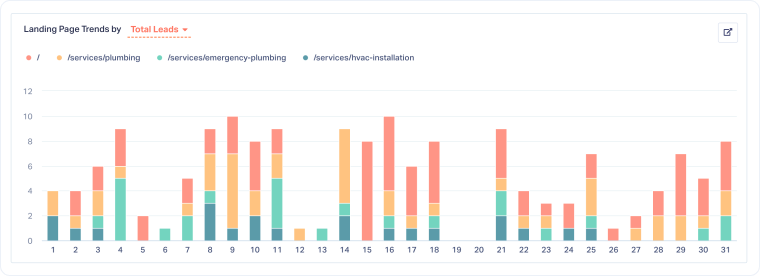
Landing Page Trends Over Time
The Landing Page Trends chart shows how performance evolves over time for your top pages. Each color represents a page, helping you visualize how different sections of your website perform week by week, month by month, or day by day.
You can switch between metrics to explore trends for:
- Total Leads: Track how many conversions each page generates over time.
- Quotable Leads: See which pages consistently attract high-quality inquiries.
- Quote Value and Sales Value: Identify when changes to the pages impact lead value or revenue.
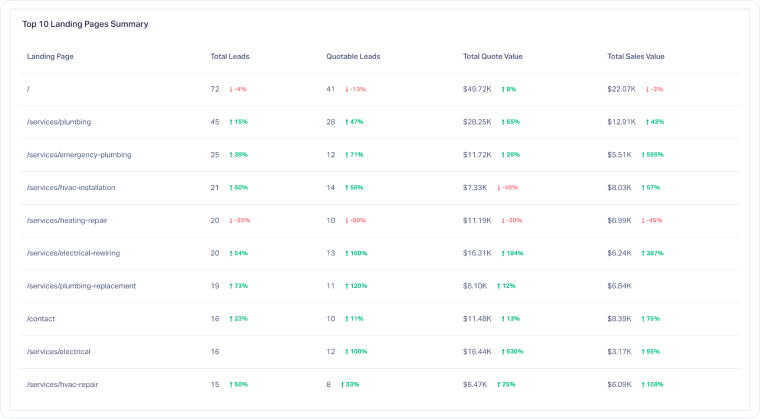
Top Landing Pages Summary Table
At the bottom of the report, the Top Landing Pages Summary Table provides a detailed performance view of your best pages.
For each landing page, you can see:
- Total Leads: The total number of conversions from that page.
- Quotable Leads: The number of leads qualified as valuable or sales-ready.
- Quote Value and Sales Value: Revenue metrics tied to leads from that page.
The percentage changes next to each metric compare the current period to the previous one, making it easy to spot improvement opportunities or declines.
Related Topics
Get a FREE presentation of WhatConverts
One of our marketing experts will give you a full presentation of how WhatConverts can help you grow your business.
Schedule a Demo


