


Filter Results in Your Custom Reports
You can filter results in the Report Builder to narrow down your data and focus on what matters most. Filters help you isolate campaigns, sources, or any other dimensions to analyze performance with precision.
Filter From the Sidebar
Use the sidebar to apply precise filters to your report.
To add or edit filters:
- Open your custom report in the Report Builder.
- In the sidebar, under “Do you want to filter results?”, click “+ Add Filter”.
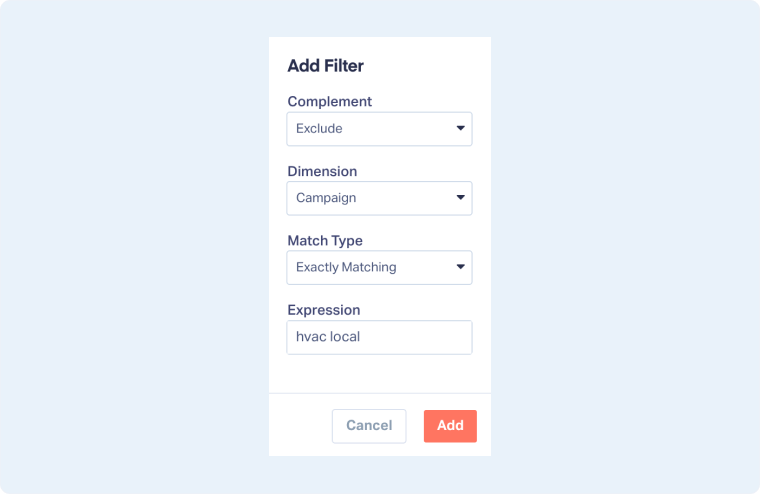
- Choose your filter settings:
- Complement: Include or Exclude.
- Dimension: The field you want to filter by (e.g., Source, Campaign, Service).
- Match Type: Select how the filter should match your data (e.g., Exactly Matching, Contains).
- Expression: Enter the text or value to match.
- Click “Add” to apply the filter.
Tip: You can add multiple filters to combine conditions and refine your results even further.
Filter From the Chart
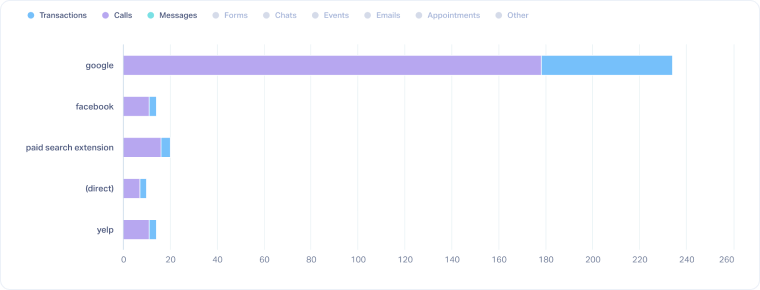
You can filter data visually by interacting directly with the chart.
To filter or exclude data from your chart:
- Click on the segment label to exclude those values from your report.
- The segment will be grayed out, and the chart will automatically refresh to display the filtered view.
Tip: Chart filtering is perfect for quickly isolating or removing specific campaigns, channels, or lead types without editing sidebar filters.
Filter from the Table
In the table view, you can include or exclude specific values directly.
To filter from the table:
- Select the rows you want to include in your report.
- Click the filter icon that shows once you select one or more rows.
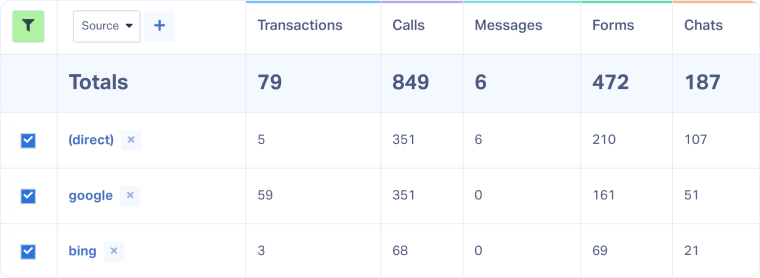
Tip: Click the “x” icon to exclude a specific value (for example, blank campaigns).
Tip: To filter by a single value, click the name in the table, the report will instantly refresh to display only that selection.
Related Topics
Get a FREE presentation of WhatConverts
One of our marketing experts will give you a full presentation of how WhatConverts can help you grow your business.
Schedule a Demo


