


Understand the Google Ads Report
The Google Ads Report helps you interpret how your Google Ads spend translates into leads, qualified opportunities, and revenue. It goes beyond traffic metrics and shows how spend, campaigns, clicks, leads, and outcomes connect, enabling you to make informed optimization decisions.
Note: Learn how to access and navigate Standard Reports in Use Standard Reports and discover how to turn insights into action in Analyze Performance with Standard Reports.
Performance Trends
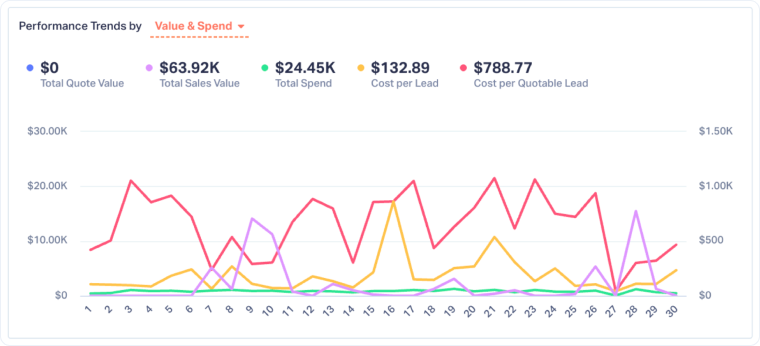
This section shows how Google Ads performance changes over time using interactive trend charts.
You can switch between different views to focus on what matters most:
- Value & Spend: Compare Total Spend, Quote Value, Sales Value, Cost per Lead, and Cost per Quotable Lead over time to understand efficiency and ROI trends.
- Conversions: Analyze how Impressions, Clicks, Leads, and Quotable Leads trend across the selected period.
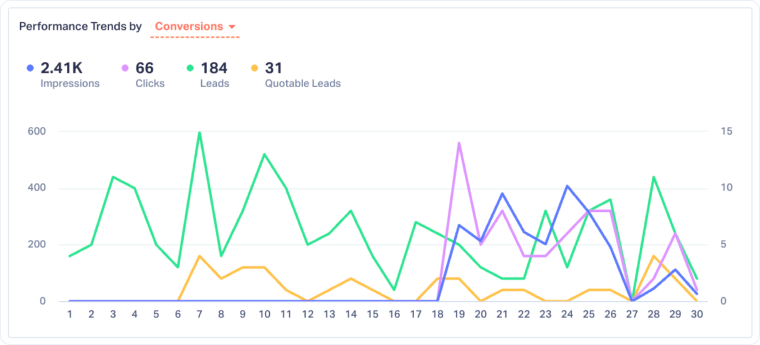
Use this section to spot performance shifts, identify days or periods that drove higher-quality leads, and understand how spend aligns with outcomes.
Four Key Metrics
This section provides a quick snapshot of Google Ads visibility and cost efficiency metrics. These metrics offer early context before leads are generated:
- Impression Share: The percentage of eligible searches where your ads appeared.
- Click-Through Rate (CTR): The percentage of impressions that resulted in a click.
- Cost Per Click (CPC): The average cost paid for each ad click.
- Cost per Mille (CPM): The cost to show your ads 1,000 times (impressions).
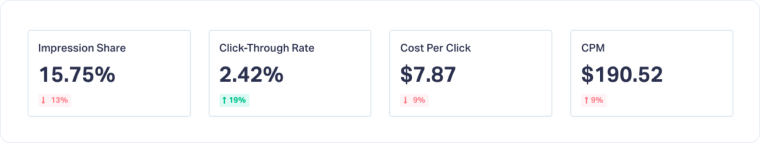
Use these metrics together to get top-of-funnel health context.
Conversion Funnel
The Conversion Funnel shows how users move from visibility to qualified opportunities:
- Impressions: The number of times your Google Ads were shown.
- Clicks: Total clicks generated by Google Ads.
- Leads: Clicks that converted into tracked leads.
- Quotable Leads: Leads marked as qualified or sales-ready.
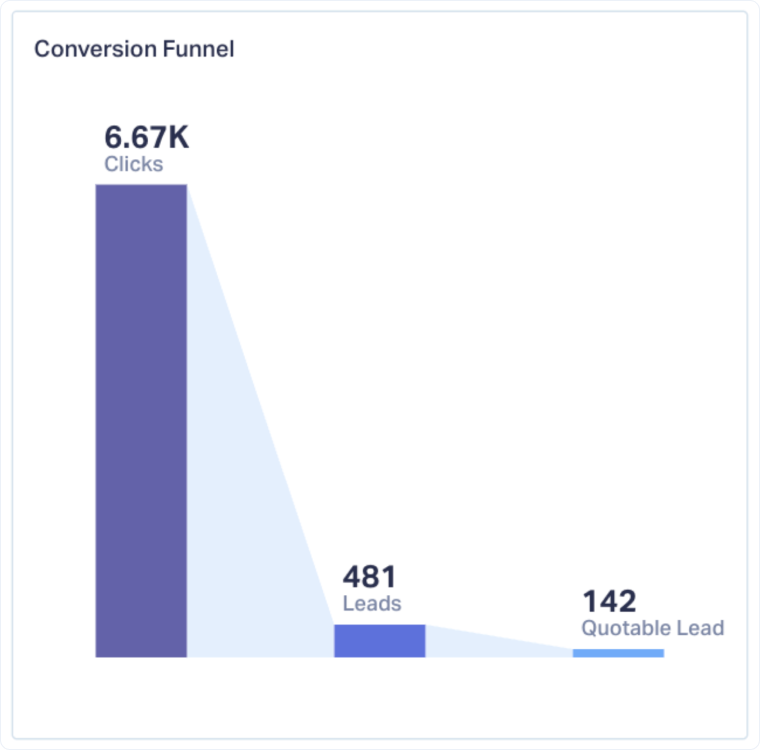
This view helps you identify where performance drops off and whether issues are caused by targeting, messaging, landing pages, or qualification rules.
Spend Breakdown by Dimension
This section shows how your Google Ads spend is distributed across different dimensions. You can switch between campaigns, content, and keywords.
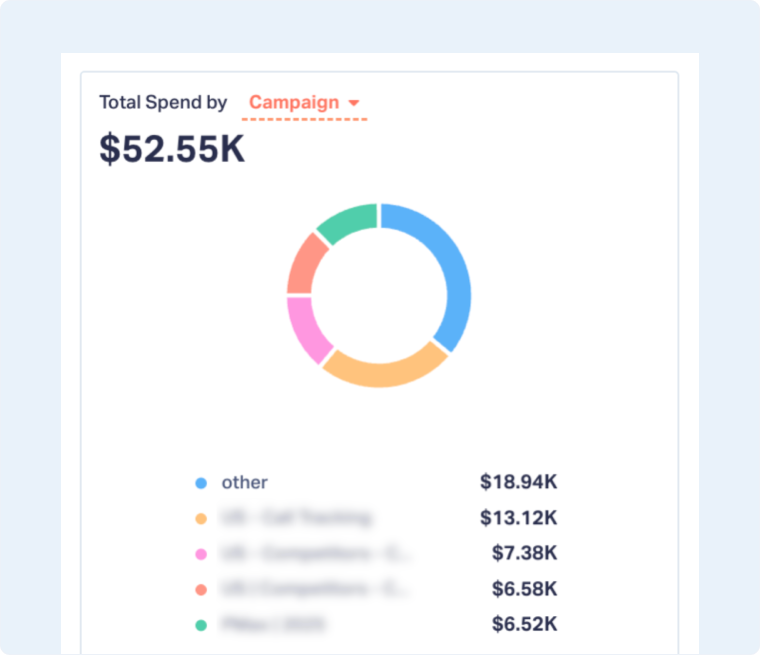
Use this view to ensure the budget aligns with performance and to spot areas where spend may not be justified by lead quality or value.
Top Lead-Generating Performance
This table highlights your top-performing Google Ads segments based on the selected dimension (Campaign, Keyword, or Content).
For each row, you can review:
- Total Leads: Overall lead volume generated.
- Quotable Leads: Number of qualified leads.
- Total Spend: Investment tied to that segment.
- Cost per Lead: Average cost to generate a lead.
- Cost per Quotable Lead: Cost to generate a qualified opportunity.
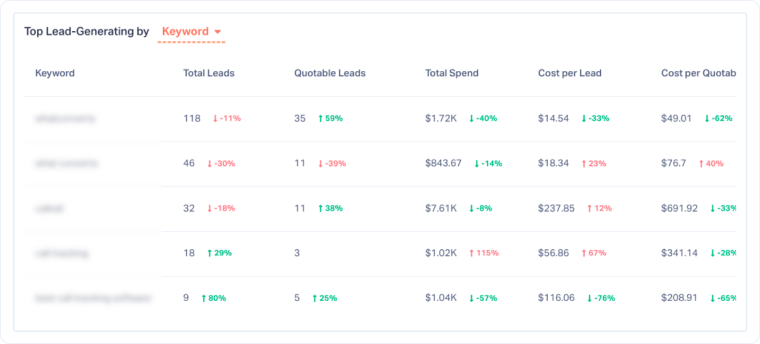
Percentage changes help you compare performance against the previous period, making it easier to identify improving or declining segments.
Device Usage
The Device Usage section shows how performance differs across devices: Desktop, Smartphone, and Tablet
You can switch the metric to analyze device impact on:
- Total Spend
- Impressions
- Clicks
- Leads
- Quotable Leads
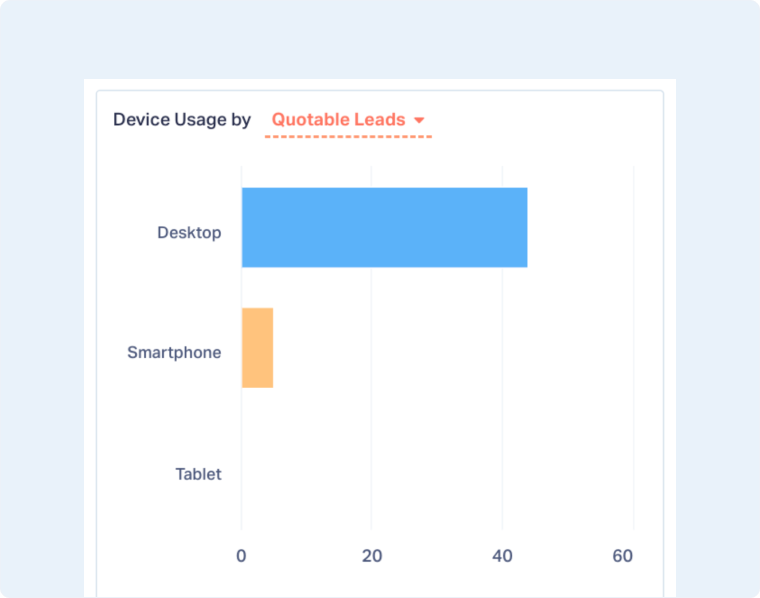
This helps you decide whether device bid adjustments or landing page optimizations are needed to improve efficiency.
Hourly & Daily Distribution
This section shows when leads or quotable leads occur throughout the day and week.
- Hourly Distribution: Identify peak hours for conversions.
- Daily Distribution: Compare performance across days of the week.
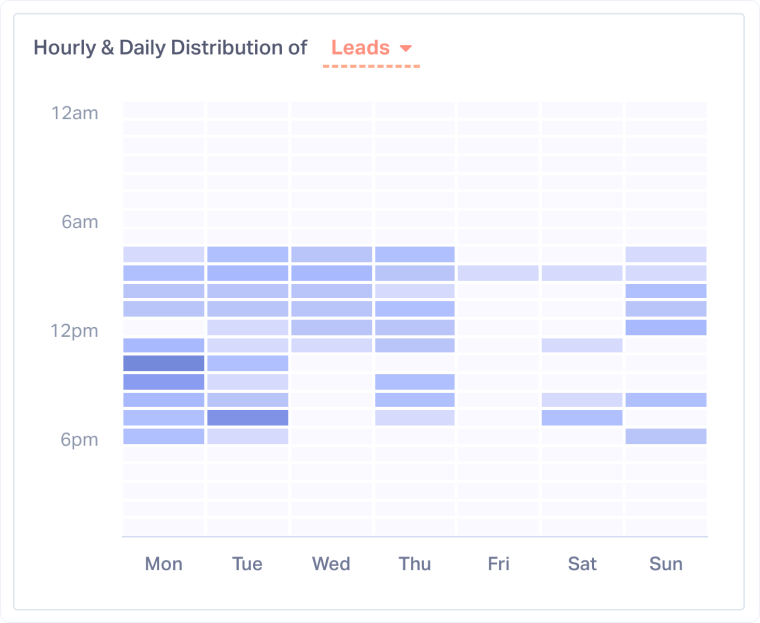
Use this insight to align ad scheduling, staffing, and lead response timing with high-intent periods.
ROAS by Google Ads Dimension
The ROAS section ties spend directly to revenue outcomes. You can analyze performance by campaign, content, and keyword.
For each segment, you can review:
- ROAS: Return based on quote value.
- Sales ROAS: Sales value return on ad spend.
- Total Spend: Ad investment.
- Total Quote Value and Sales Value: Revenue outcomes attributed to Google Ads.
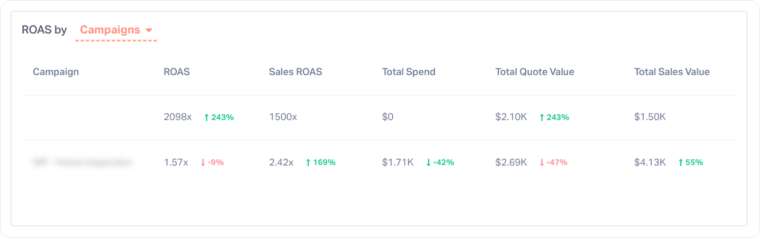
This section is key for identifying which Google Ads segments truly drive revenue and which ones only generate volume.
Related Topics
Get a FREE presentation of WhatConverts
One of our marketing experts will give you a full presentation of how WhatConverts can help you grow your business.
Schedule a Demo


