


Understand the Marketing Channels Report
The Marketing Channels Report gives you a complete view of which marketing sources generate your most valuable leads and revenue. It helps you identify trends, compare performance across channels, and uncover opportunities to improve your marketing ROI.
Note: Learn how to access and navigate Standard Reports in Use Standard Reports and discover how to turn insights into action in Analyze Performance with Standard Reports.
Channel Performance Overview
This section summarizes your top-performing channels based on the metrics that matter most. You can quickly see which sources drive the highest number of leads, quote value, and sales value, and how performance has changed compared to the previous period.
- Top Channels by Lead Type: Shows how each channel performs by conversion type (calls, forms, chats, appointments, and others).
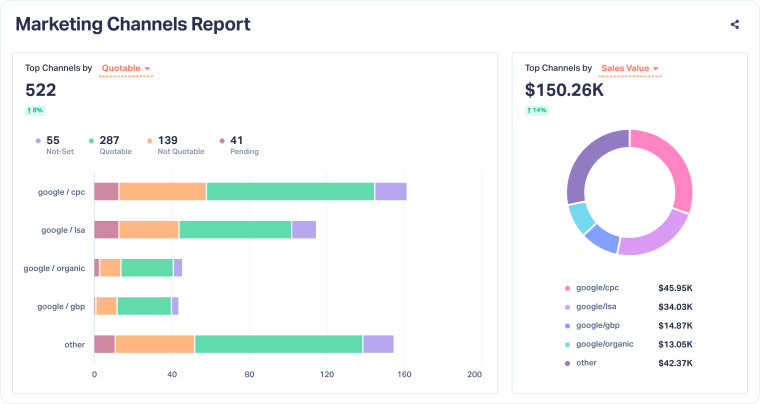
- Top Channels by Quotable: Shows leads by qualification status, so you can see which channels deliver sales-ready leads and which still have potential.
- Top Channels by Quote Value: Displays the total quote value generated per channel to help identify which sources drive high-intent opportunities.
- Top Channels by Sales Value: Reveals which channels contribute the most to actual sales revenue, not just leads.
Use these metrics together to measure both lead quantity and quality across your marketing mix and understand which channels are most valuable to your business.
Marketing Efficiency Insights
This section helps you evaluate how efficiently each channel converts marketing investment into leads and revenue.
- Marketing Spend: Shows how much you invested in each channel.
- Cost per Lead (CPL): Calculates your average cost to generate a lead by dividing Marketing Spend by total leads.
Both metrics display performance changes compared to the previous period, helping you spot cost or conversion trends.
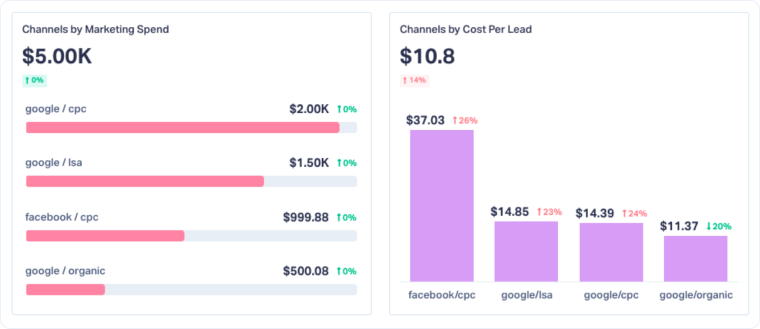
Tip: To see Marketing Spend data, connect your Google Ads, Bing Ads, or Facebook Ads accounts through Reports > Marketing Spend.
Channel Trends Over Time
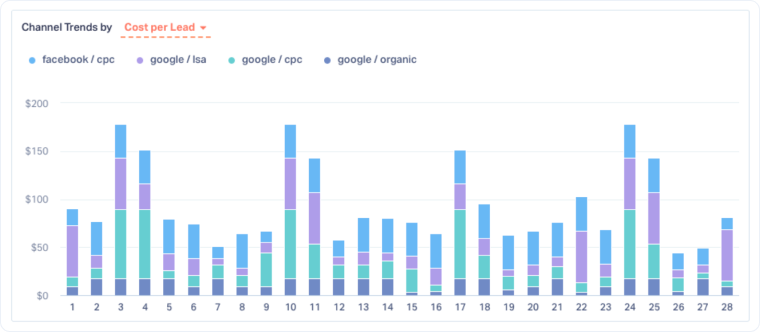
The Channel Trends chart lets you compare how performance metrics change over time. Each colored bar represents a channel, and you can switch between metrics like Total Leads, Quotable Leads, Quote Value, Sales Value, Marketing Spend, and Cost per Lead.
Use this view to:
- Identify seasonal or campaign-driven trends that affect performance.
- Compare channels across multiple metrics to see where high lead volume aligns (or doesn’t) with high value or efficiency.
- Detect shifts in Cost per Lead or Sales Value to spot optimization opportunities.
- Analyze how performance evolves daily, weekly, or monthly to understand short-term fluctuations or long-term patterns.
- Catch underperforming channels early to reallocate budget before spend is wasted.
Top Channels Summary Table
The summary table at the bottom of the report consolidates all channel data into one detailed view. For each channel, you can see:
- Total Leads: Number of leads generated during the selected period.
- Quotable Leads: Number of leads marked as qualified or valuable.
- Quote Value & Sales Value: Revenue metrics tied to your leads.
- Marketing Spend & Cost per Lead: Investment and efficiency metrics.
The percentage change next to each metric shows how performance compares to the previous period, helping you track improvements or declines at a glance.
Related Topics
Get a FREE presentation of WhatConverts
One of our marketing experts will give you a full presentation of how WhatConverts can help you grow your business.
Schedule a Demo


