


Understand the Sales Call Handling Report
The Sales Call Handling Report shows what happens after the phone rings. It focuses on how incoming calls are answered, handled, and converted into quotable or booked opportunities, giving clear visibility into sales execution that directly impacts revenue. This report highlights where calls break down once they reach your team and quantifies how missed or mishandled calls turn into lost revenue and wasted marketing spend.
Note: Learn how to access and navigate Standard Reports in Use Standard Reports and discover how to turn insights into action in Analyze Performance with Standard Reports.
Sales Call Handling Funnel
This section shows how incoming calls move through the sales process, from incoming calls to answered calls and finally to quotable or not quotable outcomes. It highlights where calls drop off and where opportunities are either captured or lost.
The funnel also shows how calls from different sources contribute, helping you see whether breakdowns happen before or after a call is answered.
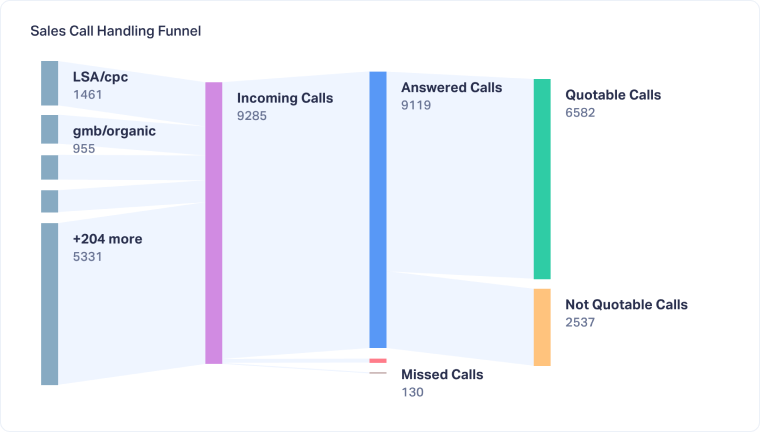
Use this to identify the biggest bottlenecks in call handling, such as low answer rates or a high number of calls that are answered but never become quotable opportunities.
Call Handling Score
The Call Handling Score provides a single performance indicator that reflects how effectively calls are being handled. It is influenced by factors such as answer rate, response time, call outcomes, and booking behavior.
This score makes it easier to track improvements or declines in call handling quality over time without needing to interpret multiple metrics at once.
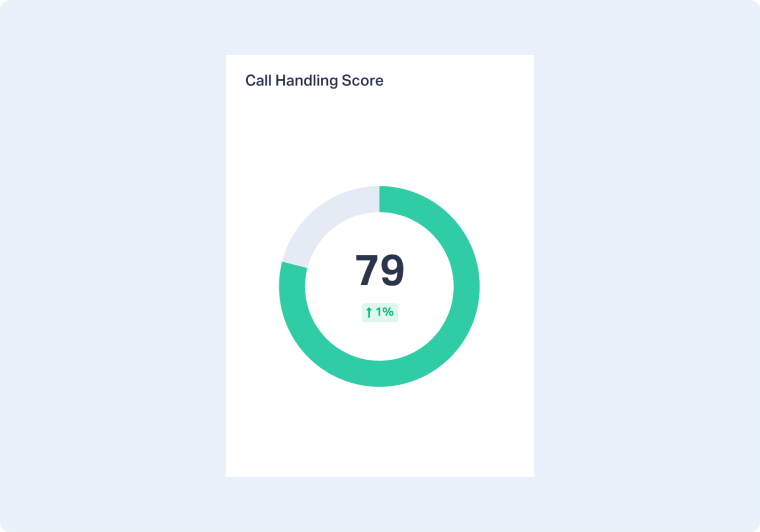
Use this to quickly assess whether call handling performance is improving or slipping and to flag periods where sales execution may be impacting revenue.
Key Sales Call Metrics
This section provides a snapshot of the most important call handling metrics:
- Call Answer Rate
- Call Quotable Rate
- Avg. Answer Time
- Avg. Call Duration
Together, these metrics show how reliably calls are answered, how often answered calls turn into qualified opportunities, and how efficiently conversations are handled.
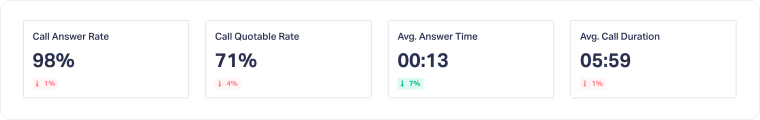
Use this to understand whether calls are being answered quickly, handled effectively, and converted into meaningful sales opportunities.
Hourly & Daily Distribution of Calls
This heatmap shows when calls occur throughout the week and across different times of day. You can switch between missed calls, answered calls, and quotable calls to see how call handling performance changes by time window.
It helps reveal patterns where demand is high, but availability or responsiveness may be low.
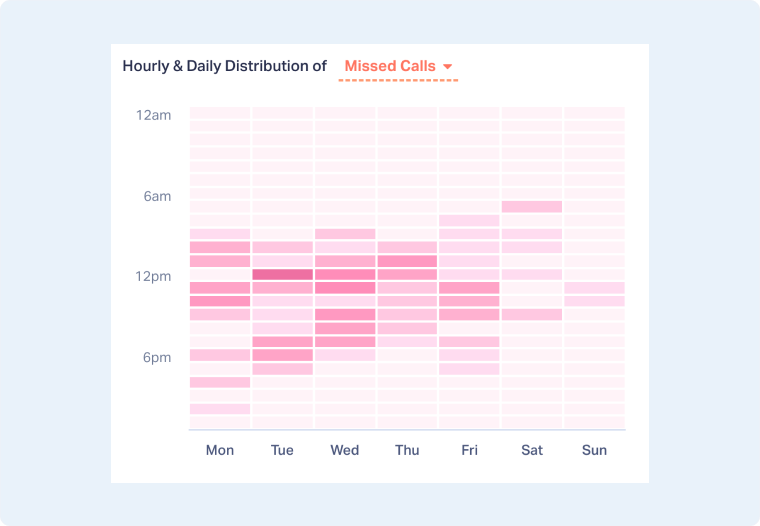
Use this to identify peak call windows, adjust staffing or coverage, and reduce missed opportunities during high-intent periods.
Answered Calls by Dimension
This chart shows how answered calls break down across key dimensions such as customer type, call type, sales agent, or call duration. It helps you see what kinds of calls your team is actually spending time on once calls are answered, not just how many are coming in.
This view makes it clear where sales effort is going after calls connect and whether that effort aligns with revenue-generating opportunities.
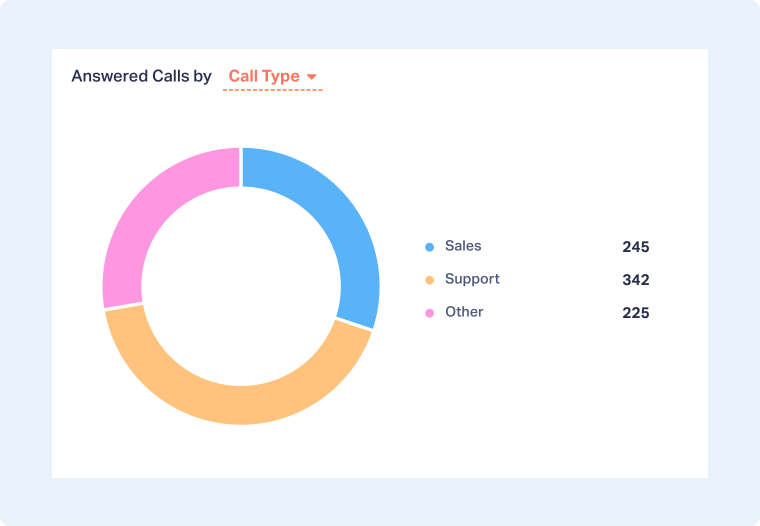
Use this section to confirm that answered calls are weighted toward high-value customer types, spot agents handling a disproportionate share of key conversations, and identify call categories that may be consuming time without driving revenue.
Quotable Calls by Sales Agent and Call Duration
This section shows which sales agents are converting answered calls into quotable opportunities and how call length relates to those outcomes. By switching between sales agent and call duration, you can see not only who is generating quotable calls, but also the type of conversations that tend to result in qualified opportunities.
Short calls may indicate quick qualification or price checks, while longer calls often reflect deeper discovery and higher intent prospects.
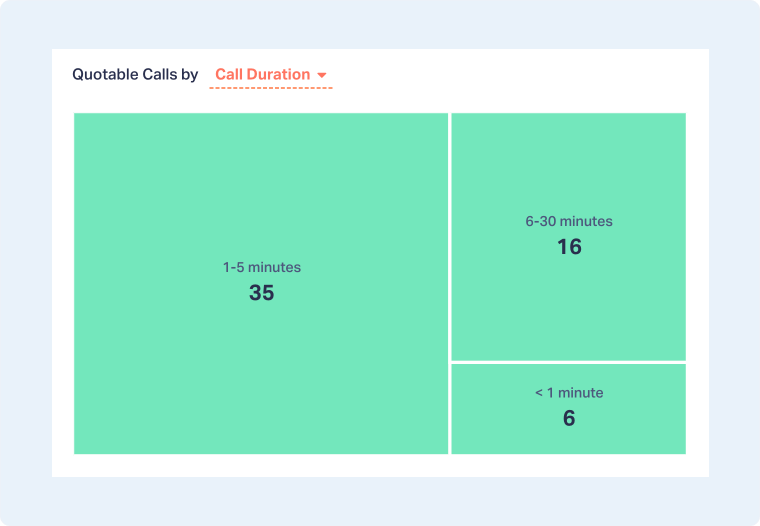
Use this section to identify top-performing agents, understand which call durations most often lead to quotable opportunities, and spot patterns where calls may be ending too quickly or running long without producing results.
Missed Calls by Dimension
This section shows where missed calls originate by breaking them down across multiple dimensions, including city, destination number, marketing channel, and keyword. It helps you pinpoint exactly where calls are going unanswered, whether the issue is tied to a specific location, tracking number, campaign, or search intent.
By switching dimensions, you can trace missed calls back to the sources that generated them and identify patterns that would otherwise stay hidden in aggregate metrics.
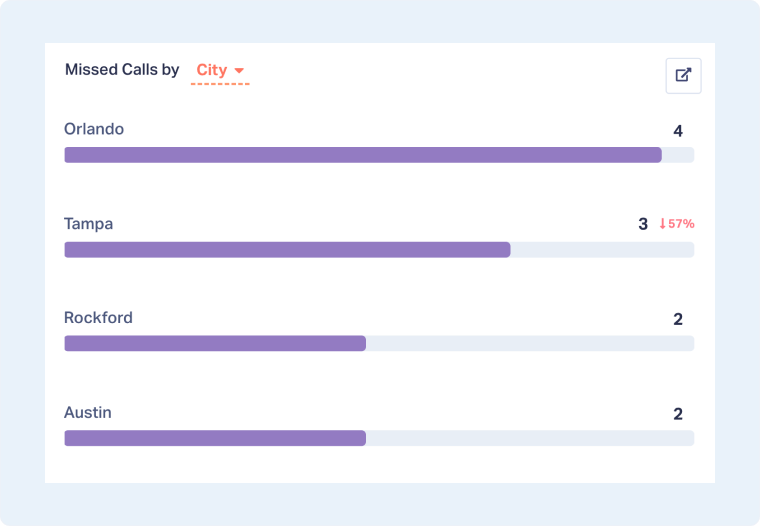
Use this section to identify where availability gaps exist, understand which campaigns or locations are driving missed opportunities, and take action to reduce wasted spend by aligning coverage with real call demand.
Value and Spend Metrics
This section connects call handling directly to financial outcomes, including:
- Total Quote Value
- Total Sales Value
- Cost per Incoming Call
- Wasted Spend
It shows how missed or mishandled calls translate into real financial impact.

Use this to quantify the revenue lost from missed calls or poor call handling and justify operational improvements without increasing ad spend.
Sales Team Call Handling Performance
This table compares call handling performance across sales agents, including answered calls, quotable calls, quotable rate, answer time, and call duration.
It provides a transparent view of how individual behaviors influence outcomes.
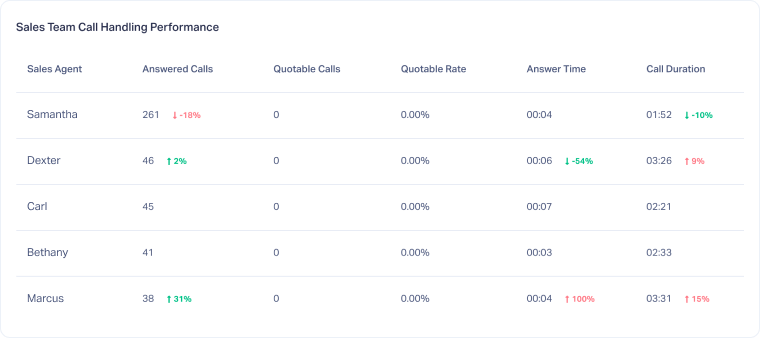
Use this to guide coaching, standardize best practices, and improve overall sales execution using objective call-level data.
Related Topics
Get a FREE presentation of WhatConverts
One of our marketing experts will give you a full presentation of how WhatConverts can help you grow your business.
Schedule a Demo


