


What is the Lead Overview Chart?
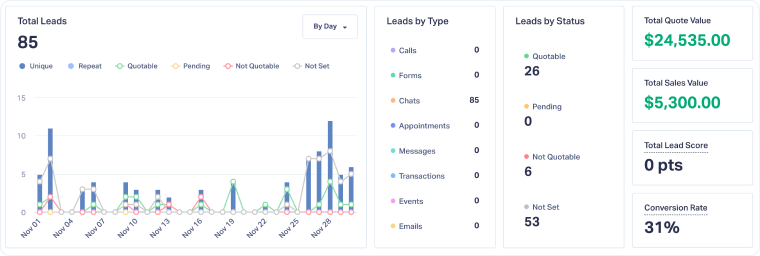
The Lead Overview Chart in the Lead Manager shows a visual summary of lead activity and performance. It updates automatically based on the time range and filters you choose.
Why Use the Lead Overview Chart?
The chart helps you quickly spot trends and measure the quality and value of your leads, so you can optimize marketing performance based on revenue, not just lead volume.
With the Lead Overview Chart, you can:
- Track lead trends over time by day, week, or month.
- Understand Lead Type and Status distribution to see which efforts generate the most results and how much potential your leads have to generate revenue.
- Filter by Lead Type or Status directly from the chart to identify which channels drive results and better understand the current status of your leads.
- Monitor revenue impact with Total Quote Value and Total Sales Value for the leads displayed.
- Check lead quality using Lead Score and Conversion Rate at a glance.
Examples of How Businesses Use the Lead Overview Chart
- HVAC operations manager: Tracks seasonal changes in call and appointment leads on the chart to prepare staffing.
- Business owner: Monitors Total Quote Value and Total Sales Value to confirm revenue generated, measure its progression over time, and identify the strongest months of the year.
- Marketing director: Reviews monthly lead trends to compare the impact of campaigns and confirm whether peaks in Quote and Sales Value align with promotional periods.
Related Topics
Was this page helpful?
Get a FREE presentation of WhatConverts
One of our marketing experts will give you a full presentation of how WhatConverts can help you grow your business.
Schedule a Demo


