


Create Time-Based Reports in the Report Builder
You can use the timeline view selector in the Report Builder to visualize how your metrics and dimensions evolve over time. For example, viewing Sales Value by Month or Leads by Week. This helps you identify seasonality, performance trends, and long-term growth patterns.
Create a Time-Based Report
To create a report that shows data over time:
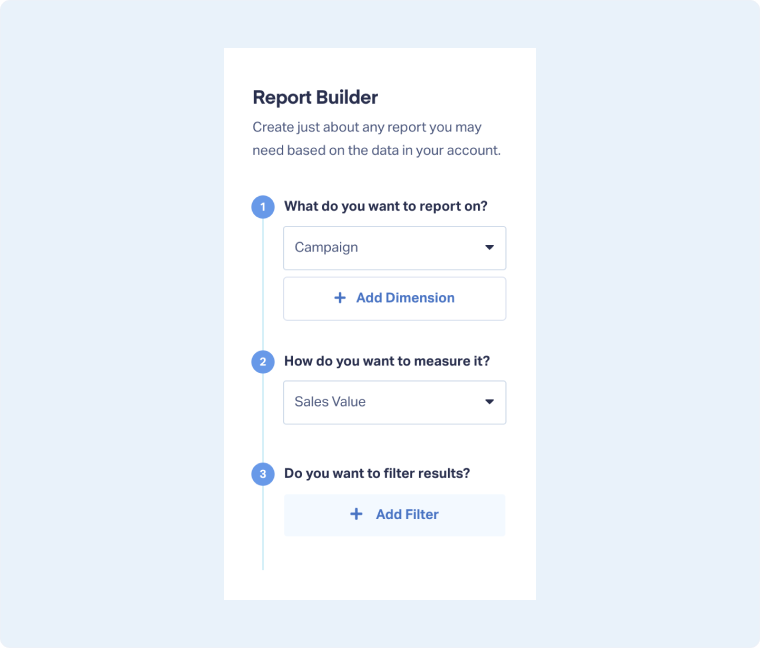
- Access the Report Builder.
- In the sidebar, choose your dimensions and metrics (e.g., select Campaign as your dimension and Sales Value as your metric).
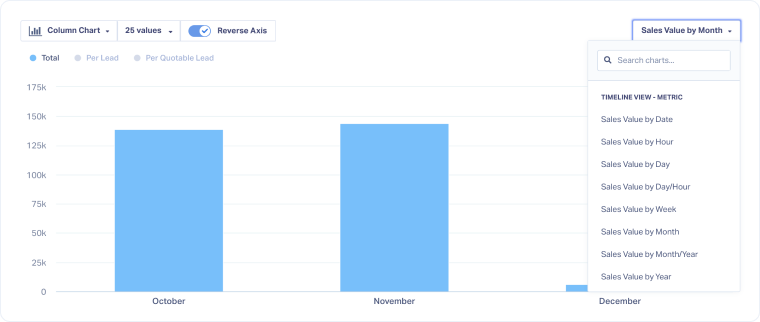
- At the top of your chart, open the timeline view selector. Choose how you want to group the data (e.g., grouped by metric: Sales Value by Month).
- Click “Reverse Axis”. This makes your time intervals appear on the horizontal axis, making the chart easier to read over time.
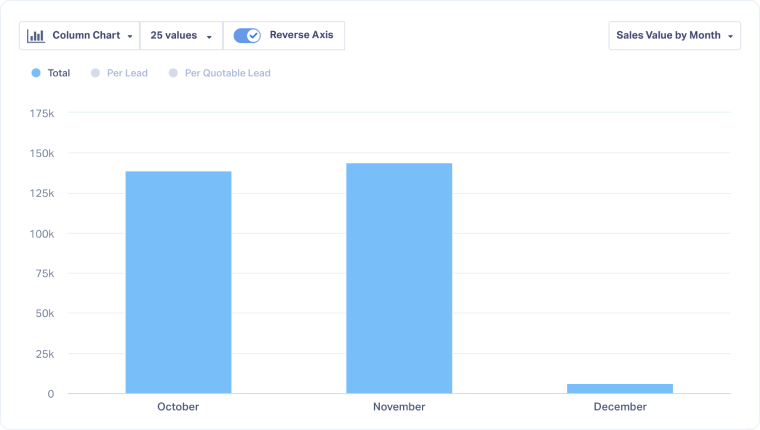
Your chart will now display how your selected dimension or metric performs grouped by your chosen time period (e.g., Sales Value by Month), over the chosen time range.
Related Topics
Was this page helpful?
Get a FREE presentation of WhatConverts
One of our marketing experts will give you a full presentation of how WhatConverts can help you grow your business.
Schedule a Demo


