


Understand the Summary Report
The Summary Report gives you a quick snapshot of marketing performance, helping you make fast, informed decisions to grow your marketing ROI.
Note: Learn how to access and navigate Standard Reports in Use Standard Reports and discover how to turn insights into action in Analyze Performance with Standard Reports.
General Performance Overview
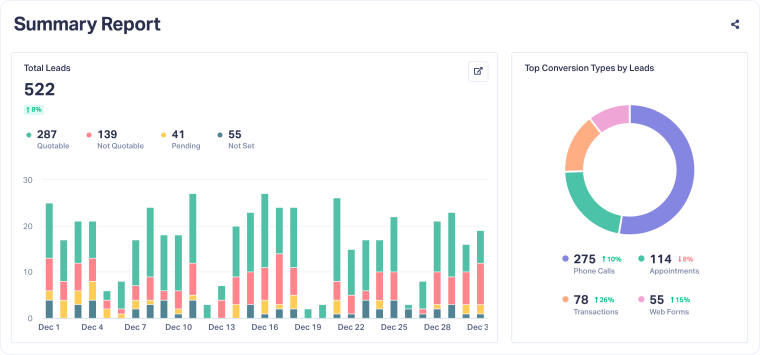
This section gives you a snapshot of overall lead performance for the selected time period. You can quickly assess lead volume, lead quality, and conversion types:
- Lead Volume: See how many leads were generated each day within the selected period.
- Lead Quality: Track how many were marked as Quotable, Not Quotable, Pending, or Not Set.
- Conversion Types: View the breakdown by type (e.g., Phone Calls, Appointments, Transactions, Web Forms).
The percentage change next to each metric shows how your results compare to the previous period, so you can spot trends or shifts at a glance.
Sales & ROI Insights
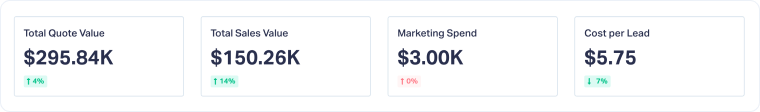
This section shows how your marketing efforts are turning into real business results. It includes four key metrics to assess performance and marketing health:
- Total Quote Value: The total value of quotes generated during the selected period.
- Total Sales Value: The value of leads that turned into sales.
- Marketing Spend: The amount invested in marketing during this time.
- Cost per Lead: The average cost to generate a lead, calculated from Marketing Spend and total leads.
Each metric includes a % change compared to the previous period, helping you spot ROI trends, track growth, and evaluate the overall health of your marketing.
Lead Attribution Breakdown
Source Performance
This section shows how different traffic sources contribute to your lead volume and revenue.
- Top Sources by Leads shows which platforms (e.g., google/cpc, google/lsa) are driving the most leads during the selected time period.
- Top Sources by Value goes a step further and reveals the Quote Value and Sales Value each source generates.
The percentage change tells you whether performance improved or declined compared to the previous period. This helps you double down on what’s working and adjust what’s not.
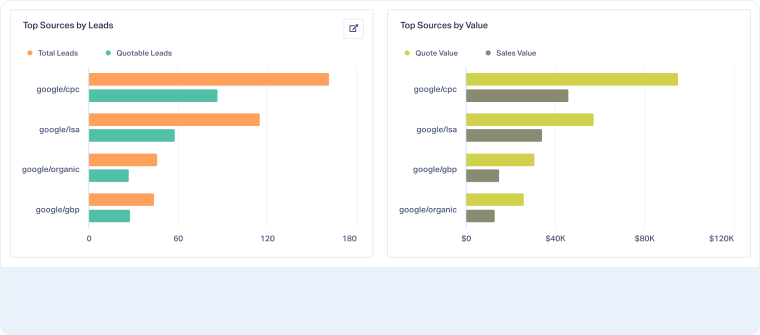
Tip: Use it to reallocate spending, optimize for the sources that drive the most revenue, and improve the ones underperforming.
Keyword Performance
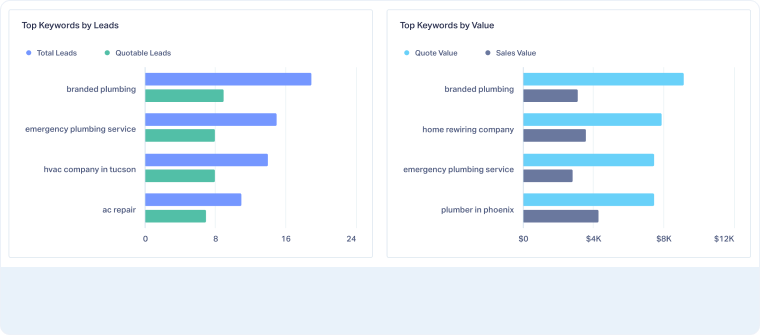
This section helps you understand which search terms are bringing in leads, and how valuable those leads are.
- Top Keywords by Leads ranks the search keywords that brought the most leads during the selected time.
- Top Keywords by Value compares those same terms by Quote and Sales Value, so you know which keywords generate high-intent, high-revenue leads.
The percentage change shows whether performance for each keyword is trending up or down.
Tip: Use it to improve your keyword strategy, pause underperformers, and bid more on high-value terms.
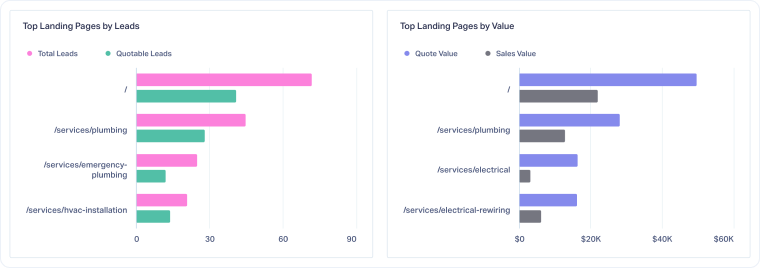
Landing Page Performance
This section shows how well your landing pages are converting visitors into valuable leads.
- Top Landing Pages by Leads highlights which URLs are driving the most conversions.
- Top Landing Pages by Value shows which pages are attracting leads that actually generate revenue (Quote and Sales Value).
You’ll see how each page performs over time.
Tip: Use it to optimize and replicate your top-performing pages, and fix underperforming ones.
Related Topics
Get a FREE presentation of WhatConverts
One of our marketing experts will give you a full presentation of how WhatConverts can help you grow your business.
Schedule a Demo


