


Compare Time Periods in Your Custom Reports
Who has access to this feature?
Available on: Pro and Elite Plans
Access level: All User
You can compare time periods in the Report Builder to see how performance changes over time. This feature lets you quickly visualize growth, seasonality, or shifts in key metrics like leads, quote value, or sales value.
Compare Data Across Time Periods
To compare different time periods in your report:
- Open or create the report in the Report Builder.
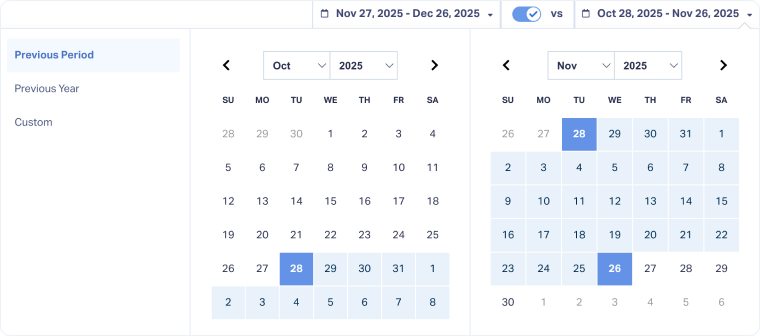
- Click the Compare Date toggle next to the date range selector.
- Choose the first date range you want to analyze.
- Select a comparison period (for example, the previous month, the same period last year, or a custom date range).
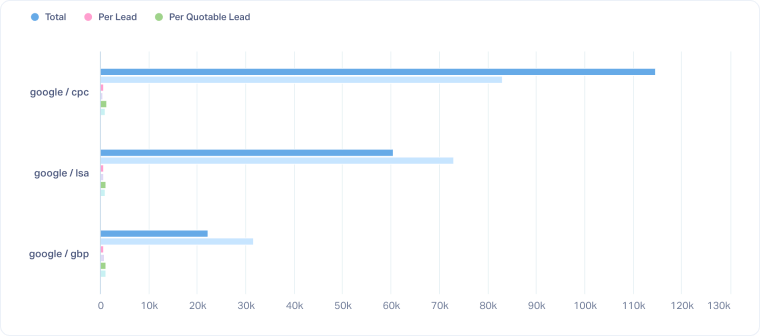
- Review your results in the chart and table.
The chart displays multiple bars or graphic elements for each period, using different colors to represent each time range.
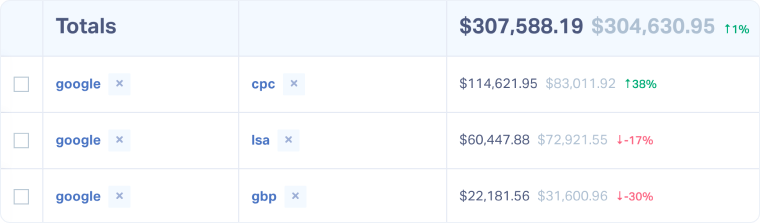
The table shows data for both time periods, with the previous value in gray and a percentage change indicator showing whether results increased (green) or decreased (red).
Tip: Comparing equal-length time periods helps you identify performance trends, campaign impact, and growth more accurately.
Related Topics
Get a FREE presentation of WhatConverts
One of our marketing experts will give you a full presentation of how WhatConverts can help you grow your business.
Schedule a Demo


