


Understand the Call Tracking Report
The Call Tracking Report helps you understand how phone calls perform. It focuses on call volume, call quality, caller intent, and outcomes from calls, so you can see which conversations turn into real opportunities and where calls are being missed or wasted.
This report is designed to analyze call behavior and performance, not overall sales pipelines or rep-level handling. It connects calls to marketing sources, detected keywords, quote value, and sales value to give clear visibility into call-driven opportunities.
Note: Learn how to access and navigate Standard Reports in Use Standard Reports and discover how to turn insights into action in Analyze Performance with Standard Reports.
Total Calls
This section shows the total number of calls received during the selected time period, along with how many were answered versus missed.
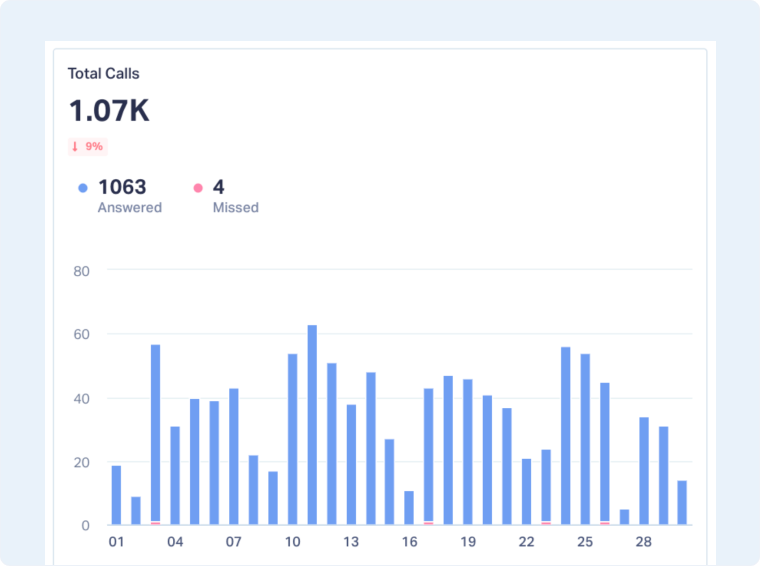
Use this to understand whether call volume is increasing or declining and to quickly identify missed-call risk that could be directly impacting revenue.
Calls by Sentiment
This chart breaks down calls by sentiment (positive, neutral, negative, or other), based on conversation analysis.
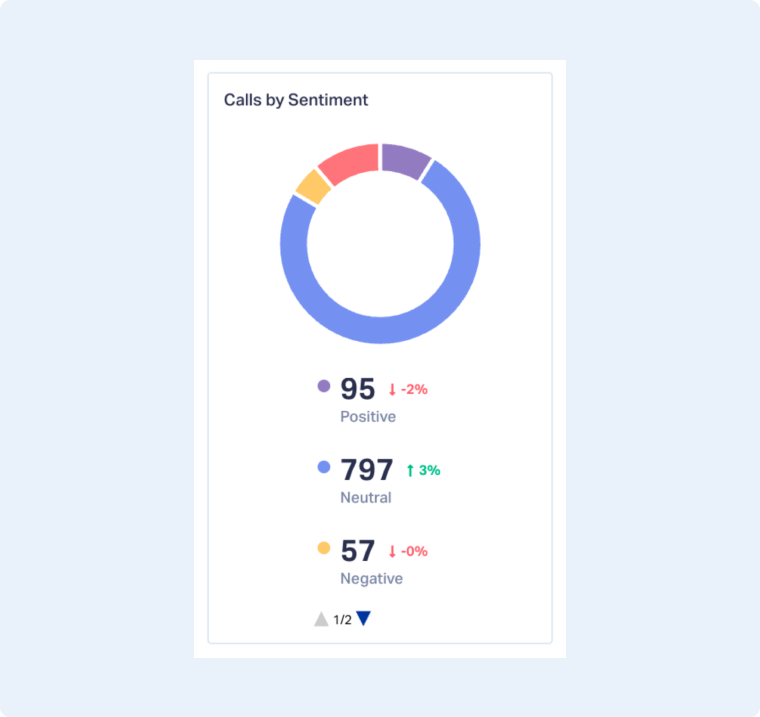
Use this to spot shifts in call quality after messaging or operational changes and to identify potential friction before it affects conversions.
Call Performance Metrics
This section provides a quick snapshot of call performance and outcomes.
- Response Rate: Shows the percentage of calls that were answered, helping you identify missed opportunity risk.
- Avg. Duration Time: Indicates how long conversations last on average, often signaling call quality and engagement.
- Avg. Quote Value: Displays the average quoted value generated from calls when quote data is available.
- Avg. Sales Value: Shows the average sales value attributed to calls that resulted in closed deals.
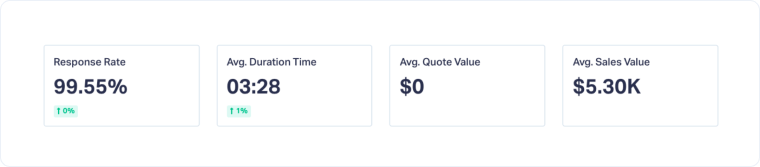
Use this to quickly assess whether calls are being answered, how engaged callers are, and whether phone conversations are translating into meaningful revenue.
Calls by Marketing Channels, Keywords, or Landing Pages
This chart shows where calls are coming from and how they perform based on marketing channel, keyword, or landing page.
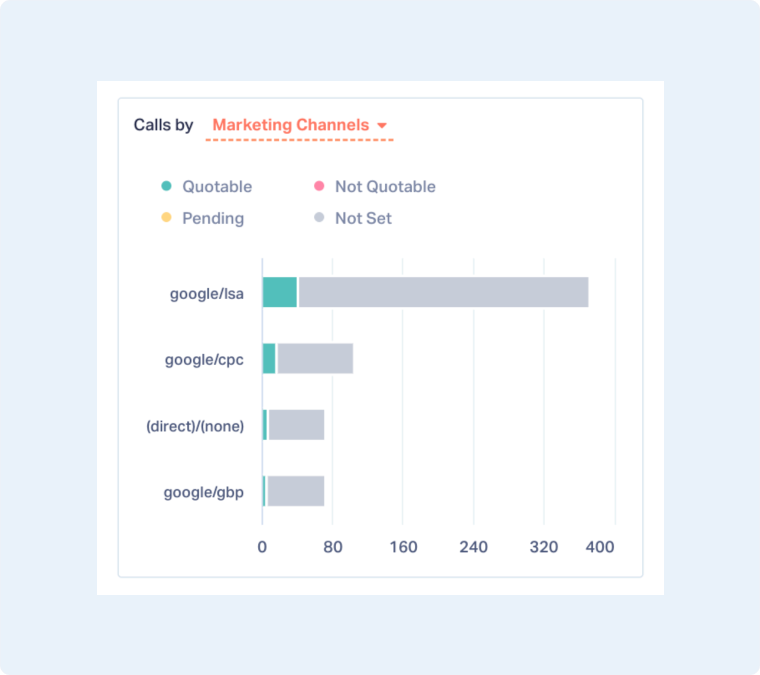
Use this to identify which sources drive the most valuable calls and which campaigns or pages may be generating low-intent or unqualified conversations.
Top Call Keywords or Topics Detected
This section displays the most frequently detected keywords or topics mentioned during calls. It reflects what callers are actually talking about once they get on the phone.
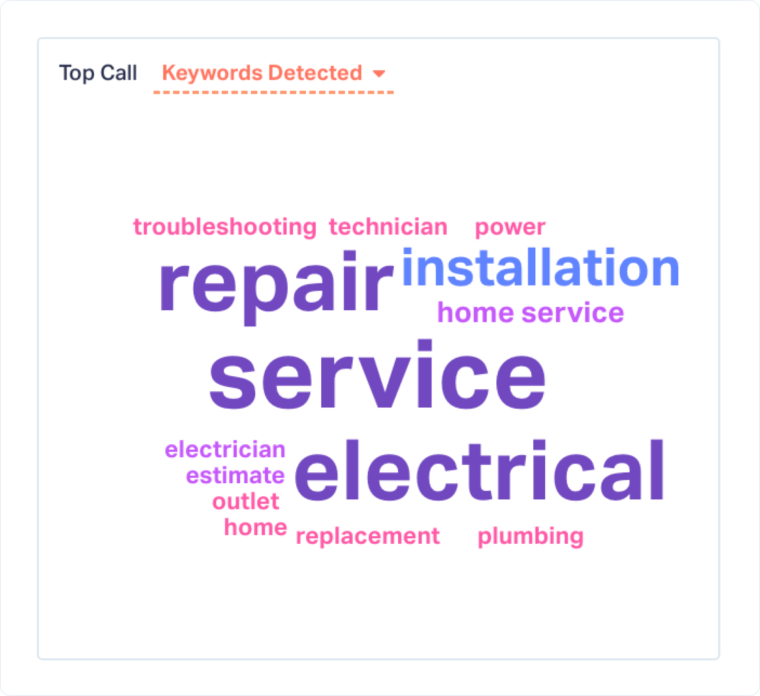
Use this to validate caller intent, confirm alignment between ads and real demand, and uncover high-intent services or issues worth prioritizing.
Duration Segments
The Duration Segments chart groups calls by length, showing how conversations are distributed from short interactions to longer discussions.
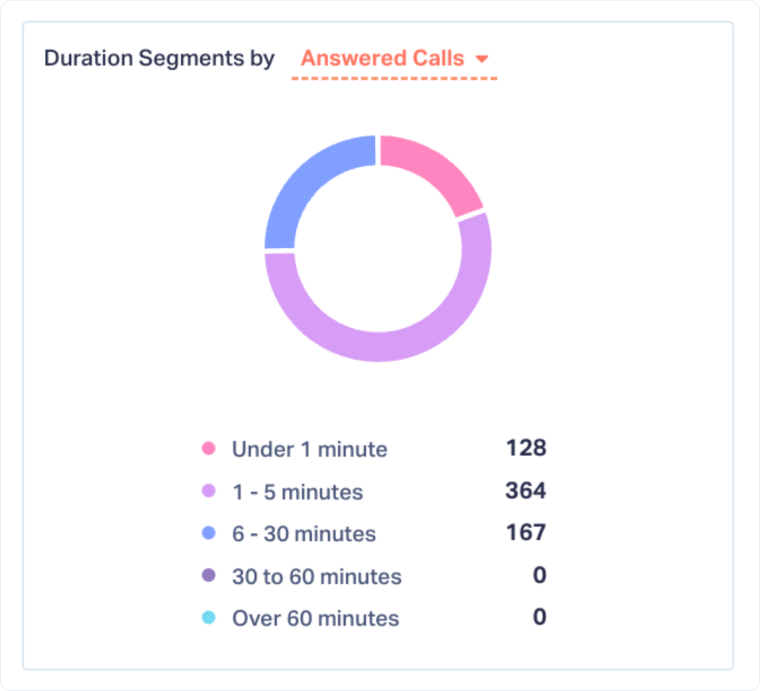
Use this to separate quick, low-intent calls from deeper conversations that are more likely to result in quotes or sales.
Hourly & Daily Distribution of Calls
This heatmap shows when calls occur throughout the week and across different times of day. It highlights patterns in call volume and timing.
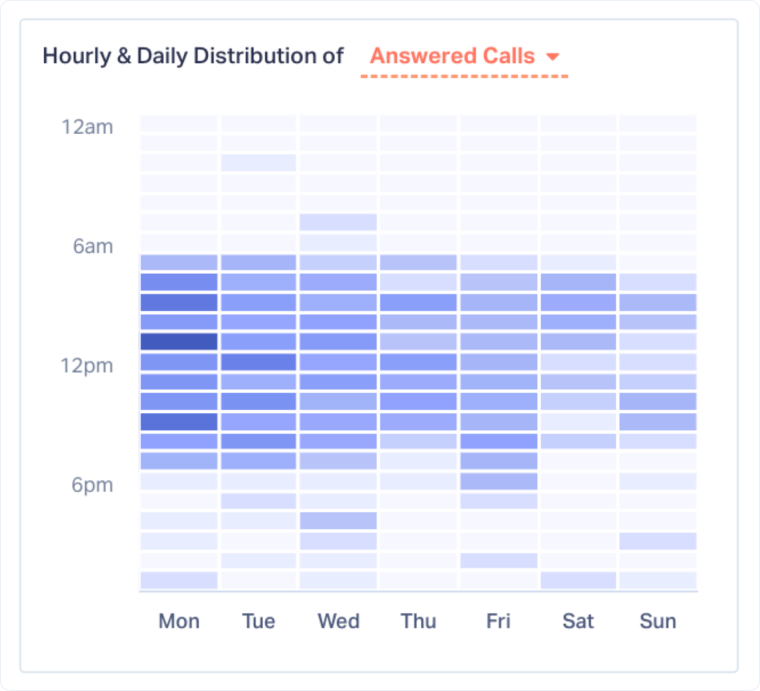
Use this to identify peak call windows, improve staffing coverage, and reduce missed calls during high-intent periods.
Top Callers
The Top Callers table lists individual calls with details such as caller name, time, source, duration, recording, and any associated quote or sales value.
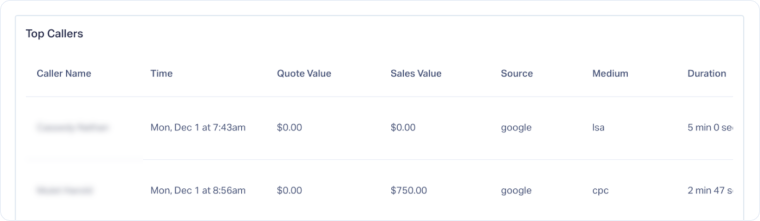
Use this to review specific calls when deeper validation is needed and to confirm attribution from marketing source to call outcome.
Related Topics
Get a FREE presentation of WhatConverts
One of our marketing experts will give you a full presentation of how WhatConverts can help you grow your business.
Schedule a Demo


