


Introduction to the Dashboard
The Dashboard is your starting point in WhatConverts. It brings together your most important lead data into one view so you can quickly see performance, spot trends, and dive deeper when needed.
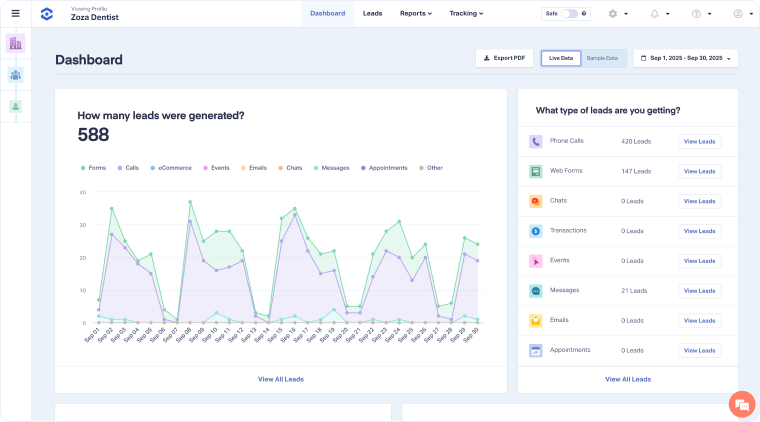
Available at the Master Account, Account, and Profile levels, the Dashboard adapts to the level you’re viewing. You can toggle between Live Data and Sample Data or choose a custom Date Range.
Why Use the Dashboard?
The Dashboard isn’t just a summary; it’s the overview that turns raw lead data into actionable insights to help you decide what to do next.
- See performance at a glance. Spot changes in lead volume and revenue quickly to understand performance.
- Focus on quality, not just volume. Track quotable rates and sales values to determine which efforts are actually producing revenue.
- Move from overview to action. Each chart links directly to deeper reports and lead records, making it easy to take action.
Key Metrics in the Dashboard
- How many leads were generated?: See the total number of leads for your selected date range, broken down by type (calls, forms, chats, transactions, etc.). This metric helps you spot trends, compare channels, and understand how lead volume changes over time.
- What type of leads are you getting?: View the distribution of leads by type, such as phone calls, forms, or appointments. This shows which channels are driving conversions and whether your marketing mix is balanced across lead sources.
- What is the value of your leads?: See the total quote value and sales value attached to your leads over time. This metric goes beyond lead volume to show the real business impact of your leads.
- Which source/medium generated more leads?: See which traffic sources and mediums (e.g., Google Ads, Local Services Ads, organic search, or direct) generated the most leads, broken down by type. This metric highlights which channels are driving leads, helping you allocate budget to the sources that deliver real opportunities.
- What type of leads are you getting?: See the split between unique and repeat leads. This helps you understand how much of your lead flow comes from new prospects versus returning contacts.
- What is the status of your leads?: View the percentage of leads marked as Quotable, Not Quotable, Pending, or Not Set. This shows overall lead quality and highlights how much potential exists in your tracked leads.
- Which pages generated more leads?: See which landing pages generated the most leads during your selected date range. This helps you identify high-performing pages and optimize those that aren’t driving results.
- Who are your most recent leads?: See a list of your latest leads with details like name, type, source, medium, and landing page. This gives you quick visibility into who’s contacting you and how they found you.
- Which source/medium are converting better?: View conversion rates by source and medium based on quotable leads. This helps you identify which channels produce higher-quality leads that are more likely to turn into revenue.
- Which source/medium generated more quote value?: Compare sources and mediums by the total and per-lead value of quotes. This metric highlights which campaigns drive the most quoting opportunities and potential revenue.
- Which source/medium generated more sales value?: See how much closed revenue each source and medium produces. This ties your marketing directly to real sales results, proving ROI and guiding smarter budget allocation.
Examples of How Businesses Use the Dashboard
- Business Owners: Use the “Value of Your Leads” metric to see how revenue (quote and sales value) trends over time. This makes it easy to understand whether marketing is consistently driving sales growth.
- Agencies: Identify which sources and mediums generate the most revenue, not just the most leads. With this visibility, agencies can allocate budgets toward the campaigns and channels that deliver the highest ROI.
- Marketers: Review which landing pages generate the most leads. This helps marketers double down on high-performing pages and refine or replicate strategies for those that aren’t converting.
Related Topics
Was this page helpful?
Get a FREE presentation of WhatConverts
One of our marketing experts will give you a full presentation of how WhatConverts can help you grow your business.
Schedule a Demo


