

The WhatConverts Dashboard
When you log into WhatConverts, you will have the opportunity to review the "WhatConverts" dashboard. This Dashboard is available at the Master Account, Account and Profile levels.
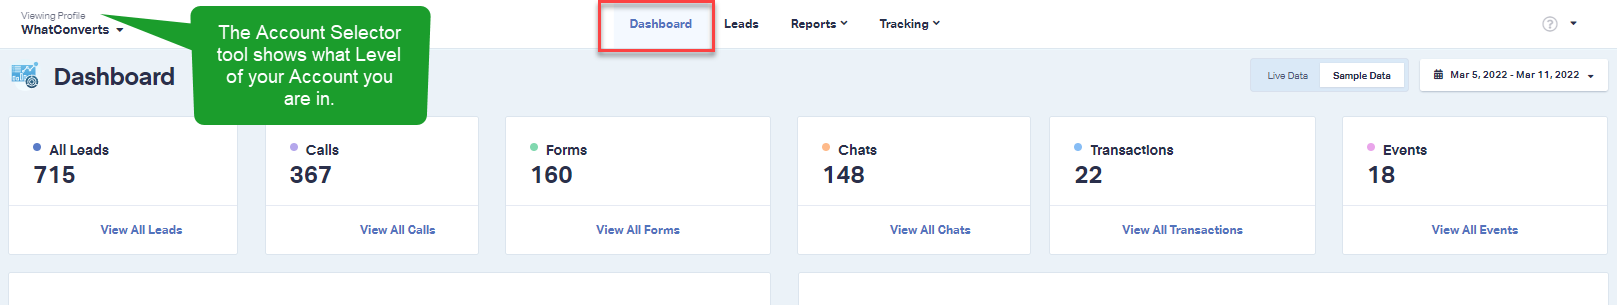
When you are logged into your WhatConverts account, you can review what level you're in. You can be viewing the Master Account, Account or Profile. In our example above, we are viewing the Profile.
You will also be able to determine where, in the Navigation you are as well. In the red box, you'll see we are viewing the Dashboard.
In the Dashboard, you will be able to select to view Live or Sample data and choose a Date Range to review.
The first line of data is the Total Leads and a break down of Totals by Lead Type for your selected date range.
Below the Lead Counts, you'll find reporting and charts.
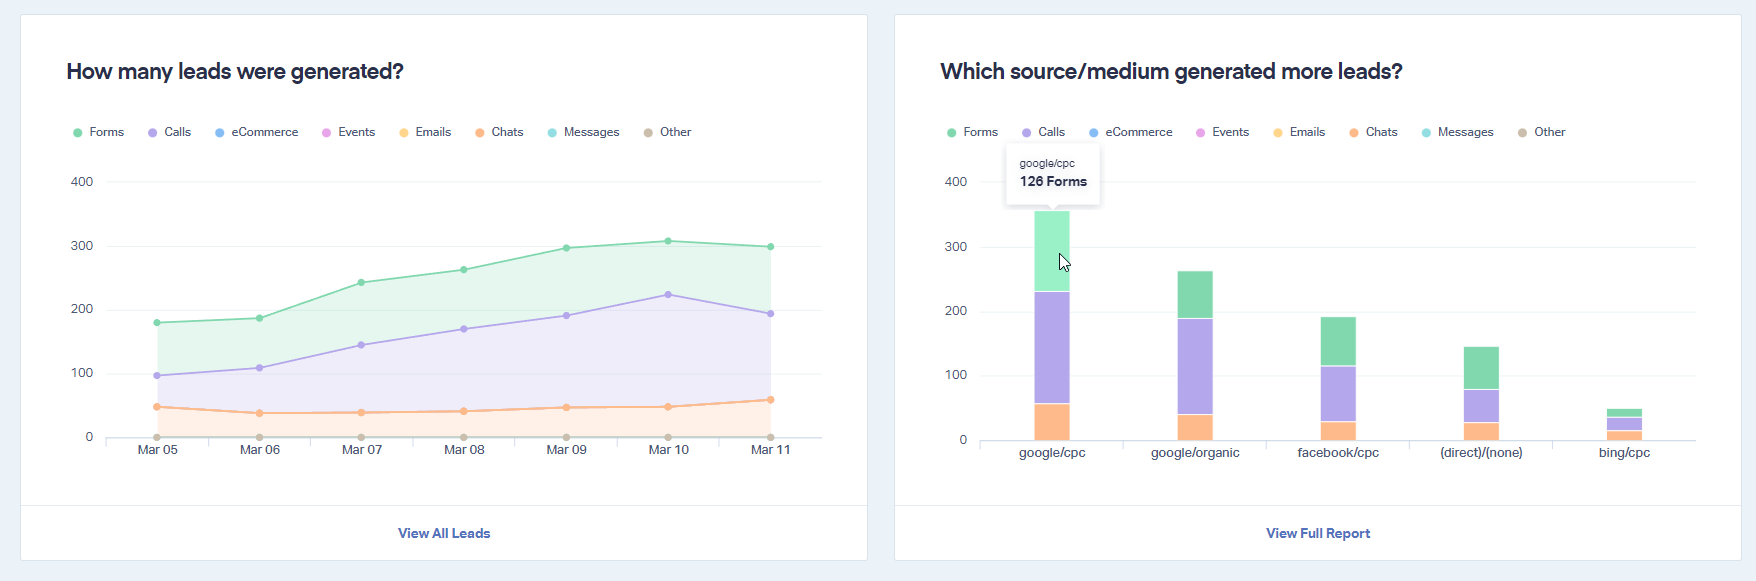
The "How many leads were generated?" chart reports how many leads of each lead type were tracked for each day. To review the leads that were tracked, click "View All Leads" at the bottom of the chart.
The "Which source/medium generated more leads?" chart reports the Source and Medium for the leads that were tracked for your date range. You can hover over the different sections to see how many of each Lead Type was tracked by source and medium as well. To review the full report, click "View Full Report" at the bottom of the chart.
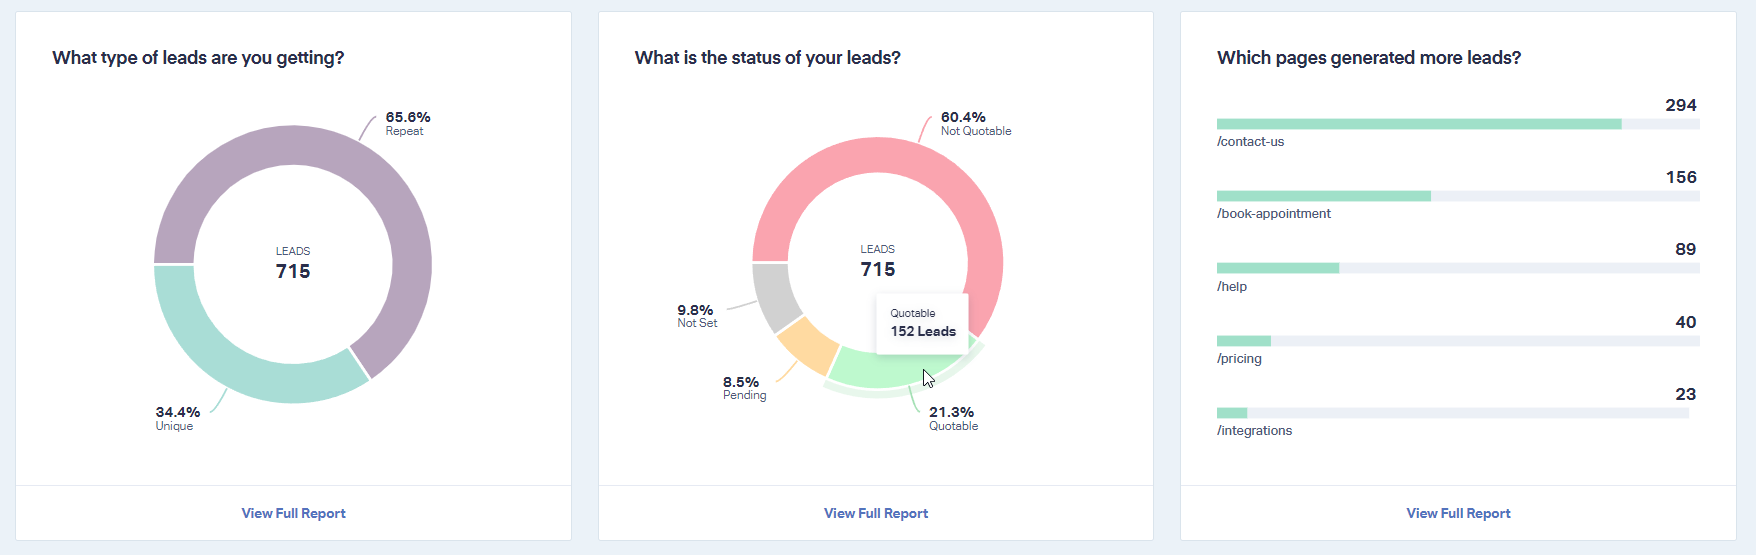
The "What type of leads are you getting?" chart reports your total leads with the number and percentage of Unique versus Repeat leads tracked.
The "What is the status of your leads?" chart reports your total leads with the number and percentage of Quotable, Not Quotable, Pending and Not Set leads tracked. The Quotable status of a lead can be updated manually or through a CRM integration that passes data back to your WhatConverts profile.
The "Which pages generated more leads?" report shows you the Lead Page that your leads are being generated from.
Click "View Full Report" under any of these reports to view more details.
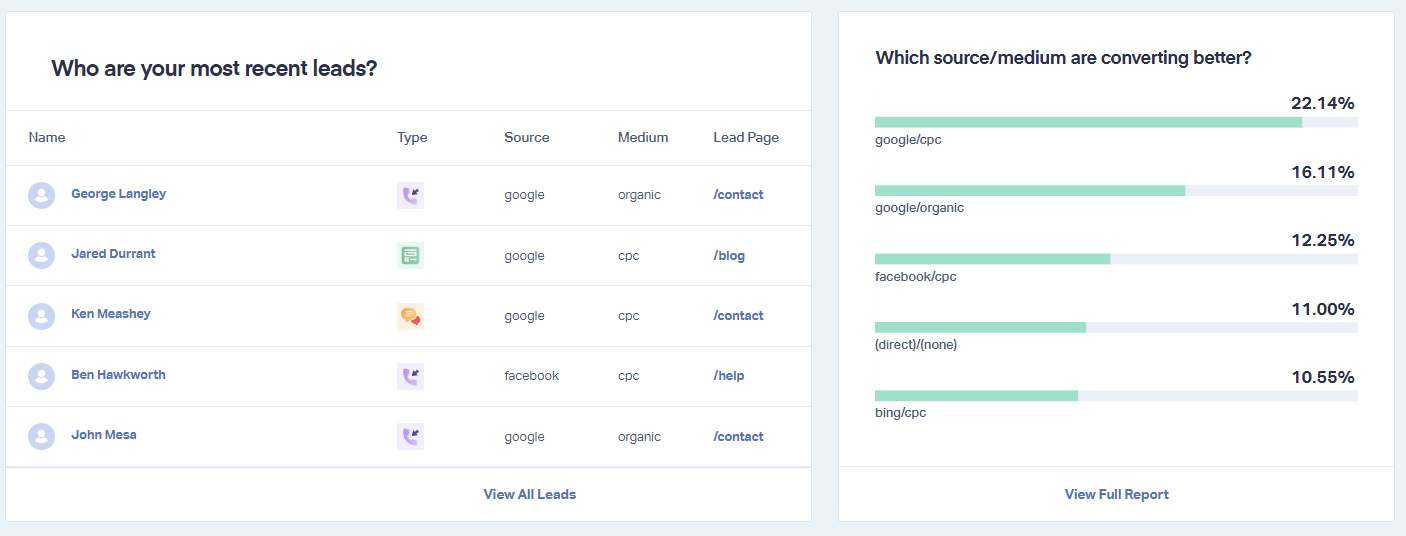
You can review your most recently tracked Leads in the "Who are your most recent leads?" chart. This chart will tell you Who contacted you, What type of lead they submitted, Where/How the user found your website and Which page they were on when they contacted you. Click "View All Leads" to be taken to your Lead Manager.
The "Which source/medium are converting better?" chart reports which Source and Medium are the most Quotable. This is another chart based on the Quotable status of your leads.
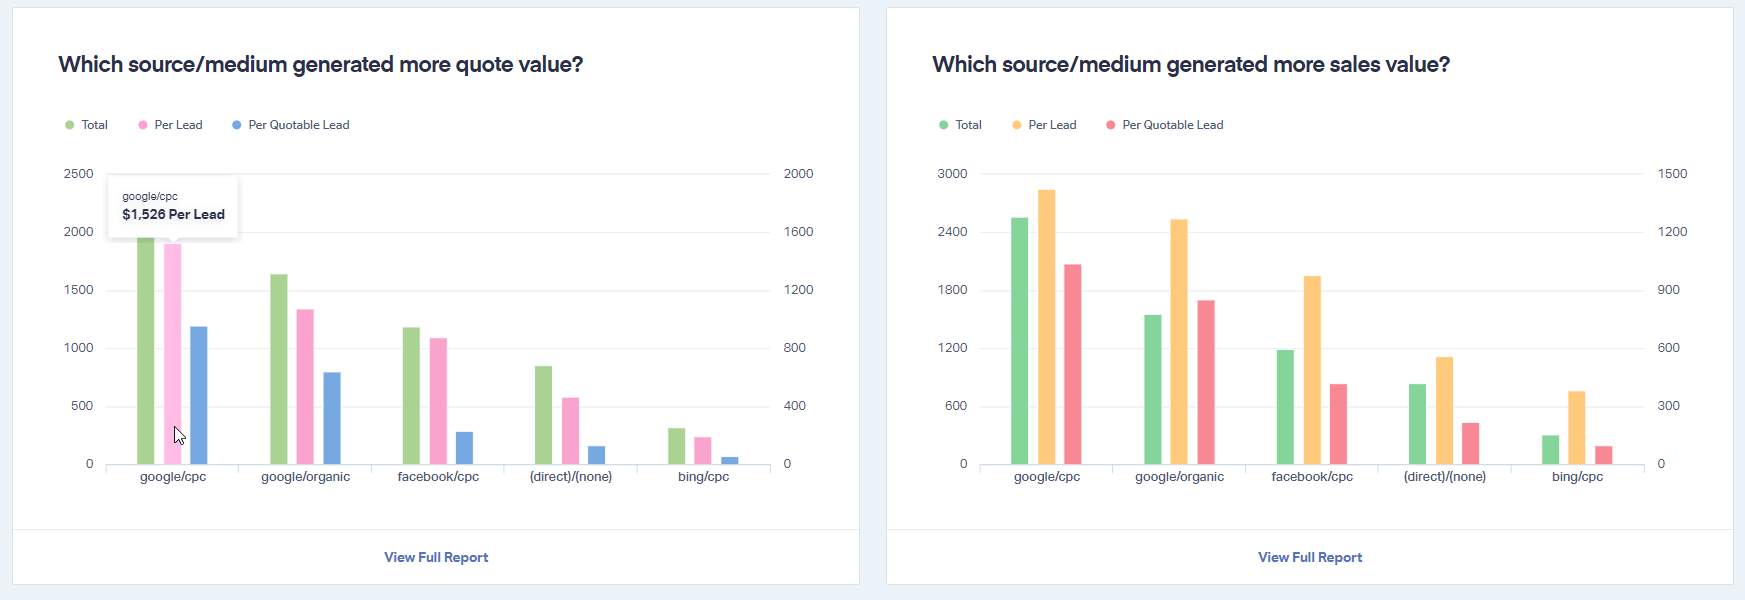
The final two charts report on the Source and Medium of the leads that are generating your Quote and Sales values. When reviewing the charts, hover over each bar column to see the Total sales or quote value tracked by source/medium, the Per Lead value tracked and the Per Quotable Lead value tracked. These charts will also be more enriched with data when you are updating leads with the Quote and Sales values.
If you have any questions, please contact us here: Contact WhatConverts Support or email support@whatconverts.com
Get a FREE presentation of WhatConverts
One of our marketing experts will give you a full presentation of how WhatConverts can help you grow your business.
Schedule a Demo


